Cars on Campus: Reducing Unnecessary Car Use on Williams College Campus
←
→
Page content transcription
If your browser does not render page correctly, please read the page content below
1

                   Cars on Campus:
Reducing Unnecessary Car Use on Williams College Campus

             Cameron Henry, Rick Redmond, Nora Morse
                   Environmental Planning 302
                          Autumn, 2007

                                 Client:
             Stephanie Boyd, Manager of Special Projects
   Acting Director of the Zilkha Center for Environmental Initiatives
              Office of the Vice President for Operations
                           Williams College
2

                                  Table of Contents
I.     Introduction----------------------------------------------------------------------------3
II.    Community Profile--------------------------------------------------------------------6
III.   Problem Identification and Scoping-----------------------------------------------9
IV.    Past Research and Emerging Trends--------------------------------------------10
V.     Laws and Policies--------------------------------------------------------------------13
       A. Town Laws------------------------------------------------------------------------14
       B. Williams College Policies------------------------------------------------------14
VI.    Ideas from Outside the Purple Bubble------------------------------------------16
VII.   Data Gathering-----------------------------------------------------------------------16
VIII. Student and Faculty Survey Results---------------------------------------------18
IX.    Analysis of Campus Safety and Security Data---------------------------------24
X.     Spring Street Parking Analysis---------------------------------------------------30
XI.    Potential Solutions-------------------------------------------------------------------32
       A. Athletic Field Van---------------------------------------------------------------33
       B. Bike Sharing Program----------------------------------------------------------34
       C. Bike Racks------------------------------------------------------------------------36
       D. Zipcar Incentives----------------------------------------------------------------38
       E. Charge-per-Use Sophomore Parking----------------------------------------39
XII.   Cost Benefit Analysis----------------------------------------------------------------40
XIII. Recommendations-------------------------------------------------------------------43

Appendix 1 – Survey Instruments---------------------------------------------------------44
       A. Survey for Faculty/Staff--------------------------------------------------------44
       B. Student Surveys (Students with Cars and Students without Cars
           respectively)----------------------------------------------------------------------47
Appendix 2 – Sample of Parking Ticket Data-------------------------------------------54
Appendix 3 – Motor Vehicle Regulations: Parking Agreement 2005-2006-------55
Appendix 4 – Interview Subjects----------------------------------------------------------60
3
I. Introduction
Patterns of parking and driving around campus have significant effects on campus
life, the Williamstown community, local business, and regional business, and the
environment at large. While it seems like a relatively small issue in the context of the
operations of the College, reducing driving behavior fits within many of the other
initiatives that the College has set forth to achieve, such as the Sustainability Initiative
and creating well-rounded citizens of the community at-large. Currently, the College is
beginning to monitor its carbon footprint and focus on a more environmentally
sustainable campus, which is in conflict with the increasing number of cars and parking
lots on campus. Although vehicle emissions actually contribute to a relatively small
percentage of Williams’ total emissions, driving is an ingrained part of the American way
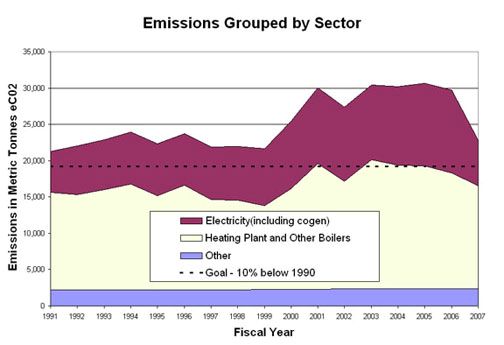
of life and a very visible contributor to the carbon footprint on the overall scale.4 Figure 1. 1 This pie chart shows the emission sources for Williams College, fiscal year 2006. It illustrates that College-related driving (i.e. faculty commuting and the university fleet) are only a small percentage of the emissions. However, this graph lacks student-related data, such as commutes from home to the College or off-campus trips, and thus is incomplete in that regard. Figure 2. 2 This figure is another representation of Williams’ emissions. Student, faculty, staff, and operations driving emissions fall under the category of “Other.” This graph shows that Williams has calculated its1990 emissions level in order to reduce its carbon footprint under the Sustainability Initiative. 1 This graph is from the Williams College Sustainability Report found at http://www.williams.edu/resources/sustainability/co2_sources.php. 2 Williams College Report on Greenhouse Gas Emissions Fiscal Year 2007 http://blogs.williams.edu/sustainability/2007/09/24/report-on-greenhouse-gas-emissions-during-fiscal-year- 2007 (accessed 10.15.07)
5

Figure 3. 3 This graph shows global carbon emissions by type (in millions of metric tons). The blue line
represents petroleum-sourced emissions, which is the category driving falls under. According to the
Environment News Service, the U.S. contributes approximately 45% of the world’s cumulative automotive
emissions. 4

The problem this project addresses is the unnecessary overuse of cars on Williams

College campus. The amount of driving by students, faculty, and staff in the process of

getting to and from campus, as well as between points on campus, is not in line with the

College’s goals of reducing greenhouse gas emissions and encouraging sustainable

lifestyles among its constituents. Driving also has many other negative impacts on the

campus such as congestion, noise, safety concerns for pedestrians and bicyclists,

infrastructure, and maintenance costs, which would decrease if overall driving rates are

reduced. The way we move to, from, and around campus also influences town/college

relations, the amount of money spent on security patrols, and the aesthetic and

environmental quality of college grounds, most notably the percent of campus that is

covered by parking lots.

3
 http://www.climatedome.com/who-is-responsible.asp (accessed 12.12.2007)
4
 Environment News Service. June 28, 2006. Accessed online 12.07.07 http://www.ens-
newswire.com/ens/jun2006/2006-06-28-03.asp
6

       Driving habits, like electricity usage, make good targets for reduction because

they are within the control of individuals, are publicly visible and therefore subject to

social or community pressure, and can have an immediate impact to motivate changes in

behavior. This study should help the College to understand the effects of car use on

campus and the town as well and come up with effective strategies to reduce unnecessary

driving. By addressing this issue, we hope to not only reduce student, faculty, and staff

driving habits on campus, but encourage mentalities and behaviors which lead to lower

impact lifestyles for all College members.

II. Community Profile

       The 450 acre campus is nestled in the heart of the Purple Valley, and as such,

Williams College is in a relatively remote location. Therefore unique issues exist when it

comes to campus driving and mobility. The campus is about half an hour from other

towns with commercial infrastructure, which makes the car an important mode of

mobility for both students who wish to visit outlying areas and faculty who want or need

to live outside of Williamstown and commute to work. The campus is physically

organized around the main thoroughfare of Route 2 which runs through the center of

campus, with Southworth and Water Streets bounding the East side of campus, while

North and South Streets roughly bounding the West side. The main routes of travel

around campus are small road branching off of Rt. 2, with the main business district

located on Spring Street, a small one-way road to the south of Rt. 2 as illustrated in

Figure 4 below.

       The organization of parking on campus for the most part relegates student parking

to larger lots on the periphery such as Mission Park, Thompson, and the Health Center
7
lots, and intersperses faculty and staff parking in smaller lots more evenly distributed
throughout campus. The map below shows the distribution of parking of approved and
restricted parking areas in and around Williams College.
Figure 4. 5 This is a map of Williams College Campus and designated parking areas. Student parking is
yellow, Faculty and Staff parking is blue, Visitor parking is orange, Restricted parking is pink, and Public
parking is green.
The first parking lot on record was built in 1941 for the Adams Memorial Theater,
with a steady increase in the amount of parking areas being built over the next 30 years. 6
5
Campus Safety and Security, Rules and Regulations.
http://www.williams.edu/admin/security/rules/vehicle/map.php (accessed 10.16.07)8
Two peaks of parking construction occurred during the mid-1960s and the mid- to late-
1990s. The trend towards greater parking capacity has a number of impact on college
operations. The level of car usage supported by the College through infrastructure such
as parking lots and road maintenance costs Williams in terms of both money and carbon
footprint. It is estimated that the average parking space costs from $2,000 (flat parking
lot) to $20,000 (parking garage) in initial construction costs alone. 7 The additional costs
of maintenance, not to mention the financial and environmental costs of paving land that
then becomes a storm water management and runoff problem, can add up quickly.
2,112 students compose the undergraduate population at Williams College. 323
faculty members and 745 administrative and staff members support them on a daily
basis. 8 678 student parking permits were issued by Campus Safety & Security in 2006-
2007. 9 The permits are administered via a lottery system. Students who register their
vehicles pay a $60 fee for a parking decal which specifies in which lot they may park.
In contrast, faculty and staff members receive two non-site-specific decals free of
charge. 10 There are parking spaces allotted for approximately 55% of faculty and staff
(not including service vehicle parking), while there are spaces allocated for 35% of the
student population. All told, there are about 1500 parking spaces for the Williams
community.
6
Williams College Facilities Property Book online, “History of Construction Projects”
http://www.williams.edu/admin/facilities/propertybook/const_proj.php (accessed 10.15.07)
7
Boston Metropolitan Area Planning Council, “Sustainable Transportation Toolkit: Parking”
http://transtoolkit.mapc.org/Parking/Issues/Problem_affordability.htm (accessed 10.17.07)
8
Demographic data from http://www.williams.edu/home/fast_facts/.
9
Campus Safety and Security records, courtesy of Dave Boyer
10
Interview, Dave Boyer, October 26, 2007.9
TOTAL 2,146
PARKING 581 Faculty/Staff
SPACES
72 Handicap
3 Post Office
122 Public
6 Reserved
60 Service Spaces
19 Temporary
18 Tenants
521 Visitors
3,174
315 Faculty
735 Staff
RESIDENT 2,124 Students
POPULATION
Table 1. 11 Allocation of parking spaces on Williams College campus.
III. Problem Identification and Scoping
Our client, Stephanie Boyd, the Acting Director of the Zilhka Center for
Environmental Initiatives, is seeking to reduce the amount of driving on campus in order
to address the problems outlined above. Her goals for this project are to create a
comprehensive picture of driving behavior of students, faculty, and staff on the campus,
11
Williams College Facilities Property Book online, “Parking Lot Capacities”
http://www.williams.edu/admin/facilities/propertybook/parking.php (accessed 10.16.07)10
and to use this information to develop feasible policy options and initiatives that address
undesirable behaviors. Thus, the main project objectives are to accurately describe
current trends in driving behavior of the student, faculty, and staff populations, to assess
how changes in College parking policy might affect the groups, their driving habits, as
well as residents of the Town, particularly the businesses on Spring Street, and to develop
possible solutions addressing the problem from multiple angles. The scope of our
solutions should address student, faculty, and staff needs and promote change through
positive incentives rather than negative prohibitions.
In order to fulfill these project goals, accurate and relevant data concerning the
driving and parking habits of the three subgroups (students, faculty, and staff) are
necessary. This data should encompass a variety of both directly and indirectly related
variables including place of residence, parking location, accumulation of parking tickets,
in addition to information like sports affiliation and student graduation dates. This data
should also be accompanied by documentation of the motivations of individual drivers in
order to provide the context necessary for effective solutions to be created.
IV. Past Research and Emerging Trends
In the autumn of 1999, there was an Environmental Planning project entitled Cars
on Campus that specifically examined “parking options and availability for people
directly associated with the College: students, faculty, and staff.” 12 They conducted
surveys to determine whether there existed a need for change, and if so, what that change
might be. The authors concluded that there were two lenses through which they could
examine the issue of parking: to meet the increasing demand for parking on campus or
12
Becca Parkinson, Tanu Kumar, Olivia Imoberdorf, Aya Reiss, Cars on Campus Environmental Planning
302 (1999), 1.11
alternately, provide an environmentally-friendly solution that encouraged non-automotive
transportation.
Before analyzing each option, they described the history of cars at Williams
College. Williams had been reluctant to allow cars on campus, but after the student body
expressed strong feelings of isolation, the acquiesced to the students’ demands around
1920. At the time of their research, the necessity for parking spaces increased
continuously and a number of new parking lots had been constructed to accommodate
this demand. As they saw it though, this desire for parking was not going to subside
soon, even with the addition of those lots, and the College was unwilling to provide any
more parking access on campus. 13
The authors then discussed the amount of parking spaces that existed on campus
at that time, as well as how the College allocated parking spaces to faculty, staff, and
students. They briefly discussed the role of Campus Safety and Security and the role they
played with parking enforcement. Finally, there was another brief paragraph which
illustrated the alternatives to driving, which include a local shuttle service, buses,
bicycling, and walking.
The results of their survey were telling. Over 60% of both the students and
faculty who responded expressed a desire for additional campus parking. Clearly
demand was high and thus the authors began to analyze two possible resolutions for the
problem. The first solution (meeting the demand) acknowledged that in order to achieve
this goal, construction was unavoidable in order to expand existing lots or create new
ones. They examined the economic and environmental cost of building a new lot (one
13
Ibid., 4. The College’s unofficial stance was conveyed by way of personal communication with Michael
Card.12
parking space costs $4,200) and tried to determine which lots might be expanded. 14 Of
the lots on campus, only six were available for the latter option. After their analysis, the
authors concluded that the Poker Flats, Dodd, and Weston lots were the best areas for
expansion.
An alternative to creating parking lots that the report examined would be the
construction of a parking garage. The authors looked at several different types of garages
and listed them from least expensive to most expensive (but did not give numerical data
to demonstrate their claim). 15 The parking garage option was not pursued very far due to
the high economic and environmental cost.
The report studied what other policies the College could enact to reduce car
presence and use on campus. Potential changes in the parking policy structure include:
increasing the parking decal price, creating an agreement between the College and
students demonstrating that having a car is a privilege, and eliminating student use of
faculty/staff parking. Alterations of the traffic pattern on campus could also achieve
some goals. Increasing signage and/or speed bumps, and decreasing traffic flow are two
options. The last policy change would be transportation alternatives which could include:
implementation of a community bike program, increased use of the College shuttle
service, and improving the ride sharing service.
The group then tackled the second option, the environmentally-friendly approach.
The report examined de-paving small lots which would “deliberately inconvenience the
students in order to prevent the unnecessary use of cars, increase green space, and
14
Ibid., 9. As conveyed by personal communication with Vince Guntlow.
15
Ibid., 14. Their list was the result of a personal communication with Eric Beattie.13
increase pedestrian use.” 16 This was the only mechanism that the students proposed for
the second option.
They recommended a solution which combined each option. Several lots would
be de-paved while the Dodd, Poker Flats, and Weston lots were enlarged which would
create a net loss of 70 spots. 17 Furthermore, they suggested that the College only issue
one decal to each faculty member, use a seniority-based allocation system to curb
underclassmen car use, increase the parking registration fee, enforce faculty parking
tickets, and use alternative transportation policies.
It is clear in the eight years since the release of the report that many of their
suggestions went by the wayside. The lots were not de-paved or expanded, the
transportation policies were not enacted, the parking registration fee remained the same,
and, to our knowledge, faculty parking tickets still are not enforced. The seniority-based
allocation system has been implemented it seems, but that may be it. From our
perspective, it appears that many of the same challenges faced by this team still exist
today and will need to be addressed to improve the parking situation on campus (by
improve, we mean to reduce the use of cars on campus).
V. Laws and Policies
A. Town Laws:
The Williamstown Zoning Bylaws discuss how and where to build parking lots in
§ 70-5.4. It discusses lighting, landscaping, and other site design requirements. These
rules would only apply to the proposed solutions “long-term parking lot” and
“underground parking garage.” Since the Mission Park lot already exists, we can assume
16
Ibid., 24.
17
Ibid., 25.14
that it was built according to the standards in the town bylaws. In § 70-6.1 the town has
set forth the regulations for off-street parking and loading. The code says that the
purpose of such parking is “to limit the amount of pavement coverage within the
Town.” 18 Generally, Williams College falls under the “Nonlisted uses” category as it
often must account for requirements set forth by the Inspector of Buildings or the
Planning Board. Thus, Williams usually has less parking per building than typically
required as it can rightly claim that its students tend to walk to get to class and areas of
interest. 19
B. Williams College Policies:
Except for first-years, Williams College allows students to bring a car to campus.
Students must register their cars for a $60 decal which covers the length of the school
year. There is a separate registration for cars and students on campus over the summer.
When not in use, each student must park his or her car at its designated parking lot.
Failure to do so will result in a parking fine. 20
VI. Ideas from Outside the Purple Bubble
After looking at campus maps for Wesleyan University, Middlebury College,
Colby College, Bowdoin College, Amherst College, and Mount Holyoke College, it is
clear that the parking model used at Williams is consistent with that of other New
England schools of similar sizes. For the most part, each school keeps the majority of its
student parking on the periphery, with only small lots and faculty lots intruding into the
middle of campus. This mirrors the situation at Williams, where the major lots such as
18
Williamstown Code, § 70-6.1A, page 7030.
19
Jamie Art. Personal communication. 11.13.2007.
20
Please see Appendix 2 for the 2005-2006 Parking Arrangement.15
Thompson and Lower Mission house the majority of the student cars while smaller lots
such as the parking lot near Perry account for a small fraction. The big parking lots at
these schools seem to be concentrated around the athletic facilities, as it is at Williams.
There is however, one significant difference. While Williams is built around a
commercial area (Spring Street) most other colleges are self contained. The closest
immediate parallel to Spring Street was a street separating the heart of Bowdoin from its
athletic fields, but this one was lined with houses instead of storefront spaces. Thus even
though Williams seems to have a parking situation that mirrors the other schools, this is
not the case. At Colby, for example, it makes no sense for a student living in a dorm to
drive his car on campus. If the student had parking in one of the bigger lots on the edge
of campus, he would have to go way out of his way to get the car in the first place.
However, even if he was lucky enough to have a spot in one of the nearby parking
spaces, there would be nowhere on campus worthwhile for the student to drive. At
Williams, however, it is possible to drive to Spring Street, leave your car there, and find
yourself in the center of campus with easy access to a car.
Much of the more interesting solutions to parking are taking place at bigger
schools. The University of Minnesota has received a federal grant allowing it to offer
access to public transportation for a reduced price to students and faculty. It is estimated
that an additional 8,000 people now use public transportation at the University. 21 At
Champlain College in Vermont, which is a Williams-sized private college, students and
faculty who walk or bike to classes at least three times a week for a four week period are
rewarded with $15 gift cards to local restaurants. 22 In addition, many Colleges and
21
http://www.peterli.com/archive/cpm/681.shtm
22
http://my.champlain.edu/public/parking/parking_programs.html16
Universities that encourage public transportation, carpooling, and other alternative means
of getting to campus offer reimbursement if somebody needs to take a cab in an
emergency. There are many possible approaches to transportation management on
college campuses, and the possible solutions for this campus will lie both within the
population itself and as well as ideas from the outside.
VII. Data Gathering
Rather than ask students on a survey how many miles per gallon their car gets or
other questions they may not know or are disinclined to answer, we decided to ask CSS
to provide us with information regarding student vehicle registration and parking fine
data. Dave Boyer graciously agreed to supply the records. The list is anonymous, but
with it we determined how many students per class had cars on campus, their home
states, parking lot assignments, and class year. In addition to this information, we
approached Chris Winters and requested that family income, dorm, athletic status, and
total fines amassed be included in the data. This information helped us conclude whether
or not there are trends regarding which types of students are more prone to getting
parking tickets and if financial motivations or disincentives are effective driving
regulators.
Dave Boyer mentioned in our interview with him that many merchants complain
that students drive to Spring Street too often. 23 They are concerned that students take
away parking spaces from potential customers. To determine the validity of this
grievance, we surveyed Spring Street itself and counted the cars parked there. Cars were
identified as student cars and faculty cars by whether or not they had a Williams parking
23
Interview, Dave Boyer, October 26, 2007.17
decal on them. A third category of cars, “other,” were those that were not explicitly
associated with Williams College, meaning they did not have a parking sticker and
included resident, merchant, and visitor vehicles. We divided up three weekdays into
four three-hour blocks (9am-12pm, 12-3, 3-6, 6-9) and a group member tallied the
amount of each type of car. We applied the same process to a weekend as well.
We interviewed Jaime Art, Dave Boyer, Tina van Luling, Wayne Haskins, and
Stephanie Boyd. Mr. Art is a lawyer who often advises the College on parking
regulations when it plans to construct a new building. He was also able to give us a bit of
perspective on parking as a former student, as well as a current community member. Mr.
Boyer is the Associate Director of Campus Safety & Security and was not only able to
provide us with car registration data and ticketing information, but also discussed the
history of parking during his tenure and also imparted some community perspective with
us. Tina van Luling supplemented Mr. Boyer’s information with her own knowledge of
student parking habits while Wayne Haskins discussed the feasibility of the charge-per-
use park lot solution described below. Stephanie Boyd not only helped clarify the
project’s goals but also served as a fount of information regarding Williams and
sustainability. Each interviews supplied us with information regarding institutional
memory in addition to community perspective.
Since a number of our survey questions were answered with the data from Dave
Boyer and Chris Winters, we decided to utilize surveys, one for students and the other for
faculty and staff, which we administered online via www.surveymonkey.com We made
two surveys because we understood the motivations for each group to be fundamentally
different. Students drive primarily to get to Williams and run errands or get to venues off18
campus while the latter group commutes to work. We crafted the surveys to determine
mentalities and habits associated with driving. The student survey also had questions
regarding potential solutions in order to find out what ideas might be popular. The
student and faculty/staff survey questions and the results may be found in Appendix I.
Our original plan was to integrate the results of security’s ticketing data with GIS
maps of Williams College to create a visual representation of the distribution of parking
tickets by lot. We anticipated that this would add a lot to our report, as anecdotal
evidence suggested that a car’s assigned parking lot had a heavy influence on the amount
of tickets one was likely to receive over the course of a year. However, after analyzing
the data, we found that there were not very significant differences in ticket distribution by
lot. This drastically reduced our projected value of using GIS in our presentation, as we
already had an excellent map that showed the location of the parking lots in a sufficiently
detailed and clear fashion for our purposes. In the end, we decided that the addition of a
GIS map would clutter the presentation and put an undue emphasis on the correlation
between assigned parking lot and number of tickets received, which our analysis had
revealed to be insignificant.
VIII. Student and Faculty Survey Results
We e-mailed a survey to 800 randomly selected students and another survey to
400 randomly selected faculty and staff. Participation in this survey was excellent, with
369 students responding and 282 faculty and staff replying. We assembled the survey
with the assistance of Chris Winters. We administered it online over
www.surveymonkey.com , which allowed us to use branching questions. This means that
students without cars did not have to answer any questions tailored to students with cars,19
helping to ensure we received relevant data. The survey was designed to answer some
questions regarding driving behavior that other methods could not and measure interest in
a few of the solutions we considered. While some questions provided us with more
helpful than others, the survey as a whole gave us a much better understanding of the
community’s driving habits, attitudes, and perceptions. We believe the survey was
answered honestly for the most part. Since it was anonymous, no incentive existed for a
student to answer deceitfully. We anticipated that some students who incurred large
parking fees might be reluctant to answer questions about their driving, or might have
been indifferent to our efforts altogether, skewing the results towards a better-behaved
student population. Also, we thought more faculty than staff would reply as we believed
faculty checked their e-mail more regularly, but this concern turned out to be unfounded.
67.8% of the survey respondents do not have a car on campus, while 32.2% of
students did. This statistic accurately reflected the data that we received from Dave
Boyer which said 32.1% of students have a car on campus. Most of the students without
a car seem happy without one, as 60% cited “Don’t need one” as a major reason for not
having a car on campus, though almost as many (59.5%) cited cost as a reason. Over
75% of the students without a car thought that not owning a car did not adversely affect
their Williams College experience, and only 3% felt strongly that not having a car was a
big hindrance. In addition, there seems to be absolutely no correlation between bike
ownership and car ownership, as about 79% of respondents in both groups replied do not
own a bike on campus. Students who do not own cars reported walking in over 90% of
their trips, and over 60% of them never borrow a friend’s car to drive. While this is a lot
of data, what it all points to is that car ownership is not a necessary facet of the Williams20
College experience. The campus is very compact and for most of the year students are
able to take advantage of everything the college has to offer without using a bike or car.
However, there is a strong interest in Zipcar amongst students without cars on campus
and a significant majority of non-owners do get rides, especially to off campus locations.
When Williams students drive, it tends to be to off campus locations, especially
restaurants and shops located away from the campus. Indeed, approximately 90% of
respondents said that they drove off-campus to restaurants and other locations, while 70%
of students said that they used the car to get to Williams from their home.
Driving Destinations
100.00%
90.00%
80.00%
70.00%
60.00%
50.00%
40.00%
30.00%
20.00%
10.00%
0.00%
s
n
s
pu
ow
s
ld
l m tre
er
ss
m
m
fie
et
th
eu
la
ea
ca
m
O
C
tic
us
Th
ho
f
of
le
th
to
s
ca
nt
/a
s
pu
ra
ym
Lo
au
m
G
ca
st
re
om
or
/fr
ps
To
ho
S21
Figure 5. This graph shows what locations students typically drive. Since this question was presented in a
“choose all that apply” format, the percentages represent how many students frequently drive to the given
destinations.
Much of the data from car owners confirmed the lack of importance car use has
on campus. Car owners estimated that they drove for only about 15% of their trips and
over 80% of car owners drive on a less than daily basis.
Modes of On-Campus Transport
% of on-campus trips
100
80
60 Car
40 No Car
20
0
Walk Bike Drive
Figure 6. This figure demonstrates that the vast majority of on-campus travel is achieved by walking.
Those who do not have a car walk and bike slightly more than their “with car contemporaries,” but the
disparity is not great.
Much of the driving that is done on campus tends to be part of multi-legged trips,
with students reasoning that they might as well drive if they have their car out anyways.
The data from students with cars confirm that most student drivers here are carpoolers,
with over 85% of car owners reporting that they have other students in the car with them
for off-campus trips at least some of the time with almost half claiming to carpool most
of the time. The idea of a long term parking garage was rejected, with over 90% of car
owners saying they would not be interested in using it. However, there are some
indications that one or two times a semester was too limiting, and people would consider
using it if they were given more free passes (five to ten per semester.)22
One potential fault of our faculty/staff survey is that it may represent a greater
proportion of faculty than it does staff due to its electronic distribution. However, the
excellent response rate we got on it (about 70%) implies that the e-mail distribution was
not as much of a barrier to entry as we feared it may have been.
Distance from Home to Williams: Faculty and Staff
35.00%
30.00%
Percent of Total
25.00%
Responses
20.00%
15.00%
10.00%
5.00%
0.00%
Less than 1 to5 5 to 10 10 to 20 More than
1 20
Miles from residence to College
Figure 7. This graph shows the distance faculty and staff live from Williams College. We recognize that
most people do not live within convenient walking distance (more than one mile), but almost 25% (64
people) of our respondents do. Thus, we hope to find ways to encourage their use of alternate forms of
transportation.
As illustrated in Figure 8, most respondents listed driving as their primary method of
getting to work, with walking finishing in a distant second, and biking and carpooling at
virtual ties for 3rd. Only four people listed carpool as their primary method of getting to
Williams though there was a greater percentage (still under 10%) who did participate in
carpools on occasion. About 35% of the respondents said they might be interested in
carpooling if Williams gave them a list of potential ride-sharers.23
Transportation Decisions and Distance from Campus
100
80
60 Secondary
40 Primary
20
0
Walk Drive Walk Drive Walk Drive Walk Drive Walk Drive
Less than 1-5 5-10 10-20 More than
1 20
Figure 8. This graph shows the decisions faculty and staff make when determining how to get to Williams
College. The overwhelming majority of respondents drive to work. It is encouraging though, that more
than half of those who live within a mile of campus walk to work regularly.
Once the staff and faculty get here, however, their driving habits begin to mirror students
closely. 18 people or 6% of those surveyed, use their cars to drive around campus on a
daily basis, and 172 respondents, or 60%, claim that they never do it.24
Breakdown of Faculty and Staff Driving During the Workday
70
60
50
40
30
20
10
0
Never A few A few At least Never A few A few At least Never A few A few At least (blank) (blank)
times a times a once times a times a once times a times a once
month w eek daily month w eek daily month w eek daily
Admin Faculty Support Staff (blank)
Figure 9. According to this graph, the vast majority of faculty, administrative, and support staff do not
drive once they get to campus.
Perhaps the most disheartening statistic is that only 4 people responded that they did use
public transportation to get here, and even for them it was not the primary method. This
confirms our suspicion that public transportation in this area offers virtually nothing to
anyone associated with the college as the population density is too low for it to be
effective.
The responses to both surveys indicate the same basic idea: driving at Williams is
primarily done to get off campus. Thus, any attempt we make to reduce car use on
campus should focus on providing people with reasonable alternatives to get to their
destinations and incentives to use those alternatives. For example, getting more faculty
to carpool could potentially reduce the emissions of Williams affiliated vehicles more
than any policy that restricted intra campus driving could.
IX. Analysis of Campus Safety and Security Data25
Driving behavior is intrinsically a difficult thing to monitor and measure. The
closest thing to an objective record of driving behavior available for Williams College
students are the records kept by Campus Safety and Security (CSS). CSS is the campus
authority in charge of parking and driving regulations on Williams College Campus. The
most prominent processes undertaken in this regard are permitting of faculty, staff, and
student vehicles, and ticketing vehicles violating parking regulations on College property.
Due to the nature of the way this data was gathered, it is intrinsically limited in what it
can tell us about the daily driving behavior of students. It only reports on students who
are breaking parking regulations, not legal driving behaviors. Despite these limitations, it
can also give us some valuable insight into what kinds of incentives work or do not work
to modify student behavior, what factors may cause differences in student driving
behavior, what may be causing inappropriate parking behavior, and how policies may be
shaped in the future to avoid causing further parking issues on campus.
We were able to utilize part of this database gather data on students with vehicles
on campus, with data on all registered student vehicles and all student vehicles which
received tickets, including registered lot, whether a car had been issued a ticket, and total
dollar amount charged for parking tickets. This database of information was then
merged, using student identification numbers, with College records on class, sex, home
state, financial aid status, and athletic participation. The identification numbers were
then disassociated from the data set and replaced by case ID numbers, allowing the
information to remain completely anonymous during analysis. See Appendix 1 for a
sample of the data.26
The data showed several interesting trends. One of the characteristics of the data
immediately noticeable is the distribution of ticket charges, which is heavily concentrated
near the bottom of the spectrum ($0-$150), but has an extreme range due to a number of
high outliers, as you can see in Figure 10 below.
0 1000 2000
Figure 10. Distribution of parking tickets, by total dollar amount, shown in both box plot and histogram.
The box plot especially shows the density of the center of the distribution and small number of highly
spread outliers.
To most students, parking tickets are the rare result of an absentminded mistake or
accidental infraction on parking regulations that is an exception to their regular driving
habits. To some students, a parking ticket is the price you pay for more convenient
parking. Examined in this light, this data tells us that financial incentives that penalize
students for certain behaviors are functional strategies for a majority of the population,
but some students behave independently of these incentives due to a high willingness to
pay for the benefits of parking illegally. In the context of the student body as a whole,
the number of students who are not affected by financial penalties is very small, as you
can see in Figure 11 below. This suggests that as a strategy, financial disincentives are a
very effective way of changing behavior.27
Distribution of Tickets over Student Body
No Car
Car, No Tickets
Car,28
Distribution of Campus Parking Registrations and Tickets by Class
45
40
35
30
Percent of Total
25
Percentage of total ticket revenue
20 Percentage of students with registered
vehicles
15
10
5
0
Unknown Senior Junior Sophomore Freshman
Class
Figure 12. Distribution of parking permits and parking tickets by class. Note: freshman vehicles are not
permitted, but are on record after accruing parking tickets.
The prevailing belief about driving behavior and parking tickets among CSS
officials is that students who live in dorms on the periphery of campus, especially male
students, tend to drive more and accumulate more tickets 24 . The data tell a slightly
different story, as you can see in Figure 13. The average fine assessed per student in all
of the student lots tends to be fairly stable, hovering between $25 and $50 (equivalent to
1 and 2 tickets, respectively). None of the dorms typically cited as the worst offenders,
such as Tyler or Garfield, showed a disproportional amount of ticketing. Nearly equally
far away from the center of campus, other peripheral lots such as the Health Center show
significantly lower total fines per parking space, contradicting the idea that peripheral
24
Dave Boyer. Personal communication. 10.26.2007.29
parking increases the amount of deviant parking problems on campus. The only real
outlier here is the Susie Hopkins lot, a very small lot with only 7 spaces, usually assigned
to the residents of the co-op. The co-op structure, which allows seniors to live in small
groups of friends communally, suggests that the high fines for this lot may be the product
of acceptance or encouragement of this kind of driving behavior in a small social group.
Average Parking Fines per Student
250
Parking Fines ($USD)
200
150
100
50
0
r
H Ga ty
Ag n
c
er W ler
on
s
rk
H rry
M C ld
oo t
ks
e ton
o m ns
Br d
d
sio te
Ft Lo
sa
ot
ow
gh
ar
od
lth ie
Pa
y
i s en
ps
oo
Th pki
sie Pe
lL
ag es
T
ea r f
s- No
n
ou
D
nk
Al
n
o
H
D
U
Su
pu
Av
m
Ca
ff
O
Figure 13. Average parking fines per student in each of the student lots. “No Lot” refers to unregistered
or otherwise unassigned vehicles, including all freshmen with cars.
On the other hand, there is great support for the assertion that male drivers tend to
accumulate more tickets. The number of males and females with registered vehicles is
nearly equal, but the amount of fines accumulated over the course of a year by the male
and female drivers shows quite a disparity, as shown in Figure 14 below. This also
suggests that improper driving behavior, and by extension driving behavior in general, is
likely a product of social norms, attitudes, and habitual behaviors than the direct result of
campus layout or specific policies.30
Distribution of Vehicle Registrations and Parking Tickets by Sex
70
60
50
40
Unknown
30 Female
Male
20
10
0
Percentage of students with Percentage of total tickets Percentge of total ticket
registered vehices issued revenue
Figure 14. Vehicle Registrations and parking tickets by sex. Persons of unknown gender had no vehicle
registration on file with CSS.
X. Spring Street Parking Analysis
The main commercial activity in the vicinity of the College is concentrated along
a short one-way road running through the southern half of the campus. On Spring Street
15 to 20 small businesses rely on the availability of on-street parking for their customers,
although a small public lot is located at the end of the road for overflow purposes. In
order to address the concern that student parking on Spring Street occurs at a high enough
rate to inconvenience shoppers and negatively impact business interests 25 , we collected
daily data on the number and affiliation of the vehicles parallel parked along the street.
The results of these daily counts were then averaged to provide an approximate model of
the daily flow of traffic and parking availability shown in Figure 15.
25
Jamie Art. Personal communication. 11.13.2007.31
Distribution of Users of Parking on Spring Street
60
50
(average daily value over 5 sample days)
Unmarked
Cars
Number of Parked Cars
40
Registered
Student
30 Registered
Faculty/Sta
ff
Total
20 Parked
Cars
10
0
9am-12pm 12pm-3pm 3pm-6pm 6pm-9pm
Time of Day
Figure 15. Daily model of parking patterns on Spring Street, showing the different traffic patterns typical
of residents and tourists, as well as Williams College faculty, staff, and students.
The data clearly show that the number of student, faculty, and staff cars parked on the
street at any given time is fairly low in relation to the total number of cars parked and to
the approximately 60 total available spaces. While unmarked cars (presumably
composed of Williamstown residents, visitors, tourists, etc) peak in number in the early
afternoon, student and faculty vehicles tend to increase in later afternoon (generally rising
sharply around 4 pm) and peak sometime in early evening, when the number of
unmarked cars begins to fall steeply. From our general observations, the vast majority of
all student vehicles park on the northernmost end of the street, between Morgan Hall and
Chandler Gymnasium, where there are no businesses. Further south along the street
where most businesses are located, parking is generally taken by unmarked vehicles and a
occasionally a faculty or staff vehicle. Taken together, this data suggests that on an32
average day there is no conflict between student parking and customer parking for Spring
Street businesses.
While students, faculty, and staff of the College unquestionably comprise a large
amount of the customer base for merchants on Spring Street, the relationship between the
College and residents is tied closely to the College’s ability to control the flow of traffic
created by its members, lest it be seen as an interference to the commercial and social
functions of town life. Thus it is important to know whether or not students, faculty, and
staff are currently creating a traffic problem on public streets, as well as to contextualize
how future changes in policy or behavior would affect businesses and residents.
XI. Potential Solutions
It has been very difficult for us to judge the level of institutional will to
implement any parking recommendations that we make. There is a general consensus
that we don’t want to implement any ideas that would antagonize students, and being car-
driving students ourselves, we agree with that. Furthermore, policies must be created in
such a way as to minimize overflow parking onto public streets like Southworth and
Spring Streets. We certainly do not want to advocate anything that would strain the
relationship between Williamstown and the College. Also, we would like to ensure that
residents of the town can still utilize College services like the athletic facilities and
library system. Other concerns include guaranteeing access for emergency, delivery,
Buildings & Grounds vehicles. Last we want to make sure that everyone can participate
in cultural and sporting events.
With those concerns in mind, we are looking at recommending a broad range of
solutions, any of which would be an improvement in itself though some may be33
synergistically improved by the implementation of others. Ideas we have range from
small things such as increasing the number of covered bike racks on campus and offering
faculty incentives to only take one parking sticker or to share their parking sticker with a
co-worker (to encourage carpooling), to much more complicated solutions such as
designating a charge-per-use parking lot.
A. Athletic Field Van
Members of the varsity football, soccer teams, and rugby (club sport) teams drive
to Cole Field daily during the fall to practice as evidenced by the parked cars lining both
sides of the roadway. To mitigate this, the College could hire students to drive some of
the vans down to practice. Student-drivers would only need a van license to operate the
vehicles which does not require any testing, contrary to a light bus which would
necessitate more extensive licensing and possibly a new hire for the college. The
student-drivers could be paid an hourly wage of $8 and work for two hours (pre-practice
and post-practice pickup). The football team is moving to Weston Field next year 26
which should remove some of the pressure from Stetson Road; however we do not want
the same problem transferring itself to the Weston lot, or worse to Spring Street, so
perhaps such a program could be expanded to accommodate those players as well. To
help ensure that students utilize this service and do not continue to drive to practice,
Campus Safety & Security (CSS) could rigorously ticket offending students. Coaches
and medical staff would be allowed to continue parking at the fields as necessary to
transport equipment.
26
Stephanie Boyd. Personal communication. 11.27.0734
Not only would such a program be useful on practice days, but the College could
also utilize it on game days. A large number of students drive down to Cole Field on
Saturdays and Sundays to watch the soccer and rugby teams compete. By removing the
student cars, there could be more room for parents and visitors alike. Also, there would
be less congestion which would help an ambulance or emergency vehicle access the
fields. Again, CSS could ticket students who drive down to the fields.
Clearly the van service would not be the only method for student-athletes and fans
to access the fields. The program would promote walking and biking to the fields by
virtue of eliminating the possibility of students driving down to the fields. Costs of such
a service include the student-driver wage of $8/hour and fuel for the vans.
B. Bike Sharing Program
We suggest that the College institutionalize a bike sharing program. While a
number of student groups have attempted to jumpstart a bike sharing program over the
years, none have found success. Results from a survey given to both students with cars
and students without cars indicated that over 70% of students from each group expressed
a desire for such a program, as illustrated in Figure 16. 27
27
78.0% of students with cars and 72.3% of students without cars.35
Support for Potential Initiatives
100%
90%
A biking path or lane with
80% limited pedestrian traffic
70% A bike rental or bike sharing
60% program
50% Covered bike racks outside
40% academic buildings
30% Covered bike racks outside
Paresky Center
20%
Covered bike racks outside
10%
your dorm
0%
Indoor bike storage in your
No Car- Car- First No Car- Car- dorm
First Choice Second Second
Choice Choice Choice
Figure 16. This graph show the levels of support expressed in the student survey for different bike
initiatives, broken down to the primary and secondary choices for students with cars and students without
cars. According to the survey, students primarily want a bike sharing program, while covered bike racks
are a popular second option. Indoor bike storage is another popular idea since many students do not wish
to risk damaging their bikes with rust from storms and winter exposure.
To reduce the possibility of theft or vandalism, there could be a system set up where a
rider signs out a bike and assumes all responsibility for damages to the bike.
Furthermore, the bikes could be painted one color so that other students are made aware
of the fact that the bike is the College’s property and any intentional harm done to the
bike would incur some penalty (e.g. paying for damages and given a strike). In order to
fund repairs to the bikes, there could be a nominal membership fee for using the bikes,
$10 per year for example, or perhaps some sort of advertising could be placed on the bike
frames. 28
Another concern for having a bike program would be insurance. Williams would
have to ensure that the bikes were properly maintained, but clearly it is not in the
28
The idea for advertising came from this website: http://www.ibike.org/encouragement/freebike-
issues.htm#Starting (Accessed 11.28.2007)36
College’s best interests to be held liable for any injuries sustained while using a College
bike that is in good condition. 29 Therefore, members of the bike sharing program would
sign a form waiving the College’s responsibility. In addition, it would stipulate that they
abide by all laws related to biking.
A system run by Williams College rather than by a student organization is more
likely to succeed as it has the funding to cover costs and can have the necessary oversight
for running the program. In terms of how to supply the program with bikes, in addition
to purchasing new (and used) bikes outright, perhaps Williams could arrange a deal with
Spokes, the local bike shop, in which the shop refurbishes old bikes and sells them at a
reduced price. In addition, Spokes would be contracted for bike repairs and maintenance.
Thus Spokes could have a customer for old bikes and parts that local residents might not
want to purchase in exchange for safe bikes that such a program would require. Also,
Williams could ask graduating students to donate or sell their bikes at a reduced price
once they leave as transporting bikes is not always easy or convenient.
C. Bike Racks
It appears that having a car does not affect whether or not a student is more likely
to own a bike campus as bikes are almost evenly distributed between the student groups.
29
http://www.ibike.org/encouragement/freebike-issues.htm#Starting (Accessed 11.28.2007)37
Own a Bicycle?
90.00%
80.00%
70.00%
60.00%
50.00% Yes
40.00% No
30.00%
20.00%
10.00%
0.00%
No Car Car
Figure 17. This graph demonstrates that bikes are evenly distributed amongst student with cars and
students without cars.
That said, an overwhelming majority of the surveyed students said they would be more
inclined to bike around campus if there were more covered bike racks. 30 The campus has
bike racks at virtually every dorm on campus; however there are few bike racks located
around academic buildings. A glance at Griffin and the Morley Science Center highlights
this problem. Presumably covered bike racks would reduce rusting and prolong the life
of the students’ bikes, allowing them to bike more and drive less. DERO Bike Rack
Company sells bike racks to at least 68 universities and sells space-saving racks (useful
as covered racks) as well as the swerve bike racks (like those outside of the Paresky
Center). The swerve bike racks cost $95 per rack. A more exciting bike rack in the
shape of an Eph could be custom made by DERO. Their website sports a purple bull
rack, so this option seems plausible. These racks are more expensive so maybe only one
or two should be ordered, but they are unique indeed. They could raise bike awareness
30
See Figure 8.38
on campus and even inspire faculty and students to ride their bikes more frequently just
for the chance of locking their bikes into such a rack.
D. Zipcar Incentives
Zipcar is a “short-term car rental service” which has recently become available for
Williams students, faculty, staff, and even town residents. 31 There is an annual
membership fee of $35 and an hourly usage charge of $9-12. 32 Not only will this service
provide transportation to off-campus locations from students, but it may also reduce the
amount of student driving around campus. Should this program become a mainstay at the
College, it is possible that some students leave their cars at home due to the availability
of cars on campus, a hope expressed by Director of Administrative Services Tim
Reisler. 33 Not only would there be fewer students with cars on campus, but College-
related greenhouse gas emissions would decline as well.
For those students without cars who would otherwise be eligible to drive on
campus (i.e. everyone except freshmen), Williams could pay the annual fee for them
which gives them a $35 credit for the program. We hope that in light of this, students
who would to school would consider leaving their cars at home due to the availability of
Zipcar. Some might argue that such incentives would negate the effects of students
leaving their cars at home; however, $35 only allows a driver about 4 hours of time with
a car. Presumably this would be less than round trips of coming to Williams and that
additional time spent driving once on campus. 75% of students with cars were not
31
Julian Suhr, “Flexcar Brigade Provides Rentable Cars for the Rideless,” Williams Record, News,
September 19, 2007.
32
For the $35 charge see Ibid. Regarding the hourly charge see Steve Arenas, “Telecommunication Issues
Delay Flexcar,” October 31, 2007.
33
Tim Reisler as quoted by Suhr.39
interested with the Zipcar program while 118 (50%) students without cars were
somewhat interested and 42 (18%) were very interested with the service.
For faculty and staff, we suggest that the College pay for their annual fee if they
only have one non-site specific parking decal. For faculty and staff who do not take any
decal whatsoever could have a larger credit of $100. Thus, those who carpooled or
walked would have access to a car in emergency situations and could leave if the
circumstances demanded such action.
E. Charge-per-Use Sophomore Parking
Rather than pay $60 for a parking decal as is the norm for students who wish to
bring a vehicle to college, we suggest creating a charge-per-use parking lot for which the
decal would be free. We chose the sophomore class because we hope to encourage
sustainable lifestyles early on in a student’s career. Mission Park lot should be
designated for this lot as it has a 125 student vehicle capacity (there are other spaces
reserved for faculty/staff, service, etc.), is enclosed with a fence, and only has one
entrance/exit so one gate and card-reader would be necessary. 34 Furthermore, the
College plans to expand the lot to accommodate lost student parking at Weston lot, so
there should be enough space for the entire sophomore driving population. 35
Each student would be allowed to use their car free of charge four times each
semester. Every subsequent trip would cost $6. Of course, this fee would be waived for
medical emergencies (with proof [e.g. a bill] of a doctor or hospital visit). Over the
course of a year, that would translate to one needing to take their car out 18 times (8 free
rides+ $60/6), or twice a month (18 trips/9 months), to reach the $60 students currently
34
http://www.williams.edu/admin/facilities/propertybook/parking.php (Accessed 11.28.2007)
35
Personal communication. Stephanie Boyd. 12.9.07.You can also read