CAT-i Bulletin - Guy Carpenter
←
→
Page content transcription
If your browser does not render page correctly, please read the page content below
CAT-i Bulletin Report Date:
December 28, 2018
Catastrophe Information
Sydney Hailstorms, December 20, 2018
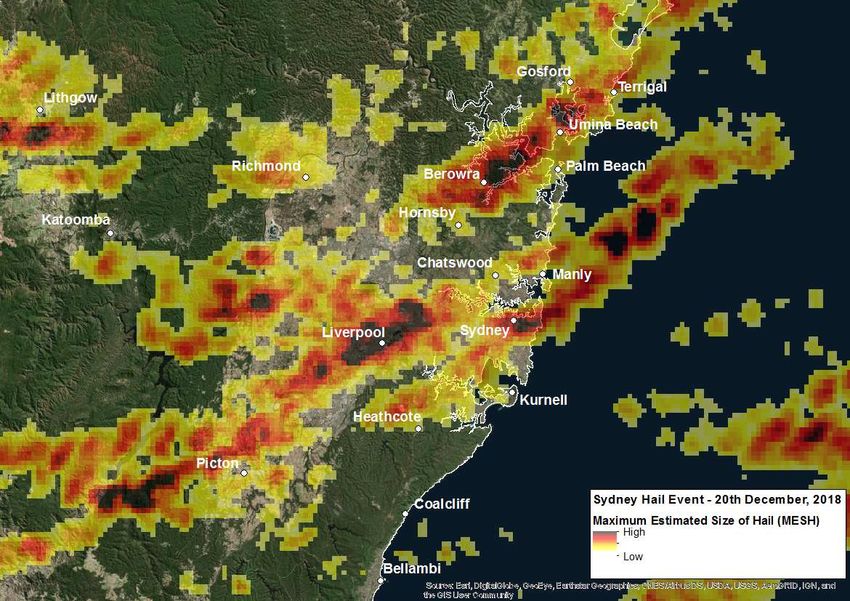
Hail Swath for the Sydney Hail Event.
Source: Dr Joshua Soderholm, Monash University, using radar data from the Australian Bureau of Meteorology.
Summary
A severe convective storm affected large parts of New South Wales, including Sydney, the Central Coast, and
Wollongong from 4:00 to 7:00 pm on December 20, 2018. The storm generated large hail, damaging winds,
and flash flooding in many areas of the state. According to the Australian Bureau of Meteorology (BOM), there
were ground reports of hail of 8 cm diameter in Berowra Heights in Sydney’s north and similar size hail in
Casula and Liverpool in the city’s southwest. The Nattai National Park west of Picton also experienced large
hail. Initial damage reports indicated that the suburbs of Berowra Heights, Hornsby, Liverpool, Gosford, and
Lithgow were the most severely affected. Given that the event occurred during the Christmas holidays, many
residents and businesses have not fully assessed the extent of damages; therefore, loss estimates are
expected to increase in the next few weeks.
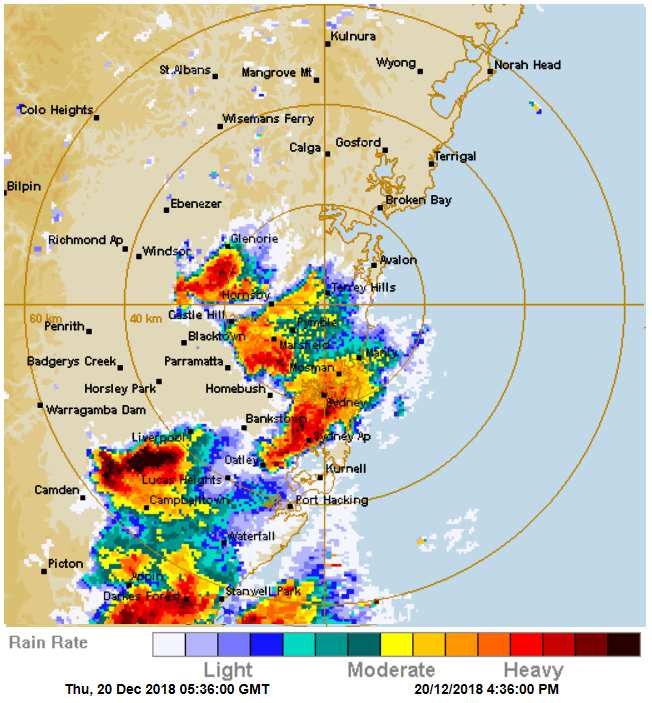
Meteorological Discussion
The BOM issued severe storm warnings in the afternoon of Thursday, December 20 across large parts of the
state of New South Wales, including Sydney, the Hunter Valley, Newcastle, Wollongong, and Dubbo. Multiple
storm cells tracked across Sydney and the Central Coast from 4:00 to 7:00 pm local time.
The initial storm cells moved in a westerly direction across Sydney’s southwest suburbs around 4:30 to 5:00
pm (shown below left). The southern storm cell moved across Liverpool and Bankstown around 5:00 pm, and
then moved across the Northern Beaches at about 5:30 pm. The northern cell tracked toward Hornsby and
then northwest toward Berowra Heights and Cowan, where it appeared to intensify, with larger hail. This cell
then continued to track toward Gosford in the Central Coast.

Estimated Rain Rate at 4:30 pm (left) and 6:30 pm (right), based on Sydney (Terry Hills) Radar Loop.
Source: BOM

Another series of storm cells developed around 5:30 pm over the southwest of Sydney and the Central Coast.
The first cells with hail developed over Lucas Heights, and then moved over Sydney airport at about 6:00 pm.
In the north, a second storm cell intensified with hail and moved across Gosford around 6:00 pm.
Subsequently, another cell developed over Sydney’s southwest, passing over Liverpool and Homebush at
about 6:30 pm (shown above right).
The front page of this report shows an image of the preliminary Maximum Estimated Hail Size (MESH)
mapping developed by Dr. Joshua Soderholm of Monash University using the radar data from the BOM. The
hail size estimates are based on a hail algorithm applied to radar scans from the Wollongong radar, with a
minimum hail size threshold of 2 cm. MESH is estimated based on radar reflectivity in the thunderstorm
clouds, and may therefore vary in size and in space to the actual hail recorded on the ground. The map shows
the largest estimated hail in the atmosphere occurred around Berowra in Sydney’s north and Liverpool in
Sydney’s southwest.
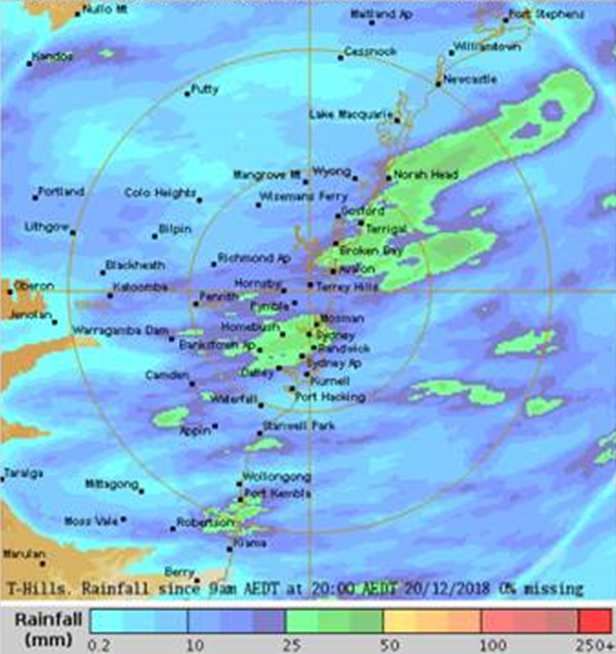
In addition to hail, significant rainfall was recorded across the Sydney basin and Central Coast regions (shown
below left). According to BOM, rainfall totals exceeded 25 mm in several areas of southern Sydney and the
Central Coast. The rainfall produced flash flooding in several locations, including multiple points along the
Great Western Highway, Macquarie Street in Windsor, and Warringah Road at the Roseville Bridge.
There were also reports of damaging wind gusts of more than 140 km/hr at Narrabri and Wee Waa on the
northwestern slopes, while Murrurundi and Scone reported wind gusts of 114 km/hr and 111 km/hr,
respectively. The figure shown below right shows the wind gusts measured by Doppler Radar from Sydney
(Terry Hills).

Rainfall Estimates (left) and Doppler Wind Estimates (right).
Source: BOM

Following the Sydney event, several thunderstorms affected Brisbane and the Gold Coast on Friday,
December 21 and Saturday, December 22.
Impacts

The BOM has described the storm as the “worst hailstorm in 20 years”. The largest hail loss occurred on April
14, 1999, which affected large areas of Sydney’s eastern suburbs with maximum hail sizes of 9.0 cm and a
normalized loss of around AUD 5.6 billion (Table 1 below).

Based on initial media reports, many homes and businesses have sustained damage to roofs, awnings, and
solar panels. Additionally, overflowing gutters caused interior damage to some properties. For motor, initial
damage reports indicate that many windshields were smashed, and cars have been impacted by flash
flooding.
Meanwhile the events of December 21 and 22 produced loss of power to around 45,000 homes and some hail
damage to homes and cars. However, impacts appeared to be more limited than those from the Sydney event.
The Insurance Council of Australia (ICA) has issued declared postcodes for claims collection. The declared list
includes 541 postcodes covering large parts of New South Wales. According to the ICA, the NSW Office of
Emergency Management (OEM) has established information points in Berowra Heights and Chipping North to
assist with recovery.

In terms of insured losses, the event remains in the early stages of development. The ICA reported that
insurers received around 45,000 claims by 8:00 am on December 22, with an estimated loss of approximately
AUD 210 million. About three-quarters of these claims are from motor. This loss estimate is expected to rise
over the next few weeks, in part because many are traveling and businesses are closed for the holiday period.

The table below provides a comparison of maximum reported hail sizes and loss estimates for historic hail
events, based on the ICA disaster statistics.

Comparison of reported hail sizes and insured losses for historic hail events
Source: ICA.

                                             Max Reported           Original Loss      Normalized Loss
               Hail Event
                                             Hail Size (cm)              ($)4               ($)4
         April 14, 1999 Sydney                      9.0                   1.7 B                5.6 B

        March 18, 1990 Sydney                       8.0                  0.32 B               1.68 B

      December 9, 2007 Blacktown                    8.5                  0.42 B               0.59 B

      March 6-7, 2010 Melbourne                     10.0                 1.04 B               1.63 B

        March 21-22, 2010 Perth                     6.0                  1.05 B               1.34 B

      November 27, 2014 Brisbane                    8.0                  1.39 B               1.54 B

           December 20, 2018                        8.0

Sources: Australian Bureau of Meteorology, Insurance Council of Australia, ABC News, SBS News, the
Australian, Reinsurance News.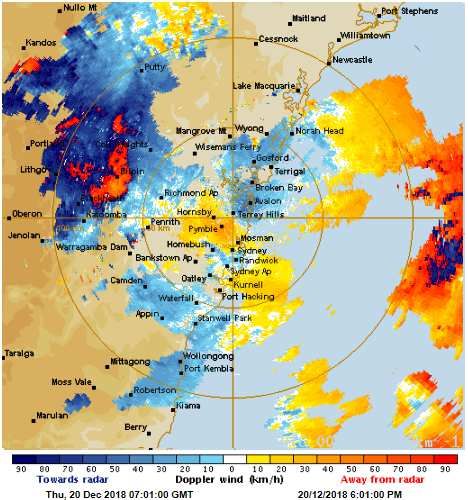
For more CAT-i reports and further information on the service, please go to
http://www.guycarp.com/portal/extranet/insights/catcentral.html.

Disclaimer

Guy Carpenter & Company, LLC, Guy Carpenter & Company Ltd. or Guy Carpenter & Company, S.A.S., as
applicable (collectively referred to herein as “Guy Carpenter”) provides this publication for general
informational purposes only, and does not accept responsibility for the completeness or accuracy of the
information contained herein. All information used in this report is based on publicly available information, as
of a specified date. Readers are cautioned against placing undue reliance upon any statements contained
herein. Guy Carpenter does not undertake any obligation to publicly update or revise the material herein,
regardless of new data, or otherwise. This document is not an offer to sell, or a solicitation of an offer to buy
any financial instrument or reinsurance program. This report is proprietary to Guy Carpenter. The
dissemination, reproduction or use of this report without Guy Carpenter’s express written
permission is prohibited.

You can also read