CERI Electricity Report - Canadian Energy Research Institute

Page created by Willie Shelton
 
CONTINUE READING
CERI Electricity Report - Canadian Energy Research Institute
March 2018

CERI Electricity Report

Electricity - The Year in Review                                                         Manitoba’s foray into new hydroelectricity projects
Allan Fogwill                                                                            centres on the Keeyask project on the Nelson River. This
                                                                                         695 MW project is being built in a partnership between
Looking back to 2017, there were a number of key                                         Manitoba Hydro and four First Nations. This project and
events. Most dealt with the transition toward low                                        Bipole III, which is an approximately 1,400 km DC
emitting options including the increased use of                                          transmission line addition, are currently facing cost
hydroelectricity, and the evolution to lower carbon                                      overruns which have increased the concern of
generation.                                                                              Manitobans regarding the financial viability of Manitoba
                                                                                         Hydro.
Electricity prices in 2017 were stable in each province.
The one exception is Ontario, where the Fair Hydro Act1                                  Manitoba Hydro’s debt is anticipated to escalate to
was passed in June. The Act adjusts the financing for a                                  approximately $25 billion3 which will create added
portion of the electricity commodity expenses. The                                       pressure to increase rates by upwards of 46 percent over
result is an average decrease in electricity bills by 25                                 five years.4 A realization of this cost pass-through would
percent and then increases limited to inflation until 2022.                              have significant impacts on industrial, commercial, and
Concerns have been raised suggesting some of the                                         residential customers. Moreover, the higher cost of this
electricity costs are being paid by tax payers instead of                                hydroelectricity will be in direct competition in some
rate payers.                                                                             northern US states for electricity exports. A recent study
                                                                                         by CERI shows that the cost of hydro reservoirs is around
2017 was a busy year for hydroelectricity projects.                                      9 cents/kWh while biomass, natural gas combined cycle,
                                                                                         wind and solar photovoltaic all range between 5 to 6
In BC, a new provincial government in June asked for a                                   cents/kWh.5 That leaves future exports of Manitoba’s
review of the BC Hydro Site C project.2 This project had                                 additional hydro capacity in question.
been proposed at various times over the last thirty years.
The argument from BC Hydro was that the project was                                      Ontario and Quebec were seen to be forging a new
needed to supply low-cost non-emitting electricity to                                    electricity market relationship in 2017, based on Hydro
meet provincial growth in demand and exports to                                          Quebec’s hydroelectricity capacity and storage. The
Alberta and states on the US west coast. The concern                                     relationship includes 2 TWh per year of energy to
was for the environmental footprint of this large                                        Ontario, 500 MW of surplus capacity to Quebec, and the
reservoir project and the fact that under the previous                                   use of storage hydro in Quebec to manage intermittent
government, the project was exempted from an                                             resources in Ontario.6 Capacity commitments between
environmental review. However, after a review by the                                     Canadian provinces are unique. The only other capacity
BC Utilities Commission, the provincial government                                       commitment in Canada, currently, is the long-term
decided it was cheaper to continue work on the project                                   contract between Quebec and Newfoundland and
instead of cancelling it. The 1,100 MW hydroelectricity                                  Labrador regarding the construction and operations of
project is expected to be complete in 2024.                                              the Churchill Falls project.

                                                                                         Along the Churchill River, a second hydroelectricity
CERI Electricity Report
                                                                                         project is being constructed at Muskrat Falls. 2017 saw a
Editorial Committee: Ganesh Doluweera, Dinara Millington, Megan Murphy, Allan Fogwill    critical review of the decision making regarding the
About CERI
                                                                                         sanctioning of that project. An update of the project also
The Canadian Energy Research Institute is an independent, not-for-profit research        in June 2017 indicated the final cost of the project was
establishment created through a partnership of industry, academia, and government in
1975. Our mission is to provide relevant, independent, objective economic research in    estimated to be $12.7 billion.7 Costs associated with the
energy and related environmental issues. For more information about CERI, please visit   project are projected to almost double retail electricity
our website at www.ceri.ca or contact us at info@ceri.ca.

                                                                                                                Relevant • Independent • Objective
Page 2

rates over 23 cents/kWh by 2022. If this does occur,     The Atlantic link project was rejected by the
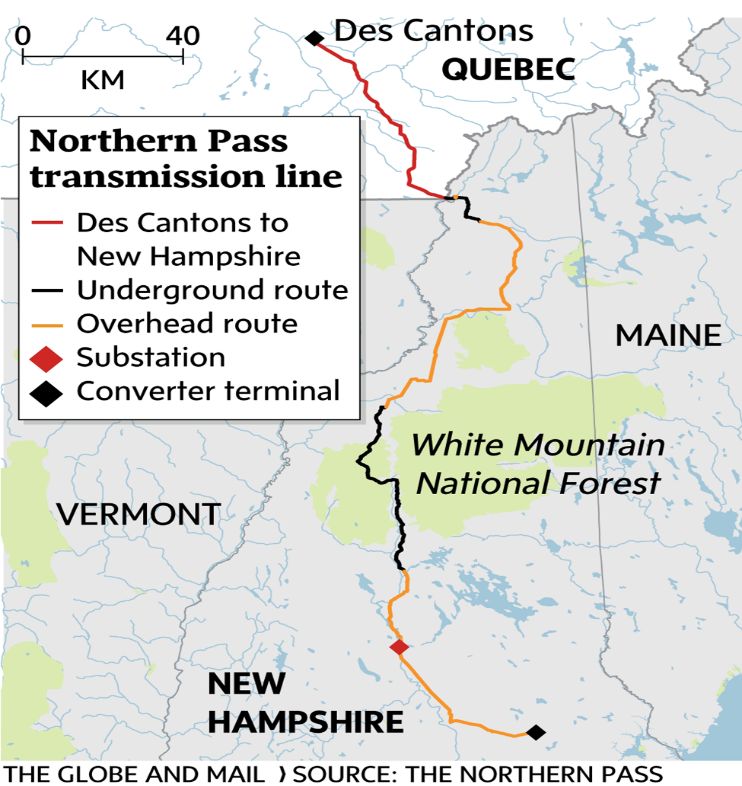
these will be the highest provincial rates in Canada.    Massachusetts utilities, and Northern Pass accepted.
                                                         New Hampshire rejected the Northern Pass route
Two Canadian transmission projects were under            through that state, and an appeal is underway.
consideration for the Massachusetts Clean Power RFP.
Both are underpinned by hydroelectricity generation.     The transition to low-carbon electricity generation,
The Atlantic Link proposed by Emera Energy was a 1,000   beyond hydroelectricity, saw some significant
MW 600 km undersea HVDC from New Brunswick to            advancements in Alberta.8 Round 1 of Alberta’s request
Massachusetts. The second project was proposed by        for proposals for renewable power resulted in
Hydro Quebec – the Northern Pass Transmission Project.   approximately 600 MW of wind power at a bid price of
This project is 1,090 MW and 79 km long.                 3.7 cents/kWh. This price is supported by an estimated
                                                         $10 million annual fee to the generators. In total, then,
                                                         the generation costs are an estimated 4.7 cents/kWh.
                                                         This low cost reflects the technology innovation seen in
                                                         wind generation over the last ten years plus the high-
                                                         value wind resource in southern Alberta. The results of
                                                         the auction are also in part due to the competitive
                                                         bidding process that was used instead of contracting or
                                                         feed-in-tariffs.

                                                         Alberta also took another step toward the low-carbon
                                                         transition with the launch of Energy Efficiency Alberta.
                                                         This initiative brings Alberta in as the last jurisdiction in
                                                         Canada and the US to have an economy-wide program
                                                         promoting energy efficiency. The plan is to develop
                                                         industrial, commercial, and residential programs funded
                                                         by revenues from the provincial carbon tax. The budget
                                                         for this agency is $648 million over five years.9 Programs
                                                         will focus on improving efficiency in the consumption of
                                                         electricity and natural gas.

                                                         Finally, the federal government made some changes to
                                                         its coal-fired electricity generation regulations.10
                                                         Originally, the regulations set a timeline for the
                                                         retirement of these plants between 45 to 50 years; the
                                                         typical life of a plant. The deadline has been amended to
                                                         2030 regardless of the age of the plant. However,
                                                         further amendments are being introduced allowing for
                                                         the coal-to-gas conversion of some plants. The intent is
                                                         to encourage the early replacement of coal for natural
                                                         gas before the 2030 target.

                                                         At the same time, the federal government introduced
                                                         new regulations for the generation of electricity using
                                                         natural gas. These regulations provide two limits for
                                                         carbon dioxide emissions. For plants larger than 150
                                                         MW, the limit is 420 tonnes of CO2/GWh. For those
                                                         smaller than 150 MW, the limit is 550 tonnes of CO2/
                                                         GWh reflecting the larger percentage of variable
                                                         operations typically seen by these plants.

 CERI Electricity Report
Page 3

Canada’s electricity supply system is approximately 84
percent zero emissions; much higher than most other
developed countries. With these hydroelectricity, wind
and coal changes in 2017, that percentage will increase.

Endnotes
1
  https://www.ontario.ca/page/ontarios-fair-hydro-plan
2
  https://www.theglobeandmail.com/news/british-columbia/
bc-to-proceed-with-site-c-hydroelectric-dam/article37290570/
3
  http://www.cbc.ca/news/canada/manitoba/manitoba-hydro-
rate-increase-pub-1.4430914
4
  http://www.cbc.ca/news/canada/manitoba/manitoba-hydro-
rates-increase-1.4101568
5
  https://www.ceri.ca/studies/latest
6
  http://www.ieso.ca/-/media/files/ieso/document-library/
sac/2017/sac-20170510-ontario-hydro-quebec-
agreement.pdf?la=en
7
  http://www.cbc.ca/news/canada/newfoundland-labrador/
stan-marshall-muskrat-falls-nupdate-1.4174569
8
  https://www.aeso.ca/market/renewable-electricity-program/
rep-round-1-results/
9
  http://calgaryherald.com/news/local-news/new-head-of-
energy-efficiency-alberta-promises-agency-will-have-real-
impact
10
   https://www.canada.ca/en/environment-climate-change/
news/2018/02/
technical_backgrounderproposedfederalregulationsforelectrici
tyse.html

                                                               Relevant • Independent • Objective
Page 4

Major Generation Projects in Canada
                                                    Province/                       Capacity                 Expected
Name                                                                                                                                             Status
                                                    Territory                       (MW)                     In-Service Date
Site C
                                                    British Columbia                1,100                    2024                                Construction began in July 2015 and is ongoing.
(Hydroelectric dam)
                                                                                                             The first generating station was
                                                                                                             commissioned in 2014 and the
Romaine Hydro Project
                                                                                                             second in 2016.                      Construction work on the Romaine-3 and Romaine-4
(Hydroelectric complex consisting of 4 individual Quebec                            1,550
                                                                                                             The third and fourth generating      developments is underway.
plants)
                                                                                                             stations will be operational in 2017
                                                                                                             and 2020 respectively
                                                                                                                                                  Construction on the Muskrat Falls Generating Facility started
                                                                                                             Muskrat Falls: 2018
Lower Churchill Project                                                             Muskrat Falls: 824                                            in 2013 and is currently ongoing. According to Manitoba
                                                    Newfoundland                                             Gull Island: 3 years after Muskrat
(Muskrat Falls and Gull Island hydroelectric)                                       Gull Island: 2,250                                            Hydro the project remains on track to meet the projected in-
                                                                                                             Falls
                                                                                                                                                  service date.
Keeyask Project
                                                    Manitoba                        695                      August of 2021                      Construction started in 2014 and is progressing.
(Hydroelectric power plant)
                                                                                                             6 Pickering units extended to
                                                                                    Bruce: 6,300             2022;                              Refurbishement of the Darlington station is underway.
Bruce, Darlington and Pickering
                                                    Ontario                         Darlington: 3,500        4 further extended to 2024         Planning has already begun to refurbish Darlington Unit 3.
(Nuclear Power Refurbishment)
                                                                                    Pickering: 3,100         Darlington refurbishment will take Bruce and Pickering commences in 2020 onwards.
                                                                                                             about 10 years to complete
Brazeau hydro expansion & adition of pumped
                                                                                                                                                 Currently under review
hydro storage                                       Alberta                         900                      2025

Major Transmission Projects in Canada
                                                       Province/                     Capacity                Expected
Name                                                                                                                                                  Status
                                                       Territory                     (kV)                    In-Service Date

Bipole III Transmission Reliability Project
                                                       Manitoba                      500                     2018                                     Project construction is almost complete
(HVDC line)

Manitoba – Minnesota Transmission Project
                                                       Manitoba                      500                     2020                                     Currently under regulatory review
(AC line)
Labrador - Island Transmission Link
                                                       Newfoundland and Labrador     450                     2020                                     Transmission towers installed
(HVDC line)

Maritime Link Transmission                             Newfoundland and Labrador,
                                                                                     200 to 250              2017                                     Construction began in 2014
(HVDC and HVAC line)                                   Nova Scotia

                                                                                                                                                      Construction activities in the summer of 2017. First tower
Fort McMurray West Transmission Project (AC line)      Alberta                       500                     2019                                     went into ground on Nov 9, 2017.
Chamouchouane–Bout-de-l’Île Transmission Line          Quebec                        735                     2018                                     Construction began in 2015
                                                                                     500 km lines- 315 and
Romaine Complex Transmission Line                      Quebec                        735 kV                  2020                                     Construction began in 2011

  CERI Electricity Report
Canadian Electricity Production 2017                                                                                Provincial Electricity Trade with the US
                                                                                   by Fuel Type                                                                                                            January-December 2017
                                        GWh
                                      70,000                                                                                                                                                                                                                                 29,000
                                                                                                                                                                                                                                                                             27,000
                                                                                                                                                                                                                                                                             25,000
                                      60,000
                                                                                                                                                                                                                                                                             23,000
                                                                                                                                                                                                                                                                             21,000
                                      50,000                                                                                                                                                                                                                                 19,000
                                                                                                                                                                                                                                                                             17,000
                                                                                                                                                                                                                                                                             15,000
                                      40,000                                                                                                                                                                                                                                 13,000
                                                                                                                                                                                                                                                                             11,000
                                      30,000                                                                                                                                                                                                                                 9,000
                                                                                                                                                                                                                                                                             7,000
                                                                                                                                                                                                                                                                             5,000
                                      20,000                                                                                                                                                                                                                                 3,000
                                                                                                                                                                                                                                                                             1,000

                                      10,000                                                                                                                                                                                                                                 -1,000
                                                                                                                                                               BC             AB                SK             MB            ON            QC       NB           NS   NL
                                                                                                                                                                                                                                                                             -3,000
                                                                                                                                                                                                                                                                             -5,000
                                           0                                                                                                                                                                                                                                 -7,000
                                                Jan-17 Feb-17 Mar-17 Apr-17 May-17 Jun-17 Jul-17 Aug-17 Sep-17 Oct-17 Nov-17 Dec-17                                                                                                                                          -9,000

                                                                                                                                                                                     Export volumes                  Import volumes                Net Exports             GWh
                                         Combustible Fuels    Nuclear      Hydro         Geothermal/Wind/Solar/Other       Previous Year Total 2016

                                     Source: IEA, CERI                                                                                                Source: NEB, CERI

                                                               Electricity price ($/kWh)                                                                                  Range of Wholesale Electricity Prices 2017
                                               Current Electricity    Retail Rates by Province
                                                                   (based on 1000kwh household monthly consumption)                                                                        for Selected Regional Trading Hubs
                                                                                                                                                                    > Trade Canada
                                       $/kWh
                                        0.45                                                                                                              Texas(ERCOT) > MB Hydro

                                        0.40
                                                                                                                                                                     Mid C > BC Hydro
                                        0.35

                                        0.30                                                                                                               New England > QC Hydro

                                        0.25
                                                                                                                                                      Northern California > BC Hydro
                                        0.20

                                        0.15                                                                                                               PJM > Ontario Power Gen

                                        0.10
                                                                                                                                                      Southern California > BC Hydro
                                        0.05
                                                                                                                                                                                           -5        10   25    40      55    70      85    100 115 130 145 160 175 190 205 220
                                        0.00
                                                 BC    AB    SK     MB      ON      QC      NB      NS      PE        NL   NT    YT      NU                                                                                                Price (US$/MWh)

                                     Source: BC Hydro, Fortis Alberta, SaskPower, Manitoba Hydro, HydroOne, Hydro Quebec,
                                     Energie NB Power, Nova Scotia Power, Maritime Electric, Newfoundland Power, Northwest
                                     Territories Power Corporation, Yukon Energy, Qulliq Energy Corporation, Nunavut Energy,

Relevant • Independent • Objective
                                                                                                                                                                                                                                                                                      Page 5

                                     CERI                                                                                                             Source: AESO, CERI
British Columbia Weekly Demand 2017                                                                              Alberta Weekly Demand 2017
                                                                                                                                                                                                                                              Page 6

                          MW                                                                                                       MW
                          11500                                                                                                    11500

                          10500                                                                                                    11000

                                                                                                                                   10500

CERI Electricity Report
                           9500

                           8500                                                                                                    10000

                           7500                                                                                                     9500

                           6500                                                                                                     9000

                           5500                                                                                                     8500
                               1-Jan   1-Feb 1-Mar   1-Apr 1-May   1-Jun   1-Jul   1-Aug   1-Sep   1-Oct   1-Nov   1-Dec   1-Jan        1-Jan   1-Feb 1-Mar   1-Apr 1-May    1-Jun    1-Jul   1-Aug   1-Sep   1-Oct   1-Nov   1-Dec   1-Jan

                                                             Weekly average         Weekly peak                                                                        Weekly average           Weekly peak

                          Source: BC Hydro, CERI                                                                                   Source: IESO, CERI

                                              Ontario Weekly Demand 2017                                                                         New Brunswick Weekly Demand 2017
                          MW                                                                                                       MW
                          23000                                                                                                    3200

                          22000                                                                                                    3000

                          21000                                                                                                    2800

                          20000                                                                                                    2600

                          19000                                                                                                    2400

                          18000                                                                                                    2200

                          17000                                                                                                    2000

                          16000                                                                                                    1800

                          15000                                                                                                    1600

                          14000                                                                                                    1400

                          13000                                                                                                    1200
                               1-Jan   1-Feb 1-Mar   1-Apr 1-May   1-Jun   1-Jul   1-Aug   1-Sep   1-Oct   1-Nov   1-Dec   1-Jan       1-Jan    1-Feb 1-Mar   1-Apr 1-May   1-Jun    1-Jul    1-Aug   1-Sep   1-Oct   1-Nov   1-Dec   1-Jan

                                                             Weekly average         Weekly peak                                                                        Weekly average           Weekly peak

                          Source: NBSO, CERI                                                                                       Source: ICE data, EIA, CERI
You can also read