Chapter 16: Water soluble carbohydrate content - plant stress
←
→
Page content transcription
If your browser does not render page correctly, please read the page content below
Chapter 16: Water soluble carbohydrate content
Julian Pietragalla and Alistair Pask

Water soluble carbohydrates (WSC) are sugars such            Site and environmental conditions
as fructans, sucrose, glucose and fructose which are         Samples can be taken under most environmental
accumulated in the stem as reserves. WSC accumulate          conditions. However, it is important that the plant
up to and around anthesis and are partitioned to the         surfaces are not wet from dew, irrigation or rain.
stem, from where they are later available as a reservoir
for remobilization to the developing grains. These           Time of day
reserves are an important source of carbon for grain-
                                                             Samples should be taken in the morning –as this
filling as grain demand frequently exceeds current
                                                             is coolest time of the day– to reduce carbohydrate
assimilation, potentially contributing 10-20% of the
                                                             losses from respiration, and allows time for same-day
grain yield under favorable conditions. In particular,
                                                             processing.
this trait has been shown to be adaptive for drought,
heat and/or disease stress tolerance when the supply of
                                                             Plant developmental stage
carbohydrates from photosynthesis during grain-filling
is inhibited/limited and stored WSC may contribute up        Measurements can be taken at any developmental
to 50% of the grain yield. For instance, under terminal      stage from the end of stem elongation, and/or at
drought stress (e.g., in Australian environments where       regular intervals from mid anthesis to physiological
deep soil water is not available), WSC have been shown       maturity, depending on the experimental objectives/
to buffer biomass production, grain yield and harvest         timing of peak stress:
index (HI), associated with increased water uptake           • For peak WSC: take samples at anthesis +7 (for
(WU) and water-use efficiency (WUE). Trait-based                 drought) to 14 days (for favorable conditions). Note
breeding for genotypes with greater stem storage and           that in severely stressed conditions the peak WSC
remobilization of WSC may result in improved grain-            may occur before anthesis.
filling and increased yields.
                                                             • For measurement of changes in WSC accumulation
Accumulation of WSC is a function of genetic                   and remobilization: take sequential samples from
characteristics –specifically the stem’s storage capacity-     anthesis to physiological maturity; every 7-14 days.
as well as environment which will influence the former
as well as the subsequent availability of assimilates for    Number of samples per plot
storage. The total amount of WSC may be 40% or more          Take one sample of 20 culms per plot.
of the total stem dry mass when WSC levels peak in
early grain filling (Kiniry, 1993; Reynolds et al., 2009).   Procedure
WSC storage may show trade-off with investment in             The following procedure describes the determination of
other sinks such as deeper root growth (Lopes and            WSC concentration from randomly selected fertile main
Reynolds, 2010), tiller survival or developing spikes. The   culms, alternatively culms can be selected from the in-
major proportion of WSC are located in the peduncle          season biomass samples taken at anthesis +7days (see
and penultimate internode, so taller lines with long         this volume, Chapter 15). See Schematic 16.1.
peduncles tend to have a larger capacity. WSC may be
                                                             Take the following equipment to the field:
expressed as a concentration in dry mass (either as a
percentage (%WSC) or as mg g-1) to demonstrate the           • Pre-labeled paper bags
potential stem storage capacity of the genotype; or as       • Secateurs/knife
the content per stem (g stem-1) or per unit area (g m-2)
to give an absolute measurement of the carbohydrates         Advice on taking measurements
available to the grain.                                      Collect the stem samples in paper bags which have
                                                             adequate ventilation to allow uniform drying (e.g., with
                                                             holes punched in the bag). It is important that samples
                                                             are kept cool and processed, and dried, as quickly as
                                                             possible to reduce respiratory losses of carbohydrates –
                                                             typically within 2 hours of cutting.

                                                                                                     Direct growth analysis   83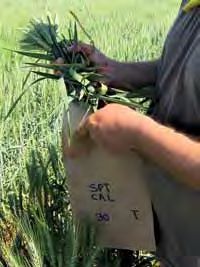
Sampling for WSC is often combined with in-season Laboratory measurements
biomass sampling and partitioning (see this volume, 4. Cut the spike from the stem at the spike collar.
Chapter 15). Ensure to plan sampling approach carefully
to allow for maximal data collection/economy of 5. Oven dry whole culm samples at 60-75°C until they
sampling (e.g., data on partitioning weights can be reach constant weight (i.e., for at least 48h).
collected on the same 20 culm sample). The leaf lamina 6. Remove the leaf lamina and leaf sheath from the
and/or leaf sheath may also be analyzed for WSC stems (Figure 16.1B).
separately, or not removed from the stem for ‘whole
stem’ analysis. 7. Weigh the dry stem sample (for calculation of WSC
content per stem or unit area) (DW_20stems).
Preparations 8. Grind the stem sample (e.g., using a mill with a
1. Prepare labeled paper bags for oven drying: use 0.5 mm screen). Ensure to clean the mill carefully
medium-sized bags with holes punch in them to between samples (Figure 16.1C).
increase oven drying efficiency (use a hole-punch, and
ensure you have a similar hole pattern in each bag). 9. Place ground sample into a labeled envelope.
Field measurements Analysis
2. Randomly select 20 fertile main culms from each Analysis of prepared samples is typically outsourced to a
plot, ensuring that all culms have a well formed specialist laboratory: (A) by the Anthrone method (cost
spike (Figure 16.1A). US$ 5.00 per sample), or (B) or scanned by near infrared
reflectance spectroscopy (NIRS) using a calibration curve
3. Place into a pre-labeled paper bag. (cost US$ 0.50 per sample). NIRS is an indirect method,
Or, randomly select a 20 culm sub-sample from the but has the advantage of also giving %N values when
in-season biomass sample (as detailed in this volume, using a %N calibration curve. (see Figure 16.2).
Chapter 15).
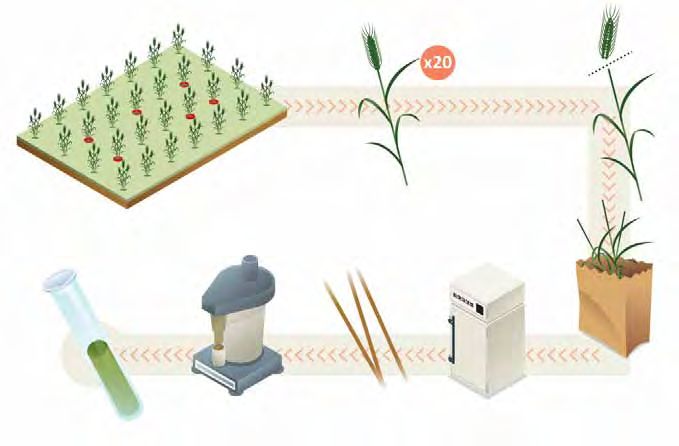
Cut spikes
Take grab-sample from culms
20 fertile
culms
Stem sample
in bag
Remove leaf lamina and
Analyse WSC content Grind stem sample leaf sheath from stems Dry to constant
weight
Schematic 16.1. Determination of WSC concentration of wheat stems.
84 Physiological Breeding II: A Field Guide to Wheat Phenotyping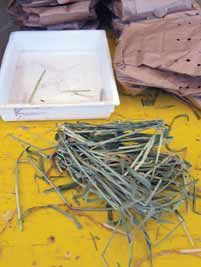
Anthrone method for WSC concentration                              equations developed and cross-validated using the
This is a quantitative colorimetric estimation for the             results of chemical analyses by the Anthrone method.
carbohydrate content of a solution. A green color is               Samples are scanned at 1585-1595 and 1900-2498 nm.
produced when carbohydrates are heated with anthrone               A different calibration curve is required for different
in acid solution (for details see Yemm and Willis, 1954).          developmental stages and environments. Note that
                                                                   when NIRS is used, it is recommended to replicate 5%
Near infrared reflectance spectroscopy using calibration           of samples analyzed by the Anthrone method to check
curves                                                             the calibration (see Figure 16.2).
Near infrared reflectance spectroscopy (NIRS) can be
used to estimate WSC concentration using predictive

(A)                                       (B)                                               (C)
Figure 16.1. Sampling for WSC content: (A) taking 20 stems in-field; (B) removing by hand the leaf lamina and leaf sheaves
from dry stems; and, (C) grinding dry stem sample using a cyclone mill.

Data and calculations                                                          35

Data is typically given as %WSC in dry matter. This can be                     30
used to calculate the WSC content per stem (g stem-1) or
per unit area (g m-2):                                                         25

WSC (g stem-1) = %WSC × ((DW_20stems) / 20)                                                                             y = 0.97x - 4.26
                                                                   %WSC NIRS

                                                                               20
                                        Equation 16.1                                                                   R2 = 0.76
                                                                               15
WSC (g m-2) = WSC (g stem-1) × stems m-2
                                                Equation 16.2                  10
In optimal conditions, peak WSC concentration ranges
                                                                                5
between 10-25%; WSC content per 2 g stem is 0.2-0.5
g stem-1; and, WSC content per m-2 at a stem density of                         0
300 m-2 is 60-100 g m-2.                                                            0   5         10      15       20       25       30    35
                                                                                                       % WSC standard
                                                                   Figure 16.2. Calibration curve to estimate WSC concentration
                                                                   (%) from near infrared reflectance spectroscopy values at
                                                                   anthesis (adapted from Pinto et al., 2006).

                                                                                                                        Direct growth analysis   85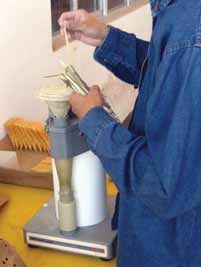
Troubleshooting
    Problem                                   Solution
    Large error variance in data.             Check that the mill is consistently grinding to 0.5 mm and sieve carefully to
                                              ensure good particle distribution within sample.
                                              When grinding samples, it is important that the mill is thoroughly cleaned
                                              between samples to avoid cross contamination.
                                              Ensure to re-dry samples before NIRS analysis to removed any reabsorbed
                                              moisture which may affect readings.

   References                                                           Useful references
   Kiniry, JR. (1993) Nonstructural carbohydrate utilisation by wheat   Blum, A. (1998) Improving wheat grain filling under stress by stem
        shaded during grain growth. Agronomy Journal 85, 844–849.            reserve mobilization. Euphytica 100, 77–83.
   Lopes, MS. and Reynolds, MP. (2010) Partitioning of assimilates to   Dreccer, MF., van Herwaarden, AF. and Chapman, SC. (2009) Grain
        deeper roots is associated with cooler canopies and increased        number and grain weight in wheat lines contrasting for stem
        yield under drought in wheat. Functional Plant Biology 37,           water soluble carbohydrate concentration. Field Crops Research
        147-156.                                                             112, 43–54.
   Pinto, S., González, H., Saint Pierre, C., Peña, J. and Reynolds,    Pollock, CJ. (1986) Fructans and the metabolism of sucrose in
        MP. (2006) Obtención de un modelo matemático para                    vascular plants. New Phytologist 104, 1–24.
        la estimación de carbohidratos solubles en paja de trigo        Rebetzke, GJ., Van Herwaarden, AF., Jenkins, C., Weiss, M., Lewis,
        (Triticum aestivum) mediante reflectancia espectral                  D., Ruuska, S., Tabe, L., Fettell, NA. and Richards, RA. (2008)
        cercana al infrarojo (NIRS 6500). VI Congreso Nacional de            Quantitative trait loci for water soluble carbohydrates and
        la Asociación Nacional de Biotecnología Agropecuaria y               associations with agronomic traits in wheat. Australian Journal
        Forestal (ANABAF A.C.), ITSON, Cd Obregón, Sonora, 22-25             of Agricultural Research 59, 891–905.
        Octubre 2006.
                                                                        Ruuska, S., Rebetzke, GJ., Van Herwaarden, AF., Richards, RA., Fettell,
   Reynolds, MP., Manes, Y., Izanloo, A. and Langridge, P. (2009)            N., Tabe, L. and Jenkins, C. (2006) Genotypic variation for water
        Phenotyping approaches for physiological breeding and gene           soluble carbohydrate accumulation in wheat. Functional Plant
        discovery in wheat. Annals of Applied Biology 155, 309–320.          Biology 33, 799–809.
   Yemm, EW. and Willis, AJ. (1954) The estimation of carbohydrates     Van Herwaarden, AF., Farquhar, GD., Angus, JF., Richards, RA. and
        in plant extracts by anthrone. The Biochemical Journal 57,           Howe, GN. (1998) ‘Haying-off ’, the negative grain yield response
        508–514.                                                             of dryland wheat to nitrogen fertilizer. I. Biomass, grain yield,
                                                                             and water use. Australian Journal of Agricultural Research 49,
                                                                             1067–1081.
                                                                        Xue, GP., McIntyre, CL., Jenkins, CLD., Glassop, D., Van Herwaarden,
                                                                             AF. and Shorter, R. (2008) Molecular dissection of variation in
                                                                             carbohydrate metabolism related to water-soluble carbohydrate
                                                                             accumulation in stems of wheat. Plant Physiology 146, 441–454.

86 Physiological Breeding II: A Field Guide to Wheat Phenotyping
You can also read