Condensation: Dew, Fog, & Clouds
←
→
Page content transcription
If your browser does not render page correctly, please read the page content below
Condensation: Dew, Fog, &
        Clouds
         Chapter 5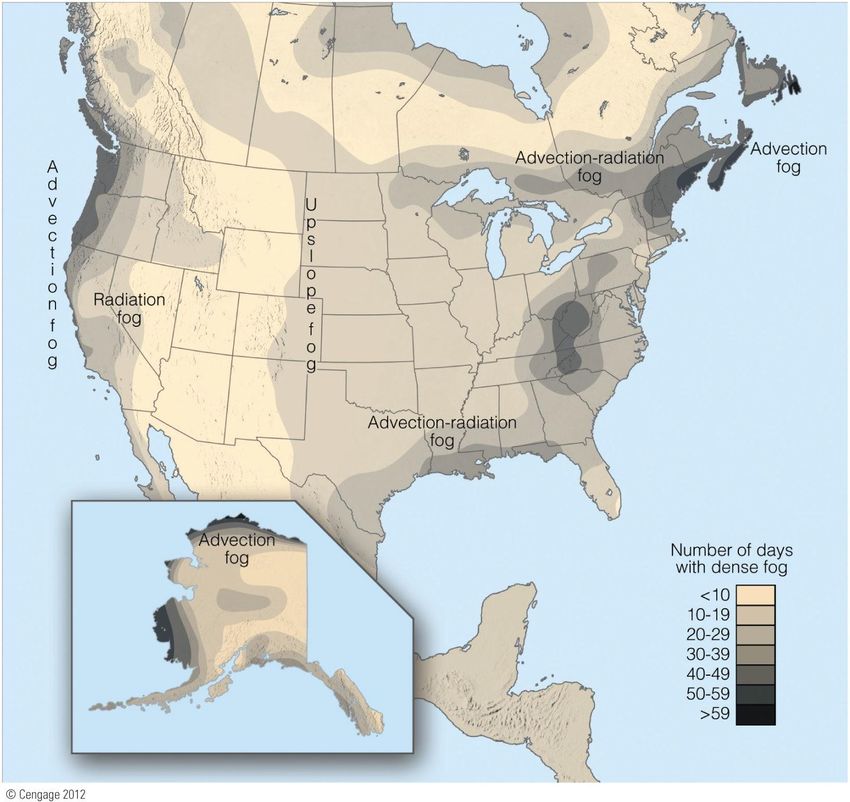
Condensation
Water vapor in the air changes to a liquid and
forms dew, fog, or clouds
Water vapor requires a surface to condense
on
Possible condensation surfaces on the
ground can be the grass, a car window, etc.
Possible condensation surfaces in the air
are tiny bits of particulate matter
Called condensation nuclei (i.e. dust,
smoke, Ocean salt crystals, etc.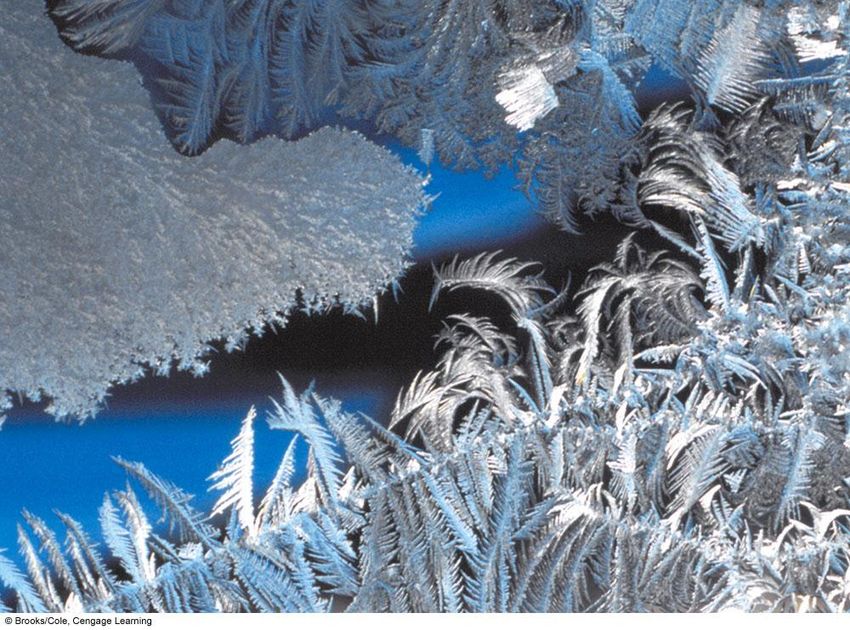
The Formation of Dew & Frost
• Dew forms on objects near the ground surface
  when they cool below the dew point
  temperature and water vapor condenses on
  them
  – More likely on clear nights due to increased
    radiative cooling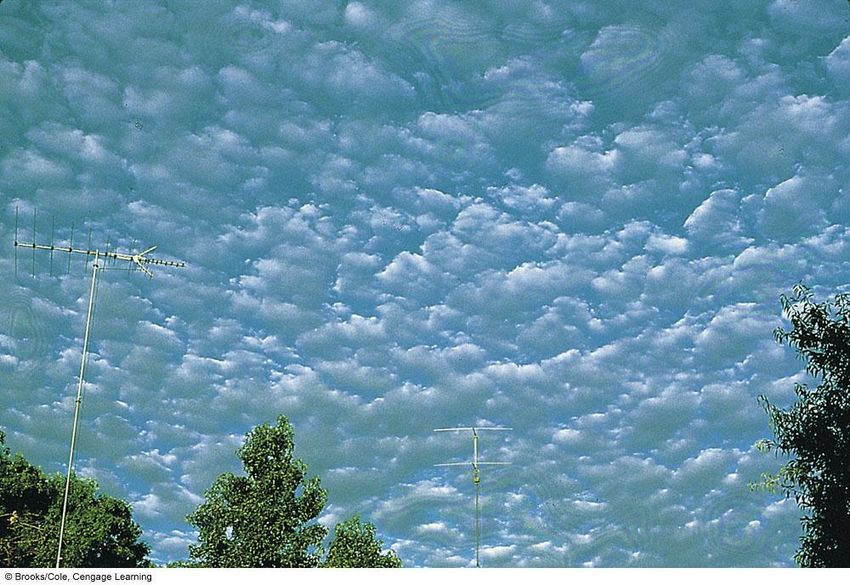
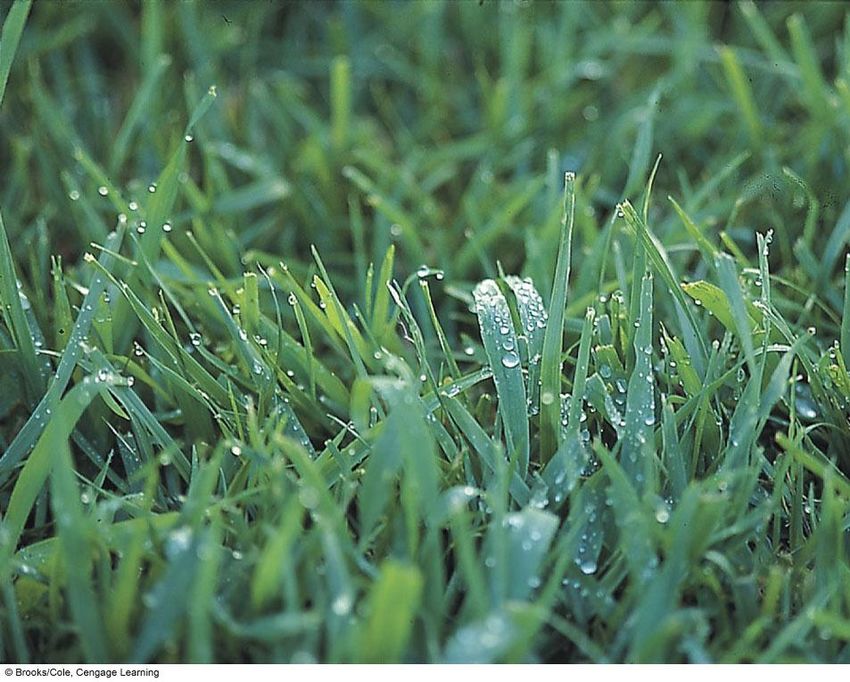
Dew forms on clear nights when objects on the surface cool to a temperature below
the dew point. If these beads of water should freeze, they would become frozen dew.
Frost forms when temperature cools below
the dew point and the dew point is below
0°C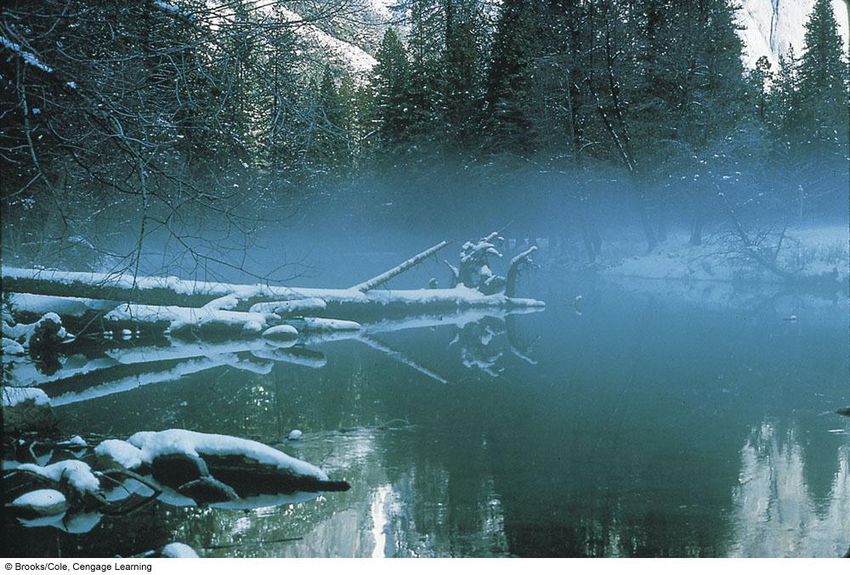
These are the delicate ice-crystal patterns that frost exhibits on a window during a cold
winter morning.
Condensation Nuclei
• Particles suspended in the air that, around which,
  water condenses or freezes.
Hygroscopic nuclei are “water-seeking,” and water vapor rapidly
condenses on their surfaces.
Hydrophobic nuclei are “water-repelling” and resist condensation.
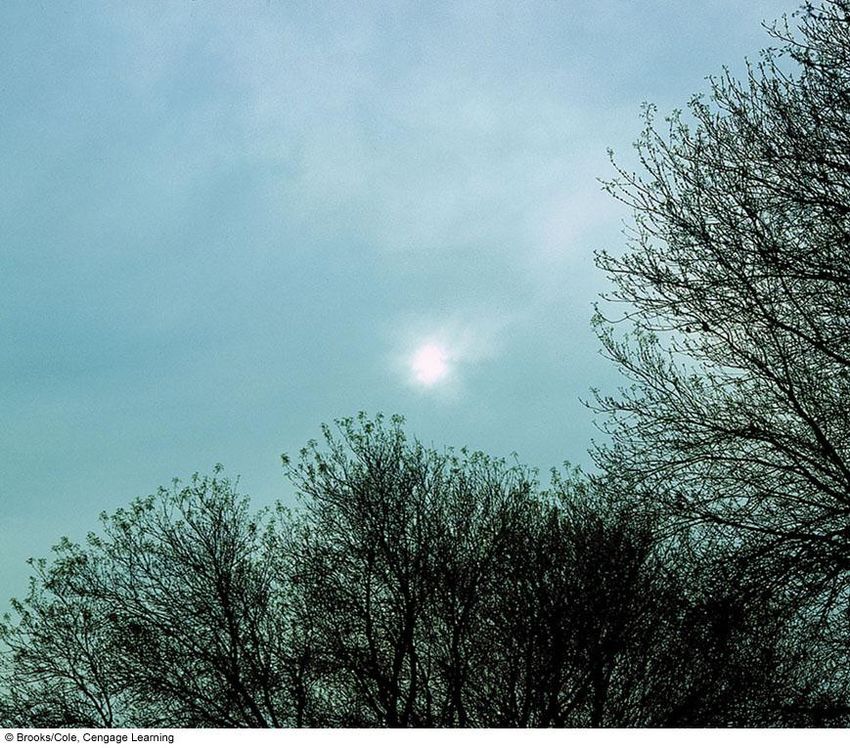
Haze
• Dry condensation nuclei (above dew point) reflect
  and scatter sunlight creating blueish haze.
• Wet condensation nuclei (75% relative humidity)
  reflect and scatter sunlight creating grayish or
  white haze.

Fog
• Saturation reached condensation forms a cloud
  near the ground
• Radiation fog: ground cools through conduction and
  radiation; ground fog
  – Valley fog created by cold air drainage
  – High inversion fog
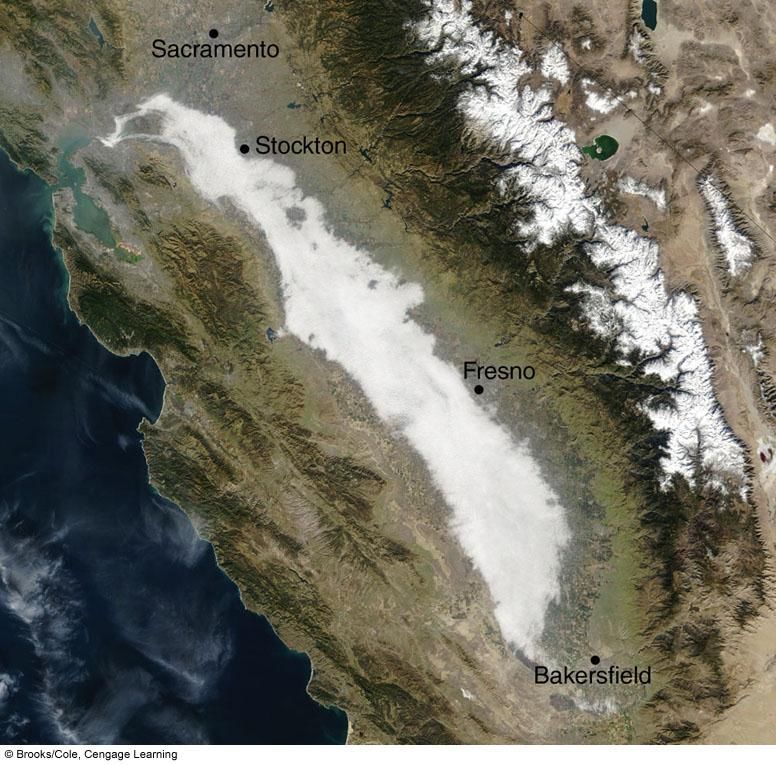
Visible satellite image of dense
radiation fog in the southern
half of California’s Central
Valley on the morning of
November 20, 2002.

The white region to the east
(right) of the fog is the
snowcapped Sierra Nevada
range. During the late fall and
winter, the fog, nestled
between two mountain ranges,
can last for many days without
dissipating.

The fog on this day was
responsible for several auto
accidents, including a 14-car
pileup near Fresno.
• Advection Fog: warm moist fog moves
 horizontally (advects) over a cool surface.
  – Summer fog on the Pacific coast
Observation: Headlands
   Air converges and rises over headlands forming fog as compared to lower
   elevation beaches.
(a) Radiation fog tends to form on clear, relatively calm nights when cool, moist surface
    air is overlain by drier air and rapid radiational cooling occurs.
(b) Advection fog forms when the wind moves moist air over a cold surface and the
moist air cools to its dew point.
• Upslope Fog: moist air flows up an orographic barrier – East side of the Rockies
Evaporation (mixing) Fog:
Warm moist surface provides enough moisture to
saturate a dry air parcel; short lived
○ Steam fog
○ Breath in winterThe mixing of two unsaturated air parcels can produce fog. Notice in the saturated mixed parcel that the actual mixing ratio (w) is too high. As the mixed parcel cools below its saturation point, water vapor will condense onto nuclei, producing liquid droplets. This would keep the actual mixing ratio close to the saturation mixing ratio, and the relative humidity of the mixed parcel would remain close to 100 percent.
The blue line is the saturation mixing ratio. The mixing of two unsaturated air parcels
(A and B) can produce a saturated air parcel and fog.
Foggy Weather
• In general foggy conditions are not common
  for most locations in the US. However several
  areas do exist with a high frequency of fog.
  Two causes:
  – Elevation
  – Ocean currents
Average annual number of days with dense fog (visibility less than 0.25 miles) through
the United States. (NOAA)
• Fog dispersal
  – Mix air with air craft or fans
  – Introduce large particle into air to reduce
    total number of cloud droplets.
  – Use dry ice to lower temperature below
    freezing.
Clouds • Classification of clouds – use Latin words to describe height and appearance. • Factors described – Height: low, mid, high, vertical – Appearance: shape, density, color
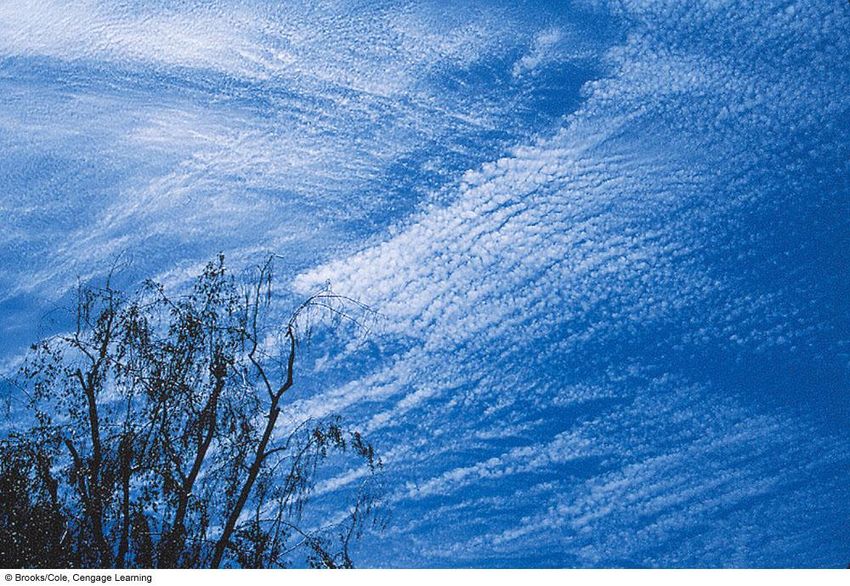
Cirrus clouds.
Cirrocumulus clouds.
Cirrostratus clouds with a faint halo encircling the sun. The sun is the bright
white area in the center of the circle.
Altocumulus clouds.
Altostratus clouds. The appearance of a dimly visible “watery sun” through a deck of
gray clouds is usually a good indication that the clouds are altostratus.
The nimbostratus is the sheetlike cloud from which light rain is falling. The ragged-
appearing clouds beneath the nimbostratus is stratus fractus, or scud.
Stratocumulus clouds forming along the south coast of Florida. Notice that the rounded
masses are larger than those of the altocumulus.
A layer of low-lying stratus clouds hides these mountains in Iceland.
Cumulus clouds.
Small cumulus clouds such as these are sometimes called fair weather cumulus, or
cumulus humilis.
Cumulus congestus. This line of cumulus congestus clouds is building along
Maryland’s eastern shore.
A cumulonimbus cloud (thunderstorm). Strong upper-level winds blowing from right to
left produce a well-defined anvil. Sunlight scattered by falling ice crystals produces the
white (bright) area beneath the anvil. Notice the heavy rain shower falling from the base of
the cloud.
Some Unusual Clouds
• Not all clouds can be placed into the ten basic
  cloud forms.
• Unique atmospheric processes and
  environmental conditions create dramatic and
  exotic clouds.
• Unusual clouds and weather balloons often
  cause of UFO reports.
Lenticular clouds forming on the leeward side of the Sierra Nevada near Verdi, Nevada.
The cloud forming over and downwind of Mt. Rainier is called a banner cloud
A pileus cloud forming above a developing cumulus cloud.
Mammatus clouds forming beneath a thunderstorm.
A contrail forming behind a jet aircraft.
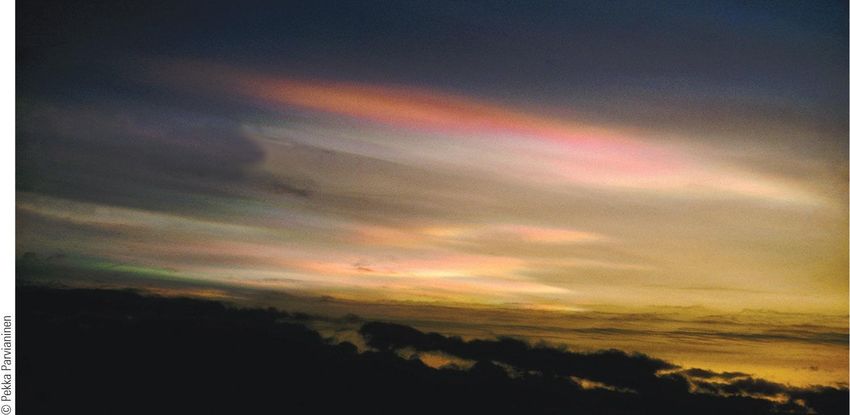
The clouds in this photograph are nacreous clouds. They form in the stratosphere
and are most easily seen at high latitudes.
The wavy clouds in this photograph are noctilucent clouds. They are usually
observed at high latitudes, at altitudes between 75 and 90 km above the earth’s
surface.
Cloud Observations
• Sky conditions: cloud coverage divided into
  eighths and each amount associated with
  term such as scattered clouds.
• Observations: cloud ceilings
  – Ceilometer used at airports to determine height
    from clouds by light or laser striking clouds and
    then amount and speed of reflected light
    recorded.
The laser-beam ceilometer sends pulses of infrared radiation up to the cloud. Part of this beam is reflected back to the ceilometer. The interval of time between pulse transmission and return is a measure of cloud height, as displayed on the indicator screen.
Cloud Observations
• Satellite Observations
  – Geostationary satellites
  – Polar orbiting satellites
  – Visible light provides a black and white picture of
    clouds
  – Infrared approximates cloud temperature which
    infers height
  – Satellites measure many other variables: sea
    surface temperatures, ozone, upper level features,
    snow cover, land cover
The geostationary satellite moves through space at the same rate that the earth rotates, so it remains above a fixed spot on the equator and monitors one area constantly from 22,300 mi above
Polar-orbiting satellites scan from north to south, and on each successive orbit the
satellite scans an area farther to the west – about 850 km (510 mi)
Generally, the
lower the cloud,
the warmer its top.
Warm objects emit
more infrared
energy than do
cold objects.
 Thus, an infrared
satellite picture can
distinguish warm,
low (gray) clouds
from cold, high
(white) clouds.
Sea-surface temperatures for February 19, 2004. Temperatures are derived mainly
from satellites, but temperature information also comes from buoys and ships.
Infrared water-vapor image. The darker areas represent dry air aloft; the brighter the
gray, the more moist the air in the middle or upper troposphere. Bright white areas
represent dense cirrus clouds or the tops of thunderstorms. The area in color
represents the coldest cloud tops.
A three-dimensional TRMM satellite image of Hurricane Ophelia along the North
Carolina coast on September 14, 2005. The light green areas in the cut-away view
represent the region of lightest rainfall, whereas dark red and orange indicate regions of
heavy rainfall.
You can also read


