Chelsea Eats Study Card Spending Update - May 2021 - Jeffrey Liebman Kathryn Carlson Eliza Novick Pamela Portocarrero* - Harvard ...
←
→
Page content transcription
If your browser does not render page correctly, please read the page content below
May 2021

Chelsea Eats Study
Card Spending Update

Jeffrey Liebman
Kathryn Carlson
Eliza Novick
Pamela Portocarrero*

Background on the Chelsea Eats Program1
Chelsea, Massachusetts, a city of 40,000 people just north of Boston, is among the places in
the country hardest hit by Covid-19, both from a health and an economic perspective. Its heavily
Latino population is concentrated in sectors of the economy that were shut down when the
pandemic hit, and Chelsea residents are also disproportionately likely to be front-line service
workers exposed to infection risk. In April 2020, local community organizations and the City of
Chelsea responded to the economic crisis facing jobless Chelsea residents by mounting an
unprecedented food distribution effort.
In September 2020, after five months of running its food distribution sites, the City decided to
redirect its efforts toward distributing financial support so that residents could purchase their
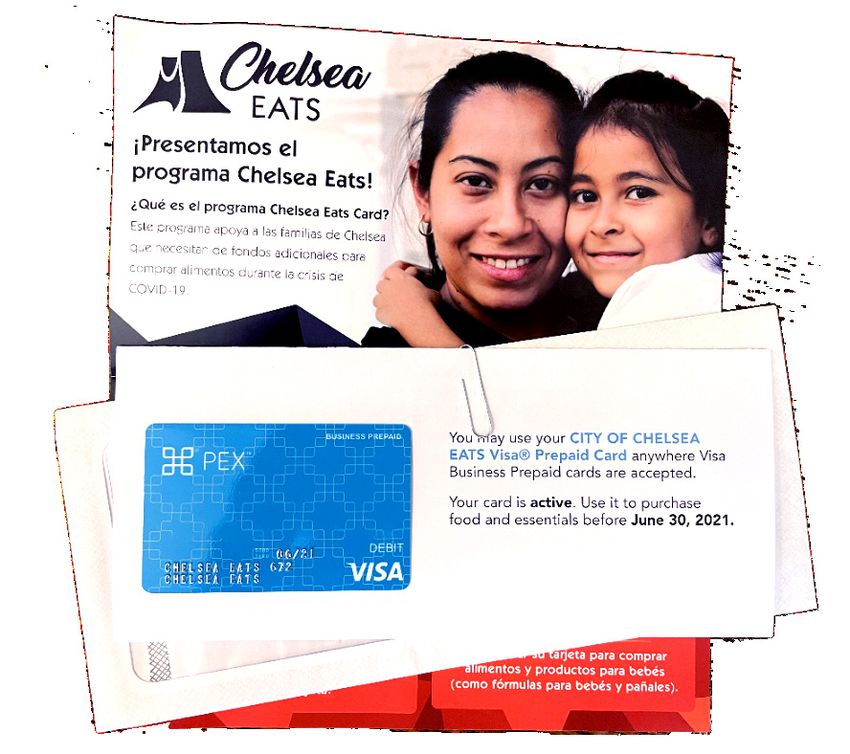
own food through a program called Chelsea Eats. By combining city general revenue funds,
state aid, and philanthropic contributions, the City assembled enough resources to distribute
Chelsea Eats cash cards to approximately 2,000 households and to replenish the cards on a
monthly basis for a total of six months. The card amounts vary with household size. Most
households are receiving $400 per month, but one- and two-person households receive $200
and $300, respectively. The cards can be spent anywhere Visa is accepted. In total, 3,615
households applied for the cards, and 2,074 were chosen to receive the cash assistance cards
via a lottery. Gift cards were credited with the first payment on November 18th, 2020 and with
the second payment on December 18th, 2020. The program is currently expected to continue
with monthly credits through at least April 2021. Our research team is conducting an evaluation
of the program by comparing outcomes of lottery winners with those of applicants who were
unsuccessful in the lottery.
Data on Card Spending
This report describes the stores and vendors where program participants have spent their
Chelsea Eats funds. We have analyzed anonymized data on card spending for purchases that
occurred between November 24, 2020 and March 2, 2021 on 2,001 Chelsea Eats cards, a total
of 47,624 transactions amounting to $2,079,698.2 The data contain the purchase date, the
* Contact: Jeffrey_Liebman@harvard.edu. Liebman is the Malcolm Wiener Professor of Public Policy at Harvard Kennedy School
and the director of the Rappaport Institute for Greater Boston. Carlson is the Executive Director of the Rappaport Institute for
Greater Boston. Novick is Project Manager at the Shah Family Foundation. Portocarrero is Executive Coordinator at the Harvard
Kennedy School Government Performance Lab. The Rappaport Institute is grateful for support from the Shah Family Foundation for
this research.
1
A more detailed description of the program can be found in The Chelsea Eats Study: Findings from the Baseline Surveys.
2
There are a variety of reasons why the total number of cards in our data set is less than the number of lottery winners. Some
households entered and won the lottery more than once. Those households received only a single card and were limited to a single
1purchase amount, a “description” that contains the name of the store or vendor from whom the
purchase was made as well as the city or town in which the store or vendor is located, and a
“category” that is a Visa-provided categorization of the vendor.3 Our analysis consists of two,
relatively simple, steps:
• First, we aggregated the data to the vendor level. Because different locations for a single
chain (e.g., different Dunkin locations) typically have slightly different entries in the
“description” field, this involved a detailed review of the data to make sure we
successfully included all instances of the same chain or vendor. There are a variety of
other circumstances, such as a single restaurant using multiple payment platforms,
where we similarly needed to standardize the “description.”
• Second, we modified the Visa-provided categorization to better meet our needs. For
example, in order to focus on places where food is typically purchased, we present
wholesale clubs such as BJ’s and Costco as a separate category rather than as a
component of retail. We also cleaned the data when appropriate. For example, while
most Apple stores were categorized under retail, one location was categorized in the
original data as a restaurant – so we switched it to retail. There are limits to how well we
can review and recategorize. Given the large number of total transactions in the data, we
mostly limited our vendor research to those with the largest dollars of transactions.
It is important to emphasize that our data reveal where purchases occurred, but not what was
purchased. For example, approximately 60 percent of purchases in our sample occur at
grocery stores or wholesale clubs. While it is likely that most of these purchases are food, it is,
of course, possible to buy many other things at these locations, such as cleaning supplies. A
similar issue occurs with “markets & convenience stores.” While it is likely that most purchases
in that category are food, particularly because the largest share of these dollars were spent at
meat and produce markets, it is clearly possible to buy a wide range of products at a Super 99
or a 7-Eleven.
Two types of stores are particularly hard to categorize. The first is stores like Walmart or Target
that sell large amounts of both food and non-food products. We mostly followed the original Visa
monthly payment. Some were determined to be ineligible because they did not live in Chelsea. Some lottery winners did not claim
their card, though most unclaimed cards were ultimately reallocated to households on a wait list that was created at the time of the
original lottery. A few households appear to be saving their cards for future emergencies and have not yet done any spending.
3
The Visa categories that appear in our data are: association, automotive dealers, educational service, entertainment, fuel pumps,
gas stations & convenience stores, grocery stores, hardware stores, health care & childcare services, professional services,
restaurants, retail stores, and travel & transportation.
2classifications for these stores, putting them under “retail.” But there were some Walmart
locations that Visa classified as grocery stores, and we maintained that categorization for those
locations. The second type of stores that are difficult to categorize are those that Visa describes
as “Gas Stations & Convenience Stores.” We put all of the gas stations that Visa classified as
“Gas Stations & Convenience Stores” under “Transportation” even though some of the
purchases at those locations might be for food items or household goods and more
appropriately included in the “Markets and Convenience Stores” category.4
Categorizing purchases by city or town was relatively straightforward. To total the spending that
occurred in each location, we standardized spelling and capitalization of place names and
recoded Boston neighborhoods such as East Boston and Dorchester as “Boston.”
Results
Table 1 shows the distribution of spending by store or vendor type. 73.3 percent of spending
($1.5 million of the $2.1 million in total spending) occurred at places where food is the primary
product: grocery stores, wholesale clubs, markets & convenience stores, and restaurants.
Indeed, 32 percent of total spending was at Market Basket grocery stores, overwhelmingly at
the Chelsea location.
Large amounts were also spent at Compare Market, at BJ’s and Costco, and at the La
Economica and Vincentinos meat markets. The largest amount of restaurant spending occurred
at Dunkin, McDonald’s, and Burger King, though large amounts were also spent at local
Chelsea locations such as Broadway House of Pizza, Delicias Salvadorenas, and Taqueria El
Charrito.
Another 20.9 percent of spending occurred at retail stores including big box stores like Walmart
and Target, clothing stores like Burlington Stores and TJ Maxx, and dollar stores like Family
Dollar, Dollar General, and Dollar Tree. There were also significant online purchases from
Amazon.
4.1 percent of spending occurred at vendors we categorize as “utilities and professional
services.” Most of these dollars were spent on utilities like Comcast, Eversource, and National
Grid, or at wireless providers such as T-Mobile, MetroPCS, and AT&T. Given that our baseline
survey found that a significant minority of households in this sample are behind on utility
4
There is a separate Visa category of “Fuel Pumps” that accounts for half of the gas station spending in our sample. We categorize
“Fuel Pumps” as transportation related as well.
3payments or had had their phone service disconnected because of unpaid bills, it is not
surprising that some of the Chelsea Card money is spent on these services. We see smaller
amounts spent on financial services such as insurance, and on beauty, laundry, and health care
services. Even though our surveys have shown that many Chelsea Eats families are struggling
to pay rent, less than $2,000 of the $2.1 million in expenditures are clearly identifiable as rent
payments. Presumably few landlords accept Visa, so, despite the need, families are unable to
use their cards to pay rent.
Transportation accounts for 1.3 percent of spending. Most of this is at fuel pumps and gas
stations, though there is also spending on Lyft and Uber and on MBTA bus and subway passes.
Finally, less than half a percent of spending (0.4%)–$8,000 out of the $2.1 million–is at liquor
stores or smoke shops. Of course, it is possible to buy alcohol and cigarettes at grocery stores
and convenience stores too, so total spending on these products could be somewhat larger.
Table 2 describes spending by city or town. More than half of card spending, $1.2 million,
occurred at retail outlets in Chelsea. 70 percent of the Chelsea spending occurred at two
supermarkets – Market Basket and Compare Market --, with the remainder spread across a
wide range of specialty food markets, restaurants, convenience stores, and other retail outlets.
25 percent of overall spending occurred in the nearby communities of Revere, Everett, Lynn,
Saugus, and Medford, where the closest wholesale clubs and big box stores are located. The
four percent of spending that occurred in Boston was less concentrated and spread over a wider
range of store types, including clothing stores, restaurants, and grocery stores.
Conclusion
Given that Chelsea Eats applicants were recruited largely from food pantry users, it is not
surprising that nearly three-quarters of card spending is at outlets that primarily sell food. It is
also possible that the branding of the initiative as the “Chelsea Food Debit Card Program”
encourages participants to use the cards at groceries and other purveyors of food. In our
Chelsea Eats research surveys, we are collecting data on food consumption and expenditures
and will be assessing the extent to which the program leads to greater food adequacy and
reductions in food insecurity.
4Table 1
Chelsea Eats Card Spending by Category & Vendor
GROCERY STORES $ 1,036,874 49.9%
Market Basket $ 666,724
Compare Market $ 189,366
Stop & Shop $ 39,789
Walmart $ 37,102
WHOLESALE CLUBS $ 240,436 11.6%
BJ's $ 191,616
Costco $ 48,820
MARKETS & CONVENIENCE STORES $ 105,088 5.1%
La Economica Meat $ 23,339
Vincentinos Meat Market $ 10,982
Vincentinos Produce $ 9,443
Super 99 $ 4,444
7-Eleven $ 4,027
Essex Market $ 2,945
La Consolarena Market $ 2,819
Vega Market $ 2,720
Bellingham Fruit & Produce $ 2,182
Market del Sol $ 2,020
Moonlight Market $ 1,830
RESTAURANTS & RESTAURANT DELIVERY $ 143,004 6.9%
Dunkin $ 13,571
McDonald's $ 11,103
UBER Eats $ 7,814
Burger King $ 7,211
Broadway House of Pizza $ 4,505
Delicias Salvadorenas $ 4,274
Taqueria El Charrito $ 4,022
Pollo Campero $ 2,628
Domino's $ 2,615
Santaneco $ 2,389
Great Chef Chinese $ 2,331
Rincon Hondureno $ 2,293
Doordash $ 2,188
Grubhub $ 2,156
Source: Authors’ calculations from the 47,624 transactions with purchase dates between November 24, 2020 and
March 2, 2021 on 2,001 Chelsea Eats cards. The table shows the total for each category as well as the largest
purchase locations or purchase types within each category. Because it does not show all purchase locations, the
sum of the individual items is less than the total shown for the category.
5Table 1 cont'd
Chelsea Eats Card Spending by Category & Vendor
RETAIL $ 434,238 20.9%
Walmart $ 65,082
Target $ 34,778
Burlington Stores $ 27,894
Amazon $ 26,395
Family Dollar $ 26,350
CVS $ 25,913
TJ Maxx $ 22,329
Dollar General $ 14,984
Walgreens $ 12,624
Marshalls $ 9,668
Home Depot $ 8,720
Dollar Tree $ 8,707
Macy's $ 8,109
BD'S Discount Furniture $ 7,578
Primark $ 6,376
Apple Store $ 4,141
Homegoods $ 4,090
PROFESSIONAL SERVICES $ 85,006 4.1%
Utilities (Comcast, Eversource, National Grid, etc.) $ 32,163
Wireless (T-Mobile, Metropcs, AT&T, etc.) $ 24,350
Other (incl: insurance, Rent A Center, finance, legal services, etc.) $ 10,638
Beauty (hair, nails, spas, etc.) $ 3,988
Organizations (parking, parking tickets, RMV, USPS, etc.) $ 3,383
Laundry $ 3,130
Health Care (dentists, urgent care, etc.) $ 2,379
Rent $ 1,947
Entertainment (Gamestop, Planet Fitness, etc.) $ 1,531
Education (tuition) $ 1,182
Car Wash $ 315
TRAVEL & TRANSPORTATION $ 26,763 1.3%
Fuel pumps $ 9,704
Gas station/convenience stores $ 9,649
Rideshare (Lyft, Uber, etc.) $ 2,378
MBTA $ 1,431
E-Z Pass $ 983
Airfare $ 921
Auto dealers $ 464
ALCOHOL AND SMOKING $ 8,289 0.4%
Liquor stores $ 7,795
Smoke shops $ 494
TOTAL $ 2,079,698 100.0%
6Table 2
Chelsea Eats Card Spending by City or Town
CHELSEA $ 1,160,441 55.8%
Market Basket $ 623,143
Compare Market $ 189,366
Family Dollar $ 24,081
La Economica Meat $ 23,339
CVS $ 21,714
TJ Maxx $ 16,865
Mi Salvador Mexicano $ 14,026
REVERE $ 260,715 12.5%
BJ's Wholesale Club $ 149,952
Market Basket $ 26,112
Burlington Stores $ 22,636
Target $ 12,137
EVERETT $ 119,047 5.7%
Costco Wholesale $ 46,825
Stop & Shop $ 28,730
Target $ 13,637
BOSTON $ 75,575 3.6%
Shaw's $ 5,925
Primark $ 5,294
Marshalls $ 4,589
Pollo Campero $ 2,463
Macy's $ 2,213
Great Chef Restaurant $ 1,842
El Valle de la Sultana Market $ 1,812
Pueblo Viejo Pupuseria & Mexican Grill $ 1,347
LYNN $ 69,225 3.3%
Walmart $ 50,951
SAUGUS $ 60,647 2.9%
Walmart $ 29,804
MEDFORD $ 43,349 2.1%
BJ's Wholesale Club $ 35,670
SOMERVILLE $ 15,784 0.8%
Burlington Stores $ 3,289
Trader Joe's $ 1,768
MALDEN $ 12,481 0.6%
Hong Kong Supermarket $ 5,234
99 Asian Supermarket $ 3,469
OTHER TOWNS & ONLINE $ 262,443 12.6%
TOTAL $ 2,079,707 100.0%
Source: Authors’ calculations from the 47,624 transactions with purchase dates between November 24, 2020
and March 2, 2021 on 2,001 Chelsea Eats cards. The table shows the total spent in each city or town as well as
the largest purchase locations in each city/town.
7You can also read