Clinton Correctional Facility: 2012-2014
←
→
Page content transcription
If your browser does not render page correctly, please read the page content below
Clinton Correctional Facility: 2012-2014
1
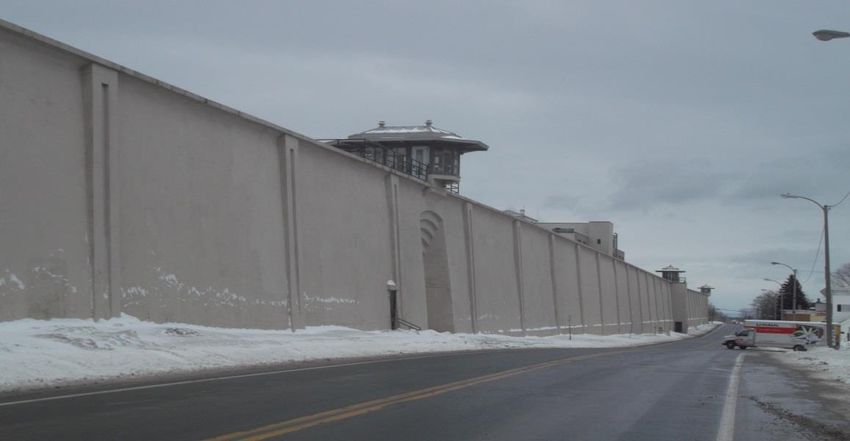
Clinton Correctional Facility is a maximum security prison that has a Main compound
and an Annex,2 and is located in Dannemora, NY, in the northernmost part of the state.
Established in 1845 and sometimes referred to as “Little Siberia” because of the harsh weather
conditions and intimidating environment, Clinton is the third oldest Department of Corrections
and Community Supervision (DOCCS) prison in New York State. Clinton has a massive
foreboding stone and cement wall on its perimeter, immediately adjacent to the Main Street of
Dannemora. Like many other maximum security prisons in the state, the Main is lined with long
corridors of stacked tiers of cells, while the Annex has dorm-style housing. Throughout its long
history, parts of Clinton had at various stages operated as a “mining prison” where incarcerated
persons were forced to work in the mining and manufacturing of iron, a site for the death penalty
by electrocution, a tuberculosis ward, a state mental hospital for people declared insane after
conviction, a mental health treatment center, one of the largest employers in the area, and always
a prison for incarcerating people convicted of the most serious crimes.3 Clinton has also had an
1
This image is available at: http://farm9.staticflickr.com/8239/8492760378_1a558ebeb4_o.jpg.
2
Clinton Main is classified as a maximum security facility and the Annex is a lower security compound classified as
a Maximum 2 facility.
3
See Clinton Correctional Facility, DOCS Today, available at:
http://www.correctionhistory.org/html/chronicl/docs2day/clinton.html; Julian Kimble, “The 50 Craziest Prisons and
Jails in the World,” Sept. 12, 2012, available at: http://www.complex.com/city-guide/2012/09/the-50-craziest-
prisons-and-jails-in-the-world/clinton-correctional-facility; Anna Jolly, “Prison wall getting face-lift: Dannemora
barrier a witness to history,” Nov. 14, 2004, available at:
http://blog.pressrepublican.com/archive/index.php?option=com_content&view=article&id=26274; Ron Roizen, “A
Brief History of Clinton Prison,” 1972, available at:
1
infamous history of violence, brutality, and abuse by correction officers, as well as unrest,
violence, organizing, and lawsuits by people incarcerated at the facility. Incidents within this
history have ranged from what has been classified as one of the largest prison rebellions in New
York State history in 1929, to a series of successful brutality lawsuits in the 1990s, to more
recent alleged staff assaults, incarcerated person fights, and facility-wide lockdowns.4 In the mid-
1990s, for example, the New York Times went so far as to report that Federal judges “have
repeatedly found that excessive force by guards has violated [incarcerated persons’] civil rights,”
that corrections experts found the settling of 10 brutality lawsuits at Clinton to be “extraordinary,
since [incarcerated persons] rarely win such cases and officials rarely settle them,” that Clinton
had an “internal culture that tolerates a higher level of violence than others, and where guards are
more likely to test the boundaries of what is considered acceptable force,” and that vast racial
and cultural disparities between incarcerated persons and staff exacerbated conflicts.5

        Today, Clinton is the largest DOCCS prison in the state, with a total capacity of 2,956
people in the Main and Annex combined. As discussed in detail below, the facility continues to
be plagued by violence and staff brutality at a level that is among the worst of DOCCS prisons.
In addition to its general confinement in the Main and Annex, at the time of our visit Clinton
operated two unique residential programs separated from the rest of the facility, Merle Cooper
and the Assessment and Program Preparation Unit (APPU), as well as a residential Intermediate
Care Program (ICP) for people with serious mental health needs, and a Special Housing Unit
(SHU) and additional SHU and long-term keeplock isolated confinement cell blocks.

METHODOLOGY

        The Visiting Committee of the Prison Visiting Project (PVP) of the Correctional
Association of New York (CA) visited Clinton on July 10 and 11, 2012. The purpose of our visit
was to assess programs, physical facilities, and conditions for incarcerated persons and staff
within the prison. In order to accurately assess the services and conditions at Clinton, the CA

http://www.correctionhistory.org/northcountry/dannemora/historyindex.html; Sara Rimer, “2 Worlds Coexist,
Warily, in a Prison Town,” The New York Times, March 14, 1988, available at:
http://www.nytimes.com/1988/03/14/nyregion/2-worlds-coexist-warily-in-a-prison-
town.html?pagewanted=all&src=pm.
4
  See, e.g., Mika’il DeVeaux, “The Trauma of the Incarceration Experience,” Harvard Civil Rights-Civil Liberties
Law Review, 48 Harv. C.R.-C.L. L. Rev. 257, Winter 2013, available at: http://harvardcrcl.org/wp-
content/uploads/2013/04/DeVeaux_257-277.pdf; Mark Gado, “Dannemora – the Hell Hole,” Carl Panzram: Too
Evil to Live, Part II, available at: http://www.trutv.com/library/crime/serial_killers/history/panzram2/3.html;
Matthew Purdy, “Brutality Behind Bars: A special report; prison’s violent culture enveloping its guards,” The New
York Times, Dec. 19, 1995, available at: http://www.nytimes.com/1995/12/19/nyregion/brutality-behind-bars-
special-report-prison-s-violent-culture-enveloping-its.html?pagewanted=all&src=pm; “Murder and brutality by
white supremacist COs in NY,” Sept. 2008, available at: http://test.prisoncensorship.info/news/all/NY/304/;
“Similarities mark two non-suicide deaths,” Oct. 17, 2010, Poughkeepsie Journal, available at:
http://www.poughkeepsiejournal.com/article/20101017/NEWS01/106030001/Similarities-mark-two-non-suicide-
deaths; Joe LoTemplio, “Fight at Clinton Correctional leads to lockdown, Press Republican, Aug. 23, 2011,
available at: http://pressrepublican.com/0100_news/x141817503/Clinton-Correctional-Facility-in-lockdown; Inmate
Liaison Committee, “Open Letter on Conditions at Clinton Correctional, Sept. 1, 2011, available at:
http://sbrooklynabcf.wordpress.com/2011/09/26/open-letter-on-conditions-at-clinton-correctional/; Strickland v. The
State of New York, 2013-041-016, March 27, 2013, available at:
http://vertumnus.courts.state.ny.us/claims/html/2013-041-016.html
5
  Purdy, supra note 3.

                                                        2
obtained data from DOCCS and the Office of Mental Health (OMH), visited nearly every facility
housing and program area in the Main and Annex, interviewed staff and incarcerated persons,
and mailed over 1,700 surveys to people incarcerated at Clinton who volunteered to participate
in the survey. In total, the CA received 610 surveys from people incarcerated at Clinton, 424
about general conditions (295 from the Main and 129 from the Annex), 43 about the Special
Housing Unit (SHU), 24 about Protective Custody, 58 about Merle Cooper, 41 about the
Assessment and Program Preparation Unit (APPU), 12 about the Intermediate Care Program
(ICP) or the Transitional Intermediate Care Program (TrICP), and eight specifically about
substance abuse treatment. The surveys ask about almost all aspects of prison life, and provide
qualitative data of incarcerated people’s various perceptions of life in prison, as well as
quantitative data used to rank facilities from best to worst in different areas. We also conducted
one-on-one interviews with patients in the ICP during our visit.
After providing a draft of this report to DOCCS and Clinton officials, on May 27, 2014,
the CA had a conference call with the Superintendent and members of the facility Executive
Team to discuss our findings and recommendations. During this call and through additional
FOIL requests, the CA also obtained updated information about conditions at Clinton in 2014.
This report is based on findings from data supplied by the facility, DOCCS, and OMH in 2012-
2014; the survey responses from people in prison; conversations with the Superintendent,
executive team, program staff and people in prison; and meetings with staff union representatives
and members of the Inmate Liaison Committee (ILC) and Inmate Grievance Resolution
Committee (IGRC). We appreciate the cooperation of the facility’s administration during our
visit and the extensive information staff provided us before, during, and after our visit. We also
deeply thank all the people confined at Clinton who spoke to us or participated in our survey.
SUMMARY OF FINDINGS AND KEY RECOMMENDATIONS
During our two-day visit to Clinton and through information gathered from staff, the
facility, DOCCS, OMH, and the people incarcerated at Clinton, the CA found some positive
aspects at the prison. The Merle Cooper program was one of the most highly rated programs by
staff and participants we have seen across the DOCCS system. In addition, people reported
feeling relatively safer in the ICP, a substantial percentage of the population had industry jobs,
and the vocational program in the Annex received relatively high ratings.
On the other hand, the CA is deeply concerned about the level of alleged violence and
staff abuse at the prison. Survey responses, particularly in the Main, but also in the Annex,
consistently ranked Clinton in the worst group of CA-visited prisons on a variety of indicators of
physical conflict between staff and incarcerated persons, racial tension, and verbal harassment,
threats, and intimidation. In addition, there were significant concerns about access to and quality
of medical care, a lack of meaningful programming capacity, and a higher number of suicides
and incidents of self-harm. We were also very disappointed to learn of the closing of the Merle
Cooper program.
3Our principle recommendations to relevant state, DOCCS, and prison officials include:
End all staff excessive use of force, remove abusive staff, and fundamentally transform the
prison’s culture from one of control by force to an environment supporting self-actualization.
Develop a plan to reduce racial tension and incidents of racial and verbal harassment,
including more diverse recruitment and additional diversity and race-relations staff training.
Enhance accountability, oversight, and investigation of alleged abuses facility-wide.
Develop and implement therapeutic harm reduction and peer led interventions to diminish
conflicts that result from drug use and/or gang participation.
Reduce the use of SHU and keeplock, limit lengths of stay, remove OMH patients, provide
meaningful human contact and programs for those in SHU, and address abuse in the SHU.
Expand mental health services in general population, including group therapy and peer
support, and take greater preventative measures regarding self-harm.
Decrease delays to see medical providers by filling vacancies and adding staff.
Limit deference given by medical staff to security staff, and ensure all patients receive timely
and appropriate care and are treated with respectful and caring attitudes.
Expand the capacity of academic, vocational (particularly in the Main), substance abuse
treatment, and transitional services programs by filling vacancies and adding staff.
Explore possibilities for college, college preparatory assistance, and/or computer training
programs.
Reopen the Merle Cooper program and/or replicate the program and its key components of
autonomy, peer support, and therapeutic interventions at Clinton and other DOCCS facilities.
Reduce staff abuse in the APPU and create more opportunities for therapeutic programming.
Explore opportunities for additional volunteer and peer-led programs.
Ensure that all persons have adequate access to hot water showers on a regular basis.
Assess nutritional content, food temperature, and sanitary conditions in the mess hall.
Reduce delays in mail distribution and address complaints in the package room about verbal
harassment and missing and denied items.
Reassess Parole Board practices to ensure fair release consideration based on each
applicant’s risk assessment, readiness for reentry, and rehabilitation and growth in prison.
GENERAL PRISON POPULATION AND CORRECTIONAL STAFF DATA
According to data provided by the facility, and as seen in Table A – Basic Demographic
Data at Clinton and in DOCCS Prisons System-Wide, Clinton Main has a capacity to hold
2095 people and imprisoned 1973 people at the time of our visit, while Clinton Annex had a
capacity of 861 people and held 822 people at the time of our visit. The vast majority of people
incarcerated at Clinton have been convicted of violent felonies, with 91% of people in the Main
and 84% in the Annex convicted of such crimes, much higher than the DOCCS system-wide
average of 63.2%. In turn, people serving time at Clinton have much longer sentences, with a
median minimum sentence of 14 years in the Main and 12 years in the Annex, compared to just
over 5 years system-wide. In fact, 62% of people incarcerated in the Main and 59% of the people
incarcerated in the Annex have minimum sentences of 10 years or more. Also of note, the Main
incarcerates a slightly higher percentage of black people than the already vastly disproportionate
number across the DOCCS system, while the Annex has a slightly lower percentage.
4Table A – Basic Demographic Data at Clinton and in DOCCS Prisons System-Wide6
Clinton Main Prison (July 2012) System-Wide DOCCS Data (Jan. 2013)
1973 people incarcerated; capacity: 2095 54,865 people incarcerated; capacity 61,331
53% black; 22% Latino; 22% white 49.5% black; 24% Latino; 23.8% white
26% under 30; 9% 55+ 27.5% under 30; 16.9% 50+; 3.8% 60+
Median age: 39 Avg. age: 37
Median minimum sentence: 168 months Median minimum sentence 62 months
91% convicted of violent felony 64.3% convicted of violent felony
5% convicted of drug offense 12.9% convicted of drug offense
Survey median time at Clinton 11 months
Survey median time in DOCCS 5 years Median time in DOCCS 2.1 years
Clinton Annex Prison (July 2012)
822 people incarcerated; capacity 861
45% black; 25% Latino; 26% white
27% under 30; 16% 55+
Median age: 36
Median minimum sentence: 144 months
84% convicted of violent felony
10% convicted of drug offense
Survey median time at Clinton 12 months
Survey median time in DOCCS 4 years
Overseeing this population of incarcerated persons, Clinton employed a total of 929
correction officers (COs). At the time of our visit, there were zero correction officers at Clinton
who were black, only five (or less than a half a percent) who were Latino, and only 30 (or around
three percent) who were women.
SAFETY
Relations between Staff and Incarcerated Persons
Clinton Main had some of the worst reported levels of physical and other staff abuses
among CA-visited facilities. In the Annex, while the allegations of abuse and particularly
physical abuse were much less severe, still verbal and racial harassment and related abuses are of
serious concern. Overall, 71% of survey respondents
The COs do a lot of foul things.
in the Main and 62% in the Annex rated relations with
officers as at least somewhat bad, ranking the Main in They beat us, call us names, shut off
the bottom fifth and the Annex about average for CA- our power, write lying tickets to get
visited prisons. Somewhat similarly, when asked to us locked up. --Anonymous
6
DOCCS data comes from DOCCS January 2013, Profile of Inmate Populations, the latest publicly available data
as of January 2014.
5compare relations with officers at Clinton with such relations at other prisons, two-thirds of
survey respondents in the Main and just under half of survey respondents in the Annex reported
that relations were at least somewhat worse at Clinton, ranking the Main in the bottom third and
the Annex around average for CA-visited prisons. These comparisons must also be seen in light
of the fact that people incarcerated at Clinton are comparing their situation to some of the other
most abusive prisons across the state. Infusing many of the allegations of abuse are intense racial
tensions reported at Clinton. As seen in Table A, 75% of the people incarcerated in Clinton Main
and 70% in the Annex are black or Latino, the
The majority of staff are white and majority of whom are from urban centers. Yet,
they are dealing with a lot of urban Clinton is located in rural upstate New York and as
men from inner cities. Plus they have discussed above, there are no black COs and only a
hate for city people. --Anonymous handful of Latino COs. Such a situation is ripe for
racial tension and abuse. Of the utmost concern,
particularly in the Main, were serious allegations of
physical violence by staff, widespread racial and verbal harassment, an environment of
intimidation, and a lack of accountability and oversight.
Overall Physical Safety and Violence
Numerous survey respondents in the Main raised allegations of the most serious physical
abuse by staff. As seen in Table B- Survey Responses Regarding Feelings of Safety, Physical
Assault, Sexual Abuse, over 90% of survey respondents reported physical assaults by staff are
at least common and 85% reported they hear about physical
The abuse and assault of
confrontations frequently or very frequently, ranking the
Main as one of the worst CA-visited prisons. Many survey [incarcerated persons] at this
respondents alleged that correction officers routinely beat up facility is beyond belief and
incarcerated persons. Almost three-quarters of survey there isn’t anything being done
respondents in the Main reported physical confrontations about it. --Anonymous
with staff were at least somewhat worse at Clinton than
other prisons, ranking Clinton in the worst fifth of CA-visited prisons. As one survey respondent
documented, “Beating of [incarcerated persons] by security staff here is routine. For the most
minor infractions, [incarcerated people] are savagely beaten and thrown back into their cells
without any medical treatment. These
Most of the officers can’t communicate. So they incidents are not reported by staff and
come out aggressive. They need to take social [incarcerated persons] are threatened
class. They are very angry people sometimes. with further violence if they try to seek
medical attention on their own: if their
More than us. A lot of the [incarcerated persons]
injuries are so severe medical attention
do stupid stuff too but a beatdown shouldn’t be can not be avoided, medical staff
the answer. They jump us and charge us with routinely cover for security staff by
assaulting them. --Anonymous understating the seriousness of the
injuries or the source of those injuries:
when word of staff assaults . . . do get out they are never properly investigated by administrative
staff.” Another survey respondent reported that “they beat up people regularly and cover it up . . .
I have vision problems (spots) from being beat in the head.” Survey respondents mostly reported
that these type of physical abuses occur throughout the facility in all areas and shifts. Looking at
6reported DOCCS’ Unusual Incident Reports (UIRs) in which staff use of force was reported in
the Main, the most common locations were the corridor (20%), medical area (12%), D-block
(11%), Upper F (8%), Upper H (8%), B-Block (7%), and a mental health unit (3%).
Table B- Survey Responses Regarding Feelings of Safety, Physical Assault, Sexual Abuse
CLINTON MAIN Very Once in
Frequently Once Never Rank*
Frequently a while
How often you feel unsafe 37% 26% 23.4% .4% 13.2 33
%
How often experience a physical .4% 6.3% 12.1% 13.8 67.4 31
confrontation here % %
How often hear about physical 47.5% 37.5% 10.8% 4.2% 35
confrontation
How often hear about sexual abuse 6.7% 6.2% 27.5% 6.7% 53% 31
How often experience pat frisk 9% 15% 27% 15% 34% 29
How often hear of sexual abuse 3% 6% 23% 7% 61% 7/10
other than pat frisk
Very Somewhat Only a
unsafe unsafe little
How unsafe you feel 53.1% 32.2% 14.7% 34
Most Common Not
common common
How common are physical assaults 60.5% 29.8% 9.6% 37
How common is sexual abuse 5% 22.6% 72% 34
How common are abusive pat frisks 47% 35% 18% 34
CLINTON ANNEX Very Once in
Frequently Once Never Rank
Frequently a while
How often you feel unsafe 26.4% 12.6% 38% 6% 17% 21
How often experience a physical 1% 2.4% 8% 10.6 78% 17
confrontation here %
How often hear about physical 27% 27% 29% 4.5% 12.4 19
confrontation %
How often hear about sexual abuse 4.5% 10.6% 27% 4.5% 53% 33
How often experience pat frisk 14% 5% 19% 12% 50% 19
How often hear of sexual abuse 4% 11% 23% 8% 54% 8/10
other than pat frisk
Very Somewhat Only a
unsafe unsafe little
How unsafe you feel 36.5% 42% 21.6% 17
Most Common Not
common common
How common are physical assaults 29.6% 42% 38% 24
How common is sexual abuse 7.4% 22% 71% 35
How common are abusive pat frisks 26% 40% 34% 26
* Unless indicated otherwise, CA-visited facilities are ranked from 1-38, one being the best and 38 being the worst.
7More than a dozen survey respondents even alleged that on a few occasions in recent
months and years, officers had beaten people so badly as to cause their deaths. As one survey
respondent reported – a complaint repeated numerous times – “at least three people were
assaulted and killed by security since I’ve been here; all deaths were covered up by security and
medical staff.” Another survey respondent reported that “people [have] been killed here. They
are handcuffed then beaten. One [incarcerated person]
was thrown down the stairs while handcuffed.” Correctional Officers have killed
According to another survey respondent, “from what men in here. --Anonymous
other [incarcerated persons] tell me, the officers here
are not as bad as Attica, Comstock, etc. But they do jump you, kick your teeth out and on
numerous occasions cops at Clinton have killed [incarcerated persons].”
According to DOCCS data on deaths in DOCCS custody, there were 31 deaths of all
causes at Clinton between 2007 and 2013, with 13 deaths in 2012 and 2013 alone. While these
deaths include all causes of death, and seven of the deaths from 2007 to 2011 were deemed
suicides, a sample of information obtained from the State Commission of Corrections (SCOC)
and the Commission on Quality of Care (CQC) through FOIL requests, indicates that at least
some of the deaths were the direct result of staff use of force. As one example, an incarcerated
person died in 2010 after a physical altercation during which, according to DOCCS’ own
rendition of events as documented in an SCOC report, amongst other things, a CO “used his
facility-issued baton, striking [the incarcerated person] several times in the legs and back area,”
and a CO “used both fists striking [the incarcerated person] in the head and neck area, knocking
him to the floor.” In another example, a man died in 2008 from “hypoxia due to blunt force
trauma to the chest with multiple rib fractures sustained during a use of force . . . by DOCS
staff.” Although DOCCS contends that in both instances the use of force by officers was done in
response to physical attacks from the incarcerated persons, regardless of the contention, the fact
is that a physical confrontation involving the use of force by staff led to the deaths of these
incarcerated persons.
A death closer to the time of our visit also raises concerns, particularly with respect to the
dissemination of information when a death occurs at the facility. Specifically, several survey
respondents and people interviewed during our visit alleged that within around a month before
our visit, an incarcerated person in the Upper F housing area had been beaten by correction
officers and subsequently died. Information received from the State Commission of Corrections
(SCOC) in response to a FOIL request indicates there was a death of an individual housed in
Upper F in early June 2012. At the time of the death, DOCCS reported the cause of death to be a
suicide, and a subsequent death review by the SCOC concluded that the death was a suicide. To
the extent these conclusions are accurate about the cause of death, the case not only raises
serious concerns surrounding the suicide itself but also illustrates how a lack of timely clarity by
the facility when there are sudden and violent deaths, coupled with the overall environment of
abuse and intimidation, can exacerbate tensions between staff and incarcerated persons and
inflame skepticism about the cause of suicides and other deaths.
As a result of the alleged abuses that occur, survey respondents expressed fear of staff
abuse and how that fear limits their activities in the prison. As seen in Table B, over 63% of
survey respondents in the Main reported that they at least frequently feel unsafe at Clinton and
8over 86% reported that they feel unsafe at least once in a while, ranking the Main in the worst
seventh of CA-visited prisons. Similarly, when asked how
unsafe they feel at the prison, over 53% reported feeling very I fear for my own life. I can’t sleep
unsafe and over 85% at least somewhat unsafe, again ranking or eat because I am watching the
the facility as one of the worst CA-visited prisons. According
bars 24/7. --Anonymous
to one person incarcerated at Clinton, “the officers here be
jumping on [incarcerated persons] here. A lot of these
[incarcerated people] are afraid to speak up for what is right in these prisons. These officers
always beating up and killing [incarcerated persons]. I don’t trust them at all.”
Turning from the Main to the Annex, the Annex ranked slightly worse than average for
the degree to which survey respondents viewed physical
Physical, verbal, mental,
confrontations at Clinton as being worse than physical
emotional abuse we deal with
confrontations at other prisons. As seen in Table B,
around 84% of survey respondents indicated that they hear on a daily basis. --Anonymous
about physical confrontations with staff at the facility at
least once in a while, while 78% reported that they had never personally experienced a physical
confrontation, ranking the Annex about average for CA-visited prisons. Almost 72% of survey
respondents in the Annex did indicate that physical assaults by staff are at least common, ranking
the Annex in the bottom 40% of CA-visited prisons.
Unnecessary beatdowns of Although substantially better than the Main, the degree of
[incarcerated persons] must reported physical abuses still raises concerns. Some survey
end now. --Anonymous respondents noted that not all officers are problematic, but
certain officers are particularly abusive. According to one
survey respondent in the Annex, “for the most part cops are doing a good job . . . certain ones
abuse power . . . the bad ones are prone to use force and if they do they’ll all back each other up .
. . [For one CO], slaps, fists, and force are his pleasures . . . To be blunt, they belong in prison,
not working in one.” Several survey respondents noted that the area near the so-called 460 gate is
particularly prone to physical abuse by staff as well as verbal harassment.
Survey respondents in both the Main and the Annex reported that racist attitudes play a
significant role in the physical violence that occurs at
Clinton. As one survey respondent reported, “murder, They are very racist here and
assault, harassment, threats, intimidation, etc. is all they look for the smallest
motivated by race. For every time an officer or officers things to assault [incarcerated
assault, kill, or maim an [incarcerated person], racial slurs persons]. --Anonymous
are always hurled all over the place, and all this criminal
behavior goes on directly under the eyes of an administration that looks the other way.” Another
respondent decried, “blacks and Latinos make up only [35%] of the NYS population, but make
up [75%] of the prison population. What’s wrong with that picture? . . . I am tired of seeing black
men and Latinos being beaten and killed by the staff in THIS JAIL!”
Looking at DOCCS data on the number of Unusual Incident Reports (UIRs) for assault
on staff, Clinton as a whole, including the Main and Annex, had a relatively high absolute
number but a relatively low rate compared to other maximum security prisons. Specifically,
between 2007 and 2011, Clinton had a total of 163 reported assaults on staff UIRs, the third
9highest number for all DOCCS prisons, but representing an annual rate of only 11.7 reported
assault on staff UIRs per 1,000 incarcerated persons, the fourth lowest rate for men’s maximum
security prisons. The number of assault on staff UIRs dropped to a rate of only 7% in 2012,
though rose back up to just over 10% in 2013. Given that UIR data is a total rate combined for
the Main and Annex and given that the data gathered from people incarcerated in the Main and
Annex paints very different pictures about the level of violence between staff and incarcerated
persons, it is hard to tell whether this DOCCS data indicates a lower level of reported violence
across Clinton than would appear from the survey responses or whether there are relatively lower
levels of violence in the Annex and relatively higher levels in the Main. Similarly with respect to
the number of disciplinary infractions imposed for assault on staff by incarcerated persons, the
rate of assaults at Clinton of 13 assaults per 1,000 incarcerated persons in 2011 was the fourth
lowest for men’s maximum security prisons, although the absolute number of assaults – 37
assaults in 2011 – was the sixth highest among all prisons. Indicative of the differences between
the Main and Annex, in 2012 and 2013 there were 22 assaults per 1,000 incarcerated persons in
the Main and 3.6 in the Annex. Based on the 2011 rates for all of DOCCS prisons, this rate
would place Clinton Main in the bottom half of maximum security prisons and among the worst
seventh for all DOCCS prisons. Also of concern, there was a rise in assault on staff disciplinary
incidents in the Main in 2013, up to 52 alleged incidents, or a rate of more than 26 incidents per
1,000 incarcerated persons in the Main.
Looking further at Unusual Incident Reports (UIRs) in the Main, from September 2010
through October 2013, there were 181 UIRs in which use of force was used, representing 21.7%
of all UIRs and ranking the Main between the worst third and the worst half of maximums
security DOCCS prisons. In addition, there were 58 UIRs in which baton use was reported,
ranking Clinton Main as one of the worst DOCCS prisons. Of note, for all Unusual Incidents in
which staff members were involved in 2012 and 2013, there was no injury to staff whatsoever in
over 96% of the UIRs, minor injury in 3.4% and moderate injury in only half of one percent. For
assault on staff in particular, there was no injury whatsoever in 72% of the UIRs in 2012 and
2013, minor injury in just under 25%, and moderate injury in just under 4%. By contrast, for
incarcerated persons involved in assault on staff UIRs in 2012 and 2013, DOCCS reported that
only 13% of incarcerated persons had no injury while 87% suffered a minor injury. These sharp
differences in injury outcomes for staff and incarcerated persons during reported assaults on staff
– whereby staff are generally not receiving injuries and incarcerated persons are suffering
injuries – raise two major concerns. First, there is a concern that staff are actually assaulting
incarcerated persons and then writing up the incidents as assaults on staff. Second, there is a
concern that staff are responding to minor conduct from incarcerated persons with excessive use
of force.
In addition to general physical violence, survey responses raised concerns about sexual
abuse. As seen in Table B, both the Main and the Annex ranked as two of the worst CA-visited
prisons for how common sexual abuse is reported to occur, as well as in the worst fifth for how
often survey respondents hear about sexual abuse. A number of survey comments in both the
Main and the Annex reported specific examples of officers threatening incarcerated persons with
sexual violence, and some survey respondents reported CO threats of sexual violence against
their family members. Particularly with regard to abusive pat frisks, the Annex ranked about
average for CA-visited facilities for how often survey respondents had experienced that
misconduct, while the Main ranked in the worst quarter, with several survey comments noting
10abusive pat frisks by security officers. On the other hand, looking at data collected in accordance
with the Prison Rape Elimination Act (PREA), Clinton’s annual rate between 2008 and 2011 of
reported sexual abuse by staff of 6.46 incidents per 1,000 incarcerated persons, placed the prison,
including both the Main and the Annex, only in the worst 40% of DOCCS prisons.
Racial Harassment and Intimidating Environment
In addition to physical violence, survey respondents in both the Main and the Annex
reported other forms of staff abuse, particularly racially motivated harassment and threats. As
seen in Table C-Harassment, Threats, Discipline, and
Retaliation at Clinton, the Main ranked as one of the worst The lack of respect that they
CA-visited facilities for how much racial tension exists at have for us and they talk down
the facility, how much that racial tension contributes to to us like we’re less than
abuse, and how much racial harassment takes place. human. --Anonymous
Table C-Harassment, Threats, Discipline, and Retaliation at Clinton
CLINTON MAIN Very Once in
Frequently Once Never Rank
Frequently a while
How often personally 25.8% 23.3% 28.8% 6.3% 15.8% 24
experience verbal harassment
How often hear about verbal 57% 28.4% 12% .4% 1.7% 27
harassment
How Common is Racial 38% 35% 15% 6% 6% 36
Tension*
How Much Racial Tension 59% 28% 10% 3% 37
Contributes to Abuse**
Most Common Not Rank
Common Common
How common is verbal 71.6% 22% 6.6% 35
harassment?
How common is racial 53.2% 34.4% 12.4% 38
harassment?
How common are threats and
70% 22% 8% 37
intimidation?
How common is turning off
48.6% 35% 16.4% 36
lights or water?
How common is retaliation
61% 30% 10% 37
for complaints?
How common are false
58% 26.4% 15.5% 34
tickets?
How common is the
35% 47% 17.6% 35
destruction of property?
Other 57% 34% 9% 38
*The responses to this question are: widespread, fairly common, some, very little, not at all
** The responses to this question are: a lot, somewhat, very little, not at all
11CLINTON ANNEX Very Once in
Frequently Once Never Rank
Frequently a while
How often personally 35% 21% 21% 6% 17% 27
experience verbal harassment
How often hear about verbal 49% 26% 15% 3.4% 7% 15
harassment
How Common is Racial 30% 31% 21% 13% 6% 29
Tension*
How Much Racial Tension 49% 30% 13.5% 8% 30
Contributes to Abuse**
Most Common Not Rank
Common Common
How common is verbal 65% 25% 10% 32
harassment?
How common is racial 41% 31% 27.5% 32
harassment?
How common are threats and
53% 29% 18% 28
intimidation?
How common is turning off
22% 25% 53% 32
lights or water?
How common is retaliation
61% 21% 17% 35
for complaints?
How common are false
57% 21% 21% 31
tickets?
How common is the
29% 35.6% 35.6% 33
destruction of property?
Other 42% 32% 26% 31
*The responses to this question are: widespread, fairly common, some, very little, not at all
** The responses to this question are: a lot, somewhat, very little, not at all
Specifically, 88% of survey respondents reported that racial harassment was at least
common, 92% reported that there was at least some racial tension, almost three-quarters said
racial tension was at least fairly common, and 77% reported that racial tension at least somewhat
contributes to abuse. Moreover, when looking at how common survey respondents viewed a
variety of other forms of abuse, including threats and retaliation, and interfering with lights and
water, the Main consistently ranked as one of the worst few CA-visited facilities. Though
ranking slightly better in terms of the level of reported verbal harassment, still the Main ranked
in the bottom half to bottom third on relevant indicators, and
All officers look upon us as more than 85% of survey respondents said they hear about
we are the lowest forms of verbal harassment frequently or very frequently. Similarly,
the earth. --Anonymous though slightly better, the Annex ranked in the bottom
quarter for the degree of racial tension and harassment, and
the degree to which such tension contributes to abuse, and consistently ranked in the worst
seventh of CA-visited facilities for how common survey respondents viewed a variety of other
forms of staff abuse.
12Consistent with the rankings, in both the Main and the Annex, though more frequently in
the Main, numerous survey respondents reported repeatedly being called the N-word, and other
demeaning and derogatory racial slurs. Many others reported that other types of expletives are
also frequently used by COs, and that threats of violence The staff here are very
are common practice. Numerous survey respondents combative, racist, out of touch
lamented the lack of black correction officers as a with other racial groups,
contributing factor to abuse. In addition to racially verbally abusive, and don’t
motivated harassment and threats, many survey care anything about
respondents also reported that COs frequently used gay rehabilitation. --Anonymous
slurs. Others reported that officers attempt to provoke
incarcerated persons. As one survey respondent
commented, “they go out of their way to degrade you verbally . .
Most officers speak to . If you say something, they will go out of their way to retaliate
[incarcerated persons] in and tell other officers to do the same.” Similarly, another survey
an infuriating, provoking respondent wrote that “the biggest problem is that COs act like
tone. --Anonymous a gang. They speak to you like you’re less than a man. They are
unprofessional . . . they start an issue and then beat you up . . .
and yet nothing happens to them like we are their personal punching bag.” Several survey
respondents suggested that the facility needs to utilize better recruiting and training of staff in
order to improve staff ability to work with people of different races.
A large number of survey respondents noted that people convicted of sex offense crimes
receive even more harassment and abuse from staff, as well as peers, because they are viewed
with even more prejudice than the rest of the population. As one survey respondent noted, people
convicted of sex offenses are “continually victimized . . . Officers look at [them] the same way
population does, with utter disgust, which leaves [those individuals] in grave danger.” Another
survey respondent noted that “it is widely known that sex offenders, especially those with crimes
against minors, are considered the ‘scourge’ of the prison system. Other [incarcerated persons]
very often physically abuse and harass these [individuals]. This treatment is usually condoned
and even encouraged by officers. In fact they often engage in the very same abuse. . . . it seems
that sex offenders are the group that everyone loves to hate, in prison as well as the general
public. . . . this state-sanctioned bias only perpetuates additional abuse and does no one any
good. “
Lack of Oversight and Accountability
Many survey respondents complained about the lack of oversight or accountability for the
actions of security officers. Overall, 87% of survey respondents in the Main and 87% in the
Annex claimed that the administration did very little to nothing at all to prevent staff abuse at
Clinton (50% in the Main and 44% in the Annex said
nothing at all), ranking the Main in the worst fifth and [COs] feel that they are God and
the Annex in the bottom third of CA-visited prisons. can't be touched and they have no
Survey respondents, particularly in the Main, problems beating or killing
complained that correction officers control what somebody here. --Anonymous
happens in the prison and in particular areas, and that
abuses that occur are covered up. As one survey respondent noted, “this facility is best described
13as a conspiracy when it comes to covering up their dirty laundry. Everybody from medical staff,
civilian coordinators, and officers are all together and have a profound resentment towards us for
unknown reasons that is only rationalized by pure hatred.” A survey respondent in the Annex
similarly noted that “The supervisors here condone the practice of abuse here.” Some survey
respondents commented that changing the situation would require implemented changes from the
top facility leadership. As one person suggested, “change of the ‘culture’ at Clinton C.F. would
need to be from top down. One weak superintendent is replaced by another and modeling of
assaultive . . . and often illegal behaviors by staff continues unabated.” Others suggested that
what was needed was an outside independent monitoring body. According to one survey
respondent, “the imbalance of ethnic groups at Clinton gives [correction officers] an air of
superiority. The familial ties [gives them] an air of invincibility. The locale of the prison keeps it
from scrutiny or accountability. The COs run the jail – not administrators. . . . Unless there is an
ombudsman or readily accessible independent organization to [people incarcerated at] Clinton,
all of the present conditions will persist if not take a turn or the worse.” Similarly, another survey
respondent lamented that “no independent outside investigation in incidents occurs. And local
courts support whatever story is being told by officers. With a consensus amongst officers to
agree on the particulars of any incident that leaves [incarcerated persons] at their mercy. Rarely
does a [person in prison] win a case where he brings charges against an officer.”
As another potential form of accountability, three-quarters of survey respondents in the
Main and 70% in the Annex thought that video cameras would at least somewhat help to reduce
staff abuse. According to one survey respondent, “All of us are getting assaulted and there is
nothing we can do. Because there are no cameras to watch what goes on.” Many survey
comments in both the Main and the Annex expressed the need to have video cameras throughout
the facility. As one survey respondent stated, “In a facility like Clinton with secluded and
dangerous areas that are constantly being used to beat, hurt and kill prisoners, there should have
been cameras placed in every corridor, stairwell, secluded area, cell block, cell block stairwell.
There are always correction unions who are against cameras in prisons. Who is in charge: central
office, the governor’s office, legislative bodies, or the malicious prison guards? Cameras would
protect both sides.” Similarly, another survey respondent suggested that “security cameras
throughout this facility on every company in every block, in all corridors, and wherever
[incarcerated persons] are, if un-tampered with, would without a doubt go a long way in stopping
racist criminal behavior by security and medical staff and save a lot of lives and help in
prosecuting criminals who masquerade as officers, nurses, and supervisors who commit criminal
acts and think they are immune from prosecution.” Similar to the insights of incarcerated
persons, in an April 2012 death review at Clinton obtained through a FOIL request, the SCOC
has recommended the possibility of additional video surveillance in high risk housing units at
Clinton, such as those with people diagnosed with mental illness, medical corridors, general
corridors in the facility and landings at the end of housing unit galleries.7
Relations among Peers
According to survey responses, peer relations in the Annex were relatively average for
CA-visited prisons, while the Main ranked as one of the more problematic CA-visited facilities.
7
See Final Report of the New York State Commission of Correction, April 23, 2012, In the Matter of the death of [a
redacted person incarcerated] at the Clinton CF, p. 8.
14Table D- Survey Responses in Regards to Conflict Among Incarcerated Persons
CLINTON MAIN Very Once in a
Frequently Once Never Rank
Frequently while
How often are fights 33% 36% 25.4% .4% 5% 35
amongst peers
How often you were in 1.3% 1.7% 14.2% 10.3% 72.4% 24
fight w/ peer
How often staff involved 9.6% 16.8% 32.2% 6.3% 35.1% 33
How often non-consensual 1.6% 9.4% 42% 9.4% 37.5% 12/
sexual contact among peers 15
Much Somewhat Avg Somewhat Much
Worse Worse Better Better
Here
Compare peer fights to 20% 20% 51% 5% 4% 35
other prisons
Compare drug use to other 14.5% 6% 65% 8.5% 6% 32
prisons
Compare gangs to other 26.9% 13.7% 52.2% 2.2% 4.9% 36
prisons
Factors Contributing to Most Common Not
Peer Conflict Common Common
Personal Conflicts 40% 54% 6% 36
Gangs 53% 34% 10% 38
Drugs 32% 41.5% 27% 35
Theft of property 21.5% 47% 31.4% 29
Gambling 26% 47% 27% 33
Stress of being in prison 41.5% 41.5% 17% 33
Other 65% 23% 11.5% 38
Very Somewhat Somewhat Very Rare None
Common Common Rare
Contraband Drug Use 43% 40.5% 8.3% 7.4% .8% 33
Gang Activity 72.8% 19.4% 3.1% 4.7% 36
A Lot Somewhat Very Little Not at All
Drugs as source of violence 20.5% 29% 27% 24% 29
Gangs as source of violence 57% 30% 11% 2% 34
CLINTON ANNEX Very Once in a
Frequently Once Never Rank
Frequently while
How often are fights 8.3% 16.7% 66.7% 1.2% 7.1% 21
amongst peers
How often you were in 1% 17.4% 11.6% 70% 25
fight w/ peer
How often staff involved 8% 8% 30% 1.4% 52% 20
How often non-consensual 3.7% 52% 7.4% 37% 11/1
sexual contact among peers 5
15Much Somewhat Avg Somewhat Much
Worse Worse Better Better
Here
Compare peer fights to 6% 8.6% 22% 30% 33% 17
other prisons
Compare drug use to other 6% 4% 54% 13.5% 23% 21
prisons
Compare gangs to other 5% 10% 35% 15% 35% 17
prisons
Factors Contributing to Most Common Not
Peer Conflict Common Common
Personal Conflicts 39% 53% 8% 32
Gangs 30% 43% 27% 27
Drugs 26% 39% 35% 31
Theft of property 25% 51.4% 23.6% 35
Gambling 27% 45% 28% 32
Stress of being in prison 36% 51% 13% 31
Other 65% 12% 23.5% 37
Very Somewhat Somewhat Very Rare None
Common Common Rare
Contraband Drug Use 36% 38% 19% 4% 4% 29
Gang Activity 35% 36.5% 8% 17.5% 3% 18
A Lot Somewhat Very Little Not at All
Drugs as source of violence 9% 30% 31% 30% 24
Gangs as source of violence 18% 29.5% 41% 11.5% 22
For the Main, as seen in Table D- Survey Responses in Regards to Conflict Among
Incarcerated Persons, almost 70% of survey respondents reported that fights among peers
occur frequently, ranking Clinton as one of the worst CA-visited prisons. Somewhat of a more
positive indicator, more than 72% of survey respondents
in the Main reported they themselves had never been COs start tension between
involved in a fight with a peer, ranking the facility in the [incarcerated persons] that
bottom half of CA-visited prisons. Still, when asked to account for most of the physical
compare the amount of peer fights at Clinton compared to problems here. --Anonymous
other facilities as well as the level of gang activity,
around half of survey respondents rated the Main as about average, while 40% said that Clinton
was at least somewhat worse, again ranking the facility among the worst few CA-visited prisons.
Consistent with this survey data, according to DOCCS data on UIRs for peer assaults from 2007
through 2011, Clinton ranked in the bottom 20% of maximum security prisons with an annual
rate of 26 assaults per 1,000 incarcerated persons from 2007 through 2011. That rate dropped to
21 assaults per 1,000 incarcerated persons in 2012 but then rose to 34 assaults per 1,000
incarcerated persons in 2013. Looking at all peer assault UIRs from September 2010 through
October 2013, there were 230 reported peer assault UIRs in Clinton Main, ranking the Main as
one of the worst DOCCS prisons for the rate of peer UIRs per 1,000 incarcerated persons.
Similarly, looking at disciplinary tickets, from January 2010 to November 2013, there were 272
16peer assault tickets issued in Clinton Main, again ranking the Main as one of the worst DOCCS
prisons for the rate of peer assault tickets per 1,000 persons.
When asked to identify the causes of violence, survey responses in the Main indicated
that gangs, personal conflicts, and drugs served as some of the most significant contributing
factors to peer conflict that occurs, along with gambling and the stress of being in prison. Indeed,
over 92% of survey respondents reported that gang activity was at least somewhat common in
the Main, ranking the facility as one of the worst CA-visited prisons, and over 83% of survey
respondents reported that drugs were at least somewhat common, again ranking the facility in the
worst seventh of CA-visited prisons. Also of concern, many incarcerated persons indicated staff
played a major role in instigating peer conflict. As seen in Table D, 59% of survey respondents
indicated that of the peer confrontations they witnessed, staff was involved in encouraging or
permitting the confrontation at least once in a while, with over a quarter indicating staff was
frequently involved, ranking the facility in the worst seventh of CA-visited prisons.
In the Annex, as seen in Table D, survey responses ranked the facility near the middle of
CA-visited facilities on a variety of indicators of peer conflict, including how often fights among
peers occur, how often staff is involved in instigating or permitting such conflicts, and how much
peer conflict and gang activity occurs in the Annex as compared to other DOCCS prisons.
Consisting with survey responses, looking at DOCCS data, the Annex had 49 peer assault
disciplinary charges from January 2010 to November 2013, and 18 peer assault UIRs from
September 2010 through October 2013, ranking the Annex near the middle of maximum security
prisons. When asked for the underlying reasons for peer conflicts that do occur, survey
respondents reported theft of property, personal conflicts, and stress of being in prison as the
most common contributing factors. Drug use in the Annex did seem to be a more significant
problem than other issues. Specifically, 74% of survey respondents in the Annex indicated
contraband drug use is at least somewhat common, ranking the Annex in the worst quarter of
CA-visited prisons. Also, the Annex ranked as slightly worse than average for the degree to
which drug use was seen as a source of violence and for how the level of drug use in the Annex
compared to other prisons.
SPECIAL HOUSING UNIT (SHU)
Clinton’s isolated confinement units were marked by frequent usage, lengthy sentences,
inhumane conditions typical of other isolated confinement, and significant numbers of people
with serious medical and mental health needs.
With respect to frequent usage, at the time of our visit, Clinton’s official Special Housing
Unit (SHU) housed 42 people, with a capacity for 48. In addition, Clinton has alternative SHU
and long-term keeplock cell blocks separate from the designated SHU that are also used for
disciplinary confinement, as well as for voluntary and involuntary protective custody. According
to data provided by the facility, Clinton had a total of 134 people in SHU confinement and 81 in
keeplock at the time of our visit. In May 2014, there were 103 people in the SHU8 and 55 people
in keeplock. One quarter of general population survey respondents in the Main and 29% in the
8
On May 25, 2014, DOCCS reported there were 71 people in disciplinary SHU confinement in the Main, four
people in administrative segregation, and 28 people in disciplinary SHU confinement in the Annex.
17Annex had been in the SHU at Clinton, ranking the Main near the bottom half of CA-visited
prisons and the Annex in the bottom fifth for the percentage of survey respondents who reported
being in the SHU. In addition, more than half of all general population survey respondents had
been in keeplock at Clinton in both the Main and the Annex, ranking both in the bottom third of
CA-visited facilities with comparable data. Similarly indicative of an overuse of discipline and
punishment at Clinton, 64% of survey respondents in the Annex had received a misbehavior
report at Clinton, while 57% of survey respondents in the Main had received a misbehavior
report, ranking the Annex in the worst 15% of CA-visited facilities and the Main in the bottom
third. The problematic racial dynamics at Clinton, described above, also infuse the usage of
isolated confinement, although in a way similar to other DOCCS prisons. While, as noted above,
black and Latino men made up 74% of the total prison population at Clinton for the Main and
Annex, they made up 84% of the people in the designated SHU, unfortunately similar to system-
wide racial distributions.
Consistent with this data from the facility and from survey respondents, DOCCS system-
wide data also indicates frequent usage of isolated confinement. According to DOCCS data
obtained through a FOIL request, from January 2010 to November 2013, there were a total of
11,385 disciplinary hearings in the Main involving 4,418 separate individuals, ranking Clinton as
one of the worst few DOCCS prisons for the number of hearings per 1,000 incarcerated persons
(6,769).9 The total number of separate individuals in the Main meant that approximately 78% of
all people who were incarcerated at Clinton at some point from January 2010 to November 2013
had a disciplinary hearing.10 In addition, 3,392 people were sentenced to SHU and/or keeplock,
representing 60% of all people incarcerated at Clinton at any time during this time period.
Adding to the problematic overuse of tickets resulting in isolation, people are frequently
sentenced to significant lengths of time in isolation at
Clinton. According to DOCCS data, the median Officers here seem like they
individual SHU sentence at Clinton for the latest year of want to make a quota because
available data, and from January 2010 to November 2013, they give out false tickets all
was 120 days, higher than the already excessive 90 days
the time. No one ever beats a
median system wide. In addition to having more than half
of the individual sentences to SHU confinement at Clinton ticket. --Anonymous
of 120 days, 77% of SHU sentences were for 90 days or
more, 42% were for six months or more, and almost 8% were for at least one year or more.11
Even worse for alleged charges of assault on staff, from January 2010 to November 2013, of the
147 assault on staff hearings, only two people were found not guilty of all charges, the median
SHU time received was seven months, and one third of all persons found guilty received one
year or more of SHU time.
9
In the Annex, the rate of disciplinary hearings per 1,000 incarcerated persons (5,889) also ranked the Annex among
the worst few DOCCS prisons.
10
Based upon an estimate that 1,000 persons are admitted to Clinton Main each year (between April 2013 and April
2014, there were 877 new persons at the prison), and a population of 1,690, the total number of persons at Clinton
Main during the nearly four years 2010 through October 2013 would be approximately 5,700 persons.
11
Similarly, from January 2010 to November 2013, of all the individual hearings resulting in SHU time, 43% in the
Main and 27.4% in the Annex resulted in SHU time of six months or more.
18These long SHU sentences are particularly disturbing because they represent the time
allocated for only a single particular disciplinary infraction and people often accumulate
additional time while in the SHU due to further disciplinary infractions. Indeed, more than 43%
of SHU survey respondents reported a total SHU sentence of at least one year and nearly 23%
reported a total SHU sentence of two years or more, with some survey respondents reporting
sentences of four or five years and even up to 13 years. Consistent with this information reported
by survey respondents, DOCCS disciplinary data from January 2010 to November 2013
indicated that many individuals received multiple disciplinary tickets during this time period and
were sentenced to long periods of isolated confinement. Some individuals had as many as 20, 30,
and even 40 disciplinary hearings. Nearly 60% of all separate individuals who had a disciplinary
hearing had at least two disciplinary hearings during this time period. When looking at
cumulative sentences – including the total amount of SHU and keeplock time minus any time
cuts received – many people were subjected to extremely long periods of isolated confinement.
Six individuals were sentenced to five year sentences or more, with the highest amounts of time
being eight years and 10 years of isolated confinement. More than 400 people in Clinton Main
were sentenced to one year or more, over 1,000 people in the Main received six months or more
of time in isolated confinement, and over 2,780 people received 30 days or more, representing
49% of people incarcerated in the Main at some point during this period.
Staff indicated that typical disciplinary violations that result in people getting SHU time
at Clinton are drug possession, assault on others, and weapons possession. However, as seen in
Table E- Common Forms of Abuse of People Held in the SHU by Staff, more than 84% of
SHU survey respondents reported that false tickets are at least common, ranking Clinton in the
worst third of CA-visited prisons. As one survey respondent reported, “officers write false tickets
and they always stick . . . even though the evidence does not add up the ticket is upheld. When
appealed, the ticket is still upheld.”
Turning from the overuse of the SHU to the conditions in the SHU, like other isolated
confinement units across the state, people in Clinton’s SHU and keeplock units spend 23 to 24
hours per day in a cell, with one hour per day
allotted for recreation and without meaningful The COs play with our feed-up trays,
human contact or programs. As one survey intimidate us, deny us recreation and
respondent noted, “there is no alcohol or drug showers, and state soap. It is a very
treatment or help available. I have asked and to no harsh environment. --Anonymous
avail. I also feel my mental health has gone down
since being here.” Compared to other CA-visited
SHUs, Clinton survey respondents reported utilizing recreation relatively more often.
Specifically, 37% reported that they used recreation frequently and an additional 44% reported
using recreation once in a while, ranking Clinton in the top third of CA-visited SHUs. On the
other hand, 37% still represents a low utilization rate for the one activity available to SHU
residents. Numerous survey respondents who
There is no point [in going to
reported using recreation only once in a while, once,
recreation]. We are locked in a cage or never, complained that they did not go out for
with no rec equipment. --Anonymous recreation either because: a) the recreation itself only
involved being in a cage without any equipment, or
19You can also read