Clustering of neuropsychological traits of preschoolers - Nature
←
→
Page content transcription
If your browser does not render page correctly, please read the page content below
www.nature.com/scientificreports
OPEN Clustering of neuropsychological
traits of preschoolers
Mario Treviño2*, Beatriz Beltrán‑Navarro3, Ricardo Medina‑Coss y León2 &
Esmeralda Matute1*
Neuropsychological tests (targeting cognitive, linguistic, motor, and executive abilities) are grouped
in neuropsychological domains that are thought to be stable through adulthood. However, this
assumption does not always hold true, particularly during young children’s early developmental
phase. Here, we explored how the neuropsychological profile of typical Spanish-speaking preschoolers
varied and consolidated with age. We recruited 643 monolingual Latin-American children from
Mexico, Colombia, and Guatemala, with ages spanning from 30 to 71 months of age, and applied
a novel neuropsychological examination which combined a total of 52 tests covering five classical
neuropsychological domains: receptive, expressive, attention/memory, processing, and executive
functions. These tests’ scores uncovered a correlational structure across neuropsychological
functions that could not be explained by chance. Notably, these correlations’ overall strength, but
not their interdependence across domains, dramatically increased with age. Moreover, by applying
conventional clustering techniques to classify the experimental data, we found a stable representation
of two clusters of children with distinctive traits, with cultural factors contributing to this classification
scheme. We also found that the tasks were well organized in a network of abilities, where nodes
with highest highest interconnectedness were those that required multimodal processing. These
results contribute to our understanding of children’s ‘normal’ development and could help identify
how failure in particular functions forecasts the emergence of neurodevelopmental disorders. Our
analytic methods might become useful to characterize individual differences and improve educational
practices and interventions.
Historically, neuropsychological research has focused on the administration of tests to identify brain dysfunc-
tions and learning disabilities. The traditional view, mainly derived from lesion studies, proposes that the human
brain has discrete and separate modules specializing in specific f unctions1. Under this notion, it should be pos-
sible to associate a localized brain lesion with a single functional disruption. A more contemporary perspective,
however, proposes that the brain can not be assumed to be modular because it is not composed of isolated parts.
Indeed, evidence shows that the brain exhibits large-scale interconnectivity patterns that are incompatible with
the idea of independently functioning modules. Accordingly, modern neuroscience tries to explain behavior
due to complex interactions across multiple brain areas2. For example, executive functions, which depend on the
prefrontal cortex and subcortical systems, are generally described as multidimensional constructs consisting of
several interrelated sub-functions3–5. These sub-functions include volition, goal selection, planning, inhibition,
cognitive flexibility, working memory, and evaluating the results of actions, among others. Neuroconstructivist
and developmental approaches also view the brain as a dynamic self-organized system with internal (physiologi-
cal, genetic) and external (context) factors that shape it’s maturation, also with patterns of activation becoming
specialized through this process1. Therefore, almost every aspect of development turns out to be dynamic and
interactive6.
Many studies have shown how neuropsychological functions unfold from infancy to adolescence, within
different hierarchical m odules3,7–9. These modules develop at different rates, starting on subcortical areas that
allow arousal, followed by the maturation of regions participating in motor and sensory functions. After that,
circuits involved in motor coordination, spatial orientation, and language develop. Similarly, the development of
integrative and multimodal functions associated with tertiary sensorial areas gives rise to abilities such as reading,
writing, and arithmetic skills. The prefrontal cortex is the last area to mature: it participates in executive functions
1
Laboratorio de Neuropsicología y Neurolingüística, Instituto de Neurociencias, Universidad de Guadalajara,
Guadalajara, México. 2Laboratorio de Plasticidad Cortical y Aprendizaje Perceptual, Instituto de Neurociencias,
Universidad de Guadalajara, Guadalajara, Jalisco, México. 3Departamento de Neurociencias, Centro Universitario
de Ciencias de la Salud, Universidad de Guadalajara, Guadalajara, Jalisco, México. *email: mariomtv@
hotmail.com; ematute@cencar.udg.mx
Scientific Reports | (2021) 11:6533 | https://doi.org/10.1038/s41598-021-85891-2 1
Vol.:(0123456789)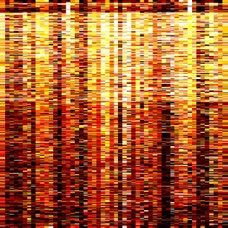
www.nature.com/scientificreports/
necessary for goal-directed b ehavior10. Consequently, some impairments in any of these functions/regions are
associated with a range of disorders and severities according to the neurodevelopmental phase when they ocurr.
Trying to understand the brain as a complex system gives rise to novel questions. How do cognitive func-
tions change and interact over developmental time, and what are the internal and external elements that affect
such cognitive development? Consider, for instance, the development of language. Here, the maturation of brain
areas involved in motor control (secondary motor areas) allows the production of phonemes. Isolated words and
sentences are then produced in coordination with secondary motor areas. These abilities are the precursors of
storytelling, which requires a complex interaction between memory capacity and the presence of semantic and
morphosyntactic components11. Reading and writing appear around 6 years of age as multimodal functions,
where complex metalinguistic processes arise. Finally, the maturation of the prefrontal lobes unfolds as a multi-
stage process, with distinctive abilities improving in different ways and at different rates until reaching maturity
in adulthood12. This maturation process allows planning skills, working memory, self-reflexive processes (crucial
for written expression), argumentation, and critical thinking.
All in all, although the brain completes its development until adulthood, the neurodevelopmental processes
during childhood are markedly different across ages. For example, there is a high processing variability across
multiple neuropsychological domains in children below 6 years of age, particularly in executive functions. These
early developmental phases are highly relevant because they impact numerous functional areas, such as school
and social performance. Furthermore, the immaturity of neuropsychological functions in young children implies
that they can be vulnerable to cerebral insults. For all these reasons, it is crucial to characterize whether and how
relevant neuropsychological functions change during the early stages of child development.
Here, we explored how the neuropsychological profile of typical monolingual Spanish-speaking Latin-Amer-
ican preschoolers varied and consolidated with age. Our main aims were to: (1) track the neuropsychological
development in these preschoolers, (2) determine how domestic and educational factors were related to their
neuropsychological profiles, and (3) explore whether and how these abilities were organized and interrelated.
We employed a battery of 52 tests, grouped into five neuropsychological functions: receptive, expressive, atten-
tion/memory, processing, and executive ones. This battery was developed following the conceptual framework
of Lezak et al.5, and standardized for Spanish-speaking Latin-American c hildren13. Experienced psychologists
carried out testing, and the children were organized into seven age groups, ranging from 30 to 71 months of
age. Our analytic results revealed well-orchestrated changes across age groups that were influenced by educa-
tional and other socio-cultural variables. Interestingly, even though our participants were typical middle-class
preschoolers, they could be classified into two well-differentiated clusters. Our analysis also revealed that the
neuropsychological abilities conformed a network of well-interconnected nodes. Within this network, the tests
belonging to expressive, processing, and executive functions exhibited the highest interconnectedness. Our
results and methods serve to understand the development of neuropsychological functions and how individual
differences emerge; they may be useful for educational practices and interventions.
Results
Classification of Latin‑American children across neuropsychological functions. Typically,
examiners use neuropsychological tests (covering cognitive, linguistic, motor, and executive domains) to explore
discrete responses associated with particular functions. First, we wondered if such apparently discrete abilities
(responses) do not occur in isolation but, instead, they contribute to more complex skills. For this, we charac-
terized the distribution of neurocognitive abilities in Latin-American children from 30 to 71 months of age.
We applied a battery of 52 tests (Supplementary Table 1) covering receptive (8 tests), expressive (15), attention/
memory (9), processing (13), and executive functions (7), on a total of 643 typical children (Supplementary
Table 2). We merged the data from female and male children because there were no gender differences when
comparing their averaged scores (two-tailed Wilcoxon rank-sum test; P = 0.15). These tests’ normalized scores
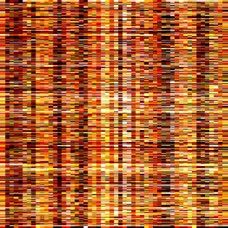
revealed a strong task-dependency, yet with a high heterogeneity across children (Fig. 1a). We thus wondered
how the scores obtained from the different tests were related to domains within the same and other neuropsy-
chological functions. Intuitively, one would expect similar scores among tests belonging to the same neuropsy-
chological function. We performed a correlation analysis across all tasks using the entire database and tested the
observed correlations’ significance. We did this by creating surrogate comparison data (n = 1000) by shuffling
each participant’s scores across the 52 tests. In Fig. 1b, we illustrate the cross-correlation matrix derived from
this analysis with significant relationships marked as colored squares and non-significant (n.s.) values appear-
ing as empty squares (i.e., P ≥ 0.05). This matrix reveals a quite heterogeneous structure with strong and weak
relationships among tests that belong to practically all functions (represented with different color bars to the left
and above the correlation matrix). Interestingly, tests from attention/memory functions (in orange) exhibited
smaller correlations than the rest of the tests (one-tailed Wilcoxon rank-sum test; P ≤ 0.027 for all cases). To
explore alternative relational schemes among tests, we re-organized the correlation matrix by sorting its columns
by the summed correlations across all tests (from highest to lowest; Fig. 1c). The resulting heterogeneous distri-
bution of functions (to which the sorted tests belonged) reveals intermingled functions for strongly correlated
tests (illustrated in the color bar on top of the correlation matrix).
Next, we wondered whether the high heterogeneity in the children’s scores across tasks could reflect particular
sub-groups of children with specific skills within the sampled population. We applied a nearest neighbor clas-
sification technique using the Euclidean distance as a measure for cluster center initialization. Using the Calinski-
Harabasz and the Davies-Bouldin criteria (Supplementary Fig. 1a–e), we found that the original data set could
be organized into two main clusters (C1 and C 2; Fig. 1d). Using the same optimization criteria, we found that
these two clusters could be further subdivided into two additional sub-clusters each (Fig. 1e and Supplementary
Fig. 1f,g). The two main clusters differed in that cluster 1 ( C1) was associated with ~ 47% lower average scores
Scientific Reports | (2021) 11:6533 | https://doi.org/10.1038/s41598-021-85891-2 2
Vol:.(1234567890)
www.nature.com/scientificreports/
a b c f g
Av. Score from Av. Score from Av. Score from
clusters C1 sub-clusters C2 sub-clusters
Tests Global corr. Global corr.
Participants (643) (Sorted by F) (Sorted by F) (Sorted by corr.) (Sorted by F) (Sorted by F) (Sorted by F)
1 1 1
C1,1 C1,2
(Sorted by F)
Av. Score
0.5 0.5 0.5
C1 C2 C2,1 C2,2
0 0 0
Tests Tests Tests 0 10 20 30 40 50 0 10 20 30 40 50 0 10 20 30 40 50
Av. Score Correlation Tests Tests Tests
0 1 n.s. 1
(Sorted by corr.) (Sorted by corr.) (Sorted by corr.)
1 1 1
Neuropsychological Functions
Av. Score
Receptive Attention and Memory Executive 0.5 0.5 0.5
Expressive Processing
0 0 0
0 10 20 30 40 50 0 10 20 30 40 50 0 10 20 30 40 50
Tests Tests Tests
d e h
Tests Tests Global Av. Score from clusters
(Sorted by F / Clusters ) (Sorted by F / Sub-clusters )
Excl. Cluster 1 Cluster 2 Clusters
1 m = 8.6x10
-3 1 1
C1
C1,1 (83)
(254)
C2
1
Participants
C1,2 (171)
Clusters
C2,1 (198) Av. Score 0.5 0.5 0.5
2 C1
m = 7.8x10
-3
C2 C2,2 (159)
(357)
0 0 0
Tests Tests 40 50 60 70 40 50 60 70 40 50 60 70
Av. Score Age (months) Age (months) Age (months)
0 1
Figure 1. Classifying Latin-American children’s performance across distinct tasks and neuropsychological
functions. (a) Scores from a battery of 52 neuropsychological tests performed on 643 Latin-American children.
Grouping of tests into receptive (walnut brown), expressive (mosaic blue), attention/memory (orange),
processing (flamingo pink), and executive (cloud cream yellow) functions (color bar on the bottom of the
heatmap). (b) Peak global cross-correlations across tasks sorted by functions or (c) by the summed correlations
across tasks for the entire data set. Filled pixels represent values that cannot be explained by chance (P < 0.05).
(d) Classification of children into two main clusters (C1 and C2). (e) Further partition of the two main clusters
into two sub-clusters each (C1,1, C1,2, C2,1, and C2,2). (f) Average scores ± S.E.M. for the groups of children from
the main clusters sorted by neuropsychological functions (top) or by the summed correlations (bottom). Gray
arrows point to three tests that exhibited average values below those expected if they followed the trend of
scores sorted by correlation (test #5: Left hand recognition; #7: Following oral instructions; #21: Naming body
parts). (g) Average scores from each sub-cluster sorted by neuropsychological functions and by the summed
correlations (same arrangement as in f). Shaded areas in panels F and G depict the regions covering 1.5 standard
deviations away from the mean of the population, which is shown as a grey dotted line. (h) Global scores
(i.e., the average of all tests) as a function of age for C1 and C2. Linear fits display similar slopes but different
intercepts for each cluster. Number of participants in parentheses.
across all tasks compared to cluster 2 (C2; scores C1: 34.15 ± 0.84%, n = 254; scores C2: 71.44 ± 0.57%, n = 357;
Kruskall–Wallis multi-comparison test with Bonferroni posthoc correction; P < 0.0001 for all tests; Fig. 1f). Prac-
tically all functions were similarly reduced in C 1 relative to C2 (i.e., they were scaled-down). Only three tests
exhibited average values below those expected if they followed the trend of scores sorted by correlation (Tests
#5: Left-hand recognition; #7: Following oral instructions; #21: Naming body parts; depicted with gray arrows in
Fig. 1f). We also found a similar pattern of distinctive average scores across all tests for the corresponding sub-
clusters (C1,1: 18.65 ± 1.10%, n = 83; C1,2: 41.68 ± 0.51%, n = 171; C2,1: 63.36 ± 0.38%, n = 198; C2,2: 81.49 ± 0.49%,
n = 159; KW test with Bonferroni posthoc correction; P < 0.0001; Fig. 1g). Suggesting a graded transition, the
Scientific Reports | (2021) 11:6533 | https://doi.org/10.1038/s41598-021-85891-2 3
Vol.:(0123456789)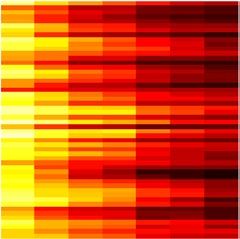
www.nature.com/scientificreports/
correlation in average scores across all these four classifications revealed stronger similarities between contigu-
ous clusters (not illustrated).
Finally, we searched for potential differences across ages in the neuropsychological functions between the
two main clusters. We plotted the average scores from all tests against the age of the children from each group.
Interestingly, these two clusters had different intercepts (b) but similar slopes (m; C1: m = (8.6 ± 0.5) × 10–3,
b = (1.2 ± 0.5) × 10–3; P < 0.001; C2: m = (7.8 ± 0.4) × 10–3, b = (274.6 ± 2.4) × 10–3; Kruskall–Wallis test with Bon-
ferroni posthoc correction; P < 0.001; Fig. 1h). This result suggests that both clusters exhibited similar improve-
ments with age (as inferred by the slopes of these regressions). Still, each of them was associated with a different
performance level. The different intercepts could be explained by external (v.gr., environmental) or internal (v.
gr., genetic) conditions related to each group.
Our overall sample of Latin-American children was composed of 76.92% Mexican (n = 470), 14.24% Colom-
bian (n = 87), and 8.84% Guatemalan (n = 54) children (Supplementary Fig. 1h). The difference in the number of
participants from each country creates the potential concern that the optimal number of clusters that we found
for the entire dataset could be sensitive to educational or cultural differences among these nationalities. We
adjusted and compared the linear regressions to the children’s global performance by their nationalities (i.e., the
average score from all the tests/participants) as a function of age (Supplementary Fig. 1i). We made size-matched
linear regressions from sub-sampled groups of children (20–90% with 10% increments, 1000 iterations/category)
and found relevant differences in the slopes and intercepts among groups (Supplementary Fig. 1j). More spe-
cifically, Mexican children displayed slightly faster increases in their neuropsychological functions (i.e., higher
slope) than Colombian and Guatemalan children, yet, the Colombian children had a higher intercept than the
other two groups (Mexico: m = (1.62 ± 0.05) × 10–2, b = -(22.42 ± 2.77) × 10–2; Colombia: m = (1.43 ± 0.14) × 10–2,
b = -(7.88 ± 6.54) × 10–2; Guatemala: m = (1.38 ± 0.20) × 10–2, b = -(20.67 ± 11.79) × 10–2; Kruskall–Wallis multi-
comparison test with Bonferroni posthoc correction; P < 0.0001, for all cases; Supplementary Fig. 1k). We con-
firmed these differences by re-calculating the slopes and intercepts from size-matched groups (Supplementary
Fig. 1l). Given these results, we then tested whether nationality differences could compromise the entire dataset’s
sub-clustering structure. We repeated the clustering analysis on the Mexican children only and found a similar
classification structure as the one observed for the whole population (of Latin-American children). Namely, on
an initial partition, we confirmed the existence of two main clusters, which could be further divided into two
sub-clusters each (using Calinski–Harabasz and the Davies–Bouldin criteria; Supplementary Fig. 1m,n). These
results confirm the notion that the scores obtained from Latin-American children solving our 52 tests can be
organized into four sub-clusters, which exhibit a graded transition in performance across tests.
Development of neuropsychological functions. Neuropsychological functions develop from infancy
into adulthood14,15. We wondered if the children’s scores for all tests improved similarly with age since we consid-
ered high performance as an indirect developmental measure. We used a colormap to illustrate the age-related
increases across neuropsychological functions and found distinctive neurodevelopmental profiles (colormaps in
Fig. 2a). Since the group averaged scores from our tests presented such a strong dependency on age (lower panel
in Fig. 2a), we wondered whether the correlation structure across all tasks could involve a strong neurodevel-
opmental control. For this, we computed the correlation matrices across tasks from children belonging to each
of the seven age groups (ranges: 30–35, 36–41, 42–47, 48–53, 54–59, 60–65, and 66–71 months), and confirmed
that the overall correlations across tests increased and became more selective with age (Repeated Measures
One-Way ANOVA test, F = 29.32, P = 0.001; Fig. 2b, Supplementary Fig. 2a). To get an overall estimation of how
these correlations varied with age, we calculated the average correlation across all tests as a function of the age
group for members from clusters C1 (middle panel of Fig. 2b) and C2 (lower panel of Fig. 2b). Tests correlations
increased with age for both groups (RM One-Way ANOVA test, C1: F = 52,207.75, P < 0.001; C2: F = 33,168.66,
P < 0.001), yet children belonging to C 2 had, on average, a ~ 2.5 higher performance than children from C 1
(middle and lower panels in Fig. 2b; C1: m = 1.6 ± 0.1, b = 5.04 ± 0.01; C2: m = 4.2 ± 0.1, b = − 1.92 ± 0.1; KW-test,
P < 0.005 for slopes and intercepts).
To estimate if the within-group differences decreased with age (v.gr. as one would expect for correlations
reaching an asymptote), we calculated the first derivative of the average correlation by taking the difference
between average correlations across matrices from contiguous age groups. We found no clear reduction in these
numbers through age groups (RM One-Way ANOVA test, F = 0.47, P ≥ 0.05, for both cases; Fig. 2c and Supple-
mentary Fig. 2d), suggesting an un-finished developmental process. These analyses reveal that children from C2
exhibited a higher increase in their average correlation profile than children from C 1. Thus, in principle, children
from C2 could be maturing their cognitive functions earlier than children from C 1. Finally, we also explored if
the cluster centroids (and/or the difference between them) varied between age groups. We used a colormap to
illustrate the values associated with the cluster centroids. We found, as expected, higher average scores in older
age groups (Supplementary Fig. 3a,b). However, the absolute difference between cluster centroids revealed wide-
spread effects across neuropsychological functions with no evident age-related change (Supplementary Fig. 3c).
This result is consistent with the fact that both groups exhibited similar changes in their neuropsychological
functions through age (Fig. 1h).
Domestic and educational factors linked to neuropsychological classification. Biological (v.gr.
weeks of gestation, birth weight, head circumference16,17, and environmental (v.gr. Family background, marital
histories, socio-economical levels12,18–20) factors influence children’s neuropsychological development. Since we
controlled prenatal factors in our sample (v.gr. weeks of gestation; see “Methods”), we next explored whether and
how some domestic (household as well as parents age, and educational level) and educational (type of school)
factors were related to the observed neuropsychological functions and corresponding classification schemes of
Scientific Reports | (2021) 11:6533 | https://doi.org/10.1038/s41598-021-85891-2 4
Vol:.(1234567890)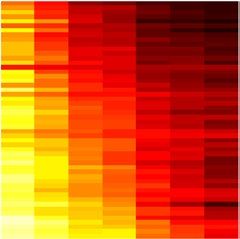
www.nature.com/scientificreports/
a Av. Score of
b c
all participants All participants All participants
60 20
m = 6.1 m = -1.0
Av. Correlation
Av. Diff. Corr.
(611)
(Sorted by F)
40 10
20 0
0 -10
Age group 1 2 3 4 5 6 7 1 2 3 4 5 6
Age group Diff. Age group
Cluster 1 Cluster 1
60 20
m = 1.6 m = 0.7
Av. Correlation
(Sorted by corr.)
Av. Diff. Corr.
(254)
40 10
20 0
0 -10
Age group 1 2 3 4 5 6 7 1 2 3 4 5 6
Av. Score Age group Diff. Age group
0 1
Cluster 2 Cluster 2
60 20
m = 4.2 m = -0.7
0.8
Av. Correlation
Av. Diff. Corr.
(357)
Av. Score
40 10
0.6
0.4 20 0
0.2 0 -10
1 2 3 4 5 6 7 1 2 3 4 5 6 7 1 2 3 4 5 6
Age group Age group Diff. Age group
Neuropsychological Functions
Receptive Attention and Memory Executive
Expressive Processing
Figure 2. Differential developmental control of neuropsychological functions between identified clusters.
(a) Average scores as a function of age group sorted by functions (top) or by increasing correlations (middle).
The lower panel shows the average scores from all 52 tests. Averaged (b) and averaged differences (among
contiguous age groups; c) in cross-correlations for all tests as a function of the age group for all participants
(top), and participants from cluster 1 (center), and cluster 2 (bottom). Red lines depict linear fits with
corresponding slopes displayed on the top of each panel. Number of participants in parentheses.
the children. We calculated the average normalized scores (i.e., the average of the scores obtained from the 52
tests) associated with cluster 1 ( C1, in gray) and cluster 2 ( C2, in black) from children belonging to the different
age groups (ranges: 30–35, 36–41, 42–47, 48–53, 54–59, 60–65 and 66–71 months; Fig. 3a). We then calculated
the probability that the children belonging to these two clusters attended either a public, private or no school at
all (Fig. 3b). Notably, children belonging to C2 (i.e., w. higher scores) were ~ 120% (all ages) more prevalent in
private schools than children from C1 (i.e., w. lower scores).
Next, we investigated if household conditions, like children living with both parents, mother only, or with
mother and stepfather, influenced their classification into their respective clusters (Fig. 3c). Children from C2
were ~ 43% more likely than those from C1 to belong to a family with both parents. Similarly, we found that
the average age of the parents (Fig. 3d) and their average educational level (Fig. 3e) influenced the classification
groups, where older parents with a higher educational level were associated with C 2 (Supplementary Tables 2
and 3).
At first sight, the fact that children attending private schools were more likely to belong to C 2 could be
explained by differences in the education programs provided by private vs. public schools. However, such a rela-
tionship could also be a consequence of other domestic factors such as parents’ age or their educational level. We
explored our database and found that parents of children attending private schools were older, on average, than
those of children attending a public or no school (age father: F = 50.75, P < 0.001; age mother: F = 58.51, P < 0.001;
Fig. 3f). Similarly, the average educational level of the parents of children attending private schools was higher
than that of parents of children attending public or no school (years of schooling father: F = 119.85, P < 0.001;
years of schooling mother: F = 112.37, P < 0.001; Fig. 3g). Therefore, the score differences in children attending
public and private schools depended on factors existing outside the s chool21. Additionally, using a multivariable
linear regression model, we explored how specific predictors ( Pr1: type of school, P r2: household, P
r3: father’s
age, Pr4: mother’s age, Pr5: educational level of the father, P
r6: educational level of the mother) explained: (1) the
global scores of the children (left panel in Fig. 3h), and (2) the classification clusters of the children (right panel
in Fig. 3h). In Fig. 3h, significant coefficients for predictors (Pr1–Pr6) compared against surrogates (obtained
Scientific Reports | (2021) 11:6533 | https://doi.org/10.1038/s41598-021-85891-2 5
Vol.:(0123456789)www.nature.com/scientificreports/
a b c d e f
Global Type of School Household Parents age Educational level
Av. Score of parents Parents age
F M
g Educational level
of parentes
F M
Age group
h Multivariable
linear regression
All
β
ages
Probabilities
Figure 3. Influence of domestic and educational factors on cluster classification. (a) Global scores (i.e.,
the average from all tests) for the participants from cluster 1 (C1, in gray) and cluster 2 (C2, in black). (b)
Probabilities that children from C1 and C2 went to public, private, or no-school (Predictor 1: Pr1). (c)
Probabilities that children from C 1 and C2 lived with both parents, only with the mother or with mother and
stepfather (Pr2). (d) Average age of fathers (left, Pr3) and mothers (right, Pr4) of children from C1 and C
2. (e)
Average years of schooling of fathers (left, P r5) and mothers (right, Pr6) of children belonging to C1 and C2.
Average age (f) and average years of schooling (g) of fathers (left) and mothers (right) of children attending
public, private, or no-school. (h) Multivariate regression model exploring how the six predictors ( Pr1–6)
influenced cluster assignment (significant regression weights marked with filled dots).
by permuting the predictors) are illustrated with filled dots. These results reveal that type of school, household,
parents’ educational level, and parents’ age influence the scores and classification schemes of the children’s
neuropsychological functions.
Integration of neuropsychological functions through development. Colormaps illustrating cor-
relation matrices or neuropsychological functions help establish paired comparisons across tests (v.gr., Fig. 1b).
However, tests that concentrate high correlations cannot be easily identified using these graphs. Therefore, we
implemented a ‘network representation’ where we distributed the 52 tests as discrete nodes along a circumfer-
ence, with the lines’ thickness and colors connecting these dots representing the cross-correlation level between
each pair of nodes (tests). These plots were made with data from each age group (Fig. 4a) and the entire dataset,
including all ages (Fig. 4b; see Supplementary Table 1). Besides, we implemented centrality measures from net-
work theory22 to explore each test’s relevance within this network of functions. Many of these metrics are based
on the idea that well-interconnected nodes are likely to facilitate global, intermodular integration. We thus cal-
culated the betweenness centrality (BC) of each node to identify relevant connections with other tests within the
battery. We represented the BC of the tests as the area of the circular nodes in Fig. 4a,b. Interestingly, the ten tests
with the highest BC exhibited a faster increase across age groups than the average of ten tests with the lowest BC
(dotted line in Fig. 4c). This result suggests that expressive and receptive functions establish earlier their founda-
Scientific Reports | (2021) 11:6533 | https://doi.org/10.1038/s41598-021-85891-2 6
Vol:.(1234567890)www.nature.com/scientificreports/
tions with abilities that promote the development of other skills. Interestingly, it is after 4 years of age that more
complex abilities, such as math skills and cognitive flexibility, show complex connections.
The BC of the tests exhibited distinctive values (Fig. 5a) and consolidated across age groups (inset in Fig. 5b).
To get an overview of the centrality for all ages, we calculated the summed BC for all tests across all age groups
(Σ(BC)) and plotted the resulting data in linear (Fig. 5b) and logarithmic (Fig. 5c) scales. Using increasing
thresholds given by different percentiles from the summed BC distribution, we created five groups of tests that
exhibited increasing centrality values for all ages (Fig. 5c). Lower thresholds implied a more flexible rule with
more tests having an equal or lower BC than the thresholded value (Fig. 5c). As a reference, the ten tests with
the highest BC measures are listed in Fig. 4c.
Biometric systems serve to identify individuals by using physiological and behavioral predictors. We hypoth-
esized that scores from tests with high BC could be employed to identify the c hildren23. We used the five groups
of tests with different BC levels (in scales of gray) as predictors and combined them with supervised machine
learning algorithms to predict the cluster to which the children belonged (Fig. 5d). We first cross-validated a
k-nearest neighbor (KNN) classifier. We found that the classification improved with the number of tests employed
as predictors and that ~ 20 neighbors optimized the classification procedure (black arrow in Fig. 5d). Next, we
measured the performance of the trained classifier in identifying children from each cluster. Notably, identifica-
tion of the best performers (i.e., children belonging to C 2) was more efficient and required fewer tests than for
children from C1 (right panel in Fig. 5e; KW-test, P < 0.0001 for all cases). Also, as expected, adding tests to the
battery of predictors increased the classifier’s prediction capacity when dealing with children from both C 1 and
C2 (right panel in Fig. 5e; RM One-Way ANOVA test, P ≥ 0.001 for both cases).
Next, we used the same 20-neighbor KNN-classifier to challenge the prediction of the children’s belonging to
one of the four sub-clusters. We found similar tendencies as before: higher predictiveness required using fewer
tests for higher performers (Fig. 5f). We confirmed these observations when applying the same KNN-classifier
to Mexican children only (Fig. 5g). Altogether, these results illustrate how neuropsychological scores served to
identify the children, where higher scores led to a more accurate classification. Therefore, neuropsychological
tests’ scores can be used as behavioral ‘fingerprints’ to identify participants with a high level of certainty.
Discussion
We explored age-related changes across neuropsychological functions from a large sample of young Latin-
American children in the age range of 2.5–6 years (30–71 months of age). We used a battery of 52 standardized
tests, designed for Spanish-speaking children13, to explore the developmental profile of receptive, expressive,
attention/memory, processing, and executive functions.
We identified age-related gains in scores across all tasks, which reflect an organized development of neu-
ropsychological functions, as has been r eported4,24–28. We applied a cluster analysis to our data and identified two
main clusters (C1 and C 2) associated with a specific configuration that suggests that not all functions developed
equally in all children. Indeed, our results showed distinctive developmental trajectories of neuropsychological
functions in preschoolers, as others have s uggested3. Although similar age-related increases were observed for
both cluster groups (i.e., similar slopes), C1 lagged behind C2. Importantly, C1 was not composed of learning
disabled children since we controlled biological factors related to neurodevelopmental disorders, and it involved
a large proportion of the entire sample (42%). However, C 1 children exhibited weaker performance in all tests,
and particularly lower in left-hand recognition, instructions, and naming tests. These tests involve inter-modal
information transfer, receptive language, and vocabulary, respectively. Differences in right/left hand recogni-
tion tests are usually linked to functional variabilities between right/left cerebral hemispheres. In sum, such
cluster differences might be relevant to establish criteria to identify children with low performance in multiple
neuropsychological domains and a potential developmental delay.
Nowadays, accurate assessment of neuropsychological functions in children requires collecting cognitive,
linguistic, motor, executive, emotional, and behavioral information together with the social environment, school,
and household conditions. Increasing evidence suggests that environmental factors influence neuropsychologi-
cal functions. This influence is evident when considering children from unstable families and with disruptive
family events29, and early abilities can predict later educational a chievements30–33. Thus, human development
has to be studied within a c ontext34, even if it’s considered a ‘homogeneous’ one. Because young children tend
to spend more time with their families, we explored such variables’ influence on the preschoolers’ neuropsy-
chological development. In Latin-America, preschool attendance is not yet universal, and most of the children
attend public preschools. Therefore, to reflect the characteristics of preschool attendance in a Spanish-language
ambiance, we evaluated more children from public than from private schools, in addition to a small percentage
of children that did not attend any preschool/day-care. The family composition and parents’ educational level
exhibited a wide dispersion. We confirmed that the children’s scores and classification clusters were sensitive to
these environmental variables, particularly those related to parents’ e ducation5,35–37. Children belonging to the
high-performance cluster (C2) were more prevalent in private schools than children from the other cluster (C1),
and they were also more likely to belong to a family with both parents present. Public schools in Latin-America
tend to have more children per classroom, with a single teacher giving classes from different subjects and a lim-
ited budget to acquire teaching material. However, both educational systems do also have plenty of similarities.
For example, both types of schools have mentoring schemes that adjust the educational programs to the child’s
capacities. Similarly, they both inform and orient the parents regarding the child’s special needs and provide a
psychoeducational assessment. Public schools also have external education units where children with special
needs are partially attended.
At first glance, one could be prone to think that the education provided by private schools in Latin American
countries stimulates cognitive development to a higher degree than public schools do. Nonetheless, given that
Scientific Reports | (2021) 11:6533 | https://doi.org/10.1038/s41598-021-85891-2 7
Vol.:(0123456789)www.nature.com/scientificreports/
a b
Betweenness centrality
10
Age group: All ages
7.5
51 52 1 2
52 1 2 3 4 52 1 2 3 4
50 51 50 51 3 4
1 48
49 5
6
7
5 48
49 5
6
7 50 5
5
46
47 8 46
47 8 49 6 2.5
9 9 48
45
10
45
10 7
44 44 47 0
43 11 43 11
8
42 12 42 12 46
13 13 9
41
14
41
14 45
40
15
40
15 44 10
39 39
16 16
38
17
38
17 43 11
37 37
18 18
36
35 19
36
35 19 42 12
34 20 34 20
33 21 33 21 13
32
3130 23
22 32
3130 23
22 41
24 24
29 28 27 26 25 29 28 27 26 25 14
40
15
39
50 51
52 1 2 3 4
50 51
52 1 2 3 4 16
2 48
49 5
6 6 48
49 5
6 38
47 7 47 7
17
46 8
9
46 8
9 37
45
44 10
45
44 10
36 18
43 11 43 11
42 12 42 12 35 19 1
41 13 41 13
34 20
40 14 40 14
21
Correlation
39 15 39 15 33
38 16 38 16
32 22
37 17 37 17
31 23
36 18 36 18 30 29 24
35
20
19 35
20
19
28 27 26 25
34 34
33 21 33 21 n.s.
32 22 32 22
23 23
centrality (BC) c
3130 24 3130 24 Betweenness 10
29 28 27 26 25 29 28 27 26 25
7.5
5
2.5 1 38
52 1 2 3 4 52 1 2 3 4 39
50 51 50 51 0
3 48
49 5
6 7 48
49 5
6 14 8
47 7 47 7 0.9 19 2
8 8
46
9
46
9 46 4
45 45 28
44 10 44 10
43 11 43 11 0.8
42 12 42 12 20
41 13 41 13
40 14 40 14 0.7
39 15 39 15
38 16 38 16
37 17 37 17 0.6
Av. Score
36 18 36 18 Av. 10 tests
35 19 35 19
20 20 with lowest BC
34
33 21
34
33 21
1
0.5
Correlation
32 22 32 22
3130 23 3130 23
24 24
29 28 27 26 25 29 28 27 26 25
0.4
Tests with highest BC
n.s. 2 Auditory perception (Object-sound)
50 51
52 1 2 3 4 0.3 4 Tactile perception (Right hand recognition)
4 48
49 5
6
7
8 Receptive Language (Designation)
Ideomotor praxis (Limb)
47 8
14
46
9 Neuropsychological 0.2 19 Expressive language (Personal information)
45 Expressive language (Play)
10 20
44
43 11 Functions 28 Memory (Differed visual sequence)
42 12 0.1 38 Mathematical skills (Counting)
13 39 Mathematical skills (Subitization)
41
14 Receptive 46 Cognitive flexibility (Interference)
40
15 0
39 Expressive
38 16 1 2 3 4 5 6 7
17
37
36 18 F Attention and Memory 32.01 38.26 43.87 50.12 55.74 62.27 68.05
35 19 (84) (78) (82) (83) (73) (70) (66)
34 20 Processing
33
32 22
21 Age group
3130 24
23 Executive Av. Age in months
29 28 27 26 25
(n)
Figure 4. Consolidation/integration of critical neuropsychological functions through development.
Network visualization of the cross-correlations across the 52 neuropsychological tasks using the scores from
children belonging to each age group (a) or from all ages (b). Tasks appear as nodes radially arranged along a
circumference covering the following domains: receptive (walnut brown), expressive (mosaic blue), attention/
memory (orange), processing (flamingo pink), and executive (cloud cream-yellow) functions. The colors of the
lines and their thickness represent the cross-correlation between pairs of tasks, whereas the area of each node is
proportional to the betweenness centrality (BC) for each task. (c) Developmental profile for the ten tasks with
the highest BC compared against the average of ten tasks with the lowest BC (dotted line).
many of our sample children just started school, this assumption might not be valid. We found that children
from private schools were more likely to belong to a family with both parents present. Also, their parents had a
higher level of education and were older than those of children attending public schools. Thus, distinctive familial
contexts were associated with low- (C1) and high- (C2) performance clusters in several ways: family composition
and parents’ age and education level.
erformance3,21,38,39.
It has been reported that parent’s level of education co-varies with the children’s cognitive p
In general, parents with high educational profiles tend to create enriched environments for their c hildren40–42,
and use richer v ocabulary43,44, leading to faster language development, higher school attendance, and better
performance in cognitive tests45–47. Other environmental factors might also contribute to children’s develop-
ment, such as financial resources, parental styles, the system of values, among others48. Our results suggest that
Scientific Reports | (2021) 11:6533 | https://doi.org/10.1038/s41598-021-85891-2 8
Vol:.(1234567890)www.nature.com/scientificreports/
a Betweenness b m = 1.0
centrality (BC) 26
Av. BC
Group
16
7 14
1200 6
6 1 4 7
Age group
5 Age group
BC
∑ (BC)
800
4 10 2 38
3 48 19 39
400 20 28 46
2 47
1 48
0 0
1 10 20 30 40 50 1 10 20 30 40 50
Tests Tests
Neuropsychological Functions
Receptive Attention and Memory Executive
Expressive Processing
c d Nearest Neighbor Classifier
(All participants)
Threshold
Cross-validation loss (%)
4 (pctl) 14
Pctl (%)
80%
log ( ∑ (BC) )
2
62.5%
0 8 10
45% All tests 27.5
-2 45
27.5% 62.5
10% 80
-4 2
1 10 20 30 40 50 0 20 50 100 150 200
Tests Amount of Neighbors
e 100 100
C2 C2
% Correct
% Correct
92 92
C1 C1
84 84
f
100 100 C2,2
C2,2
% Correct
C1,2
% Correct
80 C1,2 80
C1,1
C2,1 C1,1 All participants
C2,1 (611)
60 60
g C2,2 C2,2
100 100
C1,2
% Correct
% Correct
C1,2
75 75 C1,1
C1,1 Mexican
participants
C2,1 C2,1 (470)
50 50
0 20 40 60 80 10 20 30 40 50
Pctl of BC criterion (%) Amount of tests
Figure 5. Supervised classification with centrality measures. (a) Colormap illustrating the betweenness
centrality (BC) for each task as a function of age group. Binary BC was computed by thresholding each
normalized correlation matrix against 0.5. Colorbar on the right. Summed BC (across ages) for the different
tests in linear (b) and logarithmic (c) scales, respectively. (d) Cross-validation loss of a k-nearest neighbor
(KNN) classifier as a function of the number of neighbors. Predictors consisted of the different tests associated
with the different threshold values for BC. Optimal number of neighbors is around 20. (e–g) Performance of the
KNN classifier as a function of the %BC criterion (left column), and as a function of the number of tests that
correspond to that BC criterion (right column). The panels display the performance in classifying the children
from the two main clusters for the entire dataset (e), the four sub-clusters for the entire group (f), and the four
sub-clusters for the Mexican children only (g). Number of participants in parentheses.
Scientific Reports | (2021) 11:6533 | https://doi.org/10.1038/s41598-021-85891-2 9
Vol.:(0123456789)www.nature.com/scientificreports/
the higher number of C 2 children in private schools derives from more stable families, consolidated over more
years, where parents have better jobs and, therefore, exhibit a higher socio-economical status, allowing them
to afford a private education for their children. The family/school ambiance probably improves the children’s
development. Indeed, children’s interaction with a variety of factors that promote or inhibit neuropsychological
development starts well before they begin s chool21.
We found a general increase in performance over time as the children matured. Many of these improve-
ments could be associated with a response to repeated experience and learning49. However, we found that not
all functions developed at the same time. To quantify the importance of individual ‘network nodes’ during this
process, we implemented a developmental correlation analysis that included centrality measures22. We found
that tests with the highest betweenness-centrality (BC) values were similar for all age groups and belonged to
the five neuropsychological functions. The ten tests with the highest BC measures involved language (tests 8,
19, 20), auditory (test 2) and haptic (test 4) perception, praxis (test 14), visual memory (test 28), mathematical
skills (tests 38, 39), and cognitive flexibility (test 46). In contrast, the ten tests with the lowest BC values did not
involve processing and executive functions.
Strong correlation among tests might reflect that they share common underlying input variables. However,
the lack of such correlations may not necessarily reflect independence between neuropsychological functions3.
The interdependence among all these abilities is relevant because basic-level deficits (e.g., attention) could affect
and limit the emergence of other abilities (e.g., language). Indeed, neuropsychological functions’ development
depends on frontal functioning orchestrated with other interacting systems’ maturation, including attention,
memory, language, and e motions12. Our results show heterogeneous correlations among tasks, supporting a
‘multidimensional’ notion for neuropsychological functions. They also suggest that abilities with high central-
ity could help establish the foundations for other skills to emerge. Alternatively: high centrality abilities could
require many other functions to consolidate. Both perspectives imply that brain regions interact and facilitate
functional integration of more advanced skills.
Many researchers suggest that a sequence in the mastery of skills required for successful development through
childhood, coinciding with the maturation of the cerebral cortex4. For example, previous works have shown
how inhibitory control’s development precedes maturation of other more elaborate functions, such as selective
attention3. Our analysis revealed that, although functions were interrelated, their distinctive developmental
trajectories were well separated already from the youngest age groups3. More (cumulative) changes probably
occur during subsequent years. Some studies suggest a progression of executive skills in which proficiency is
still not achieved by 12 years of a ge50,51.
Neuropsychological functions are crucial to adjust and adapt to changing environmental demands. Delays
in neuropsychological functions’ maturation can affect how children interact with the environment, leading to
other problems in cognitive, academic, and social dimensions4,52. In this study, we controlled some aspects of the
biological background, excluding from our sample children with genetic aberrations and early CNS insults that
would skew their development. Still, we found clear distinctive developmental trajectories linked to domestic
and educational factors. This finding supports the idea that the environment shapes the way internal (genetic)
variables are expressed. Prenatal and postnatal experiences determined the child’s development rendering a wide
range of neuropsychological profiles evident as early as 30 months of age. Our approach highlights the impor-
tance of tracking developmental trajectories with an apparent heterogeneity across Latin-American countries.
Dynamic variations in the child-environment dyad give rise to distinctive phenotypes. Neurodevelopmental
disorders tend to originate from basic-level deficits that have ‘cascading’ effects on other domains of the develop-
ing system, including cognition, executive functions, language, social functions, motor functions, and behavior
control. Several diagnoses fall within these categories, including learning and intellectual disabilities, atten-
tion deficit hyperactivity disorder (ADHD), and communication disorders. Our results highlight the fact that
identification and clasiffication of the children with low scores requieres a comprehensive battery of tests. Such
instruments enable reliable diagnostics. Thus, an exciting area for future research will explore the implications
of the deficits and developmental delays of neuropsychological functions associated with common neurodevel-
opmental disorders53. It will be crucial to describe the differences at multiple levels (genetic, neural, cognitive,
environmental) of typically developing children and children with developmental delays and how these differ-
ences increase/decrease over t ime1.
Classification algorithms using large multidimensional biological datasets can be used for prognosis (pre-
dicting risk from neuropsychological markers), diagnosis, and therapeutic intervention. These methods can
be useful for identifying low performing children and then testing the effectiveness of interventions. Proper
classification would provide schools information about children’s development and might help to diagnose
possible neuropsychological disorders. Moreover, classification schemes could guide patient care and treatment
of neurodevelopmental disorders, or brain-injured children with cognitive, linguistic, motor, executive, and
behavioral therapies based on neuropsychological knowledge. In this context, one of our interests is to provide
Latin-American schools, clinicians, and scientists with specific data to guide them when assessing preschoolers’
development.
A common critique of neuropsychological tests is that their scores are imperfect indicators of latent variables.
As mentioned before, neuropsychological functions are complex and multidimensional constructs and, therefore,
interpretation of test scores is difficult to make3. Furthermore, the quantification of neuropsychological functions
in children is more challenging than in adults. First, assessing these functions only constitutes a snapshot at a
particular time. Second, the tests are limited and may not be sensitive to more subtle developmental changes.
Another limitation of our work is that we did not perform a longitudinal study, meaning that we did not map the
developmental trajectories for individual children. Longitudinal studies of children could provide information
regarding the intra-individual rate and extent of development of such functions. Such approximations could
Scientific Reports | (2021) 11:6533 | https://doi.org/10.1038/s41598-021-85891-2 10
Vol:.(1234567890)www.nature.com/scientificreports/
help classify individual differences. Furthermore, it would also be crucial to explore the degree of plasticity in
the neural networks that mediate neuropsychological functions.
Instead of considering a single compromised neuropsychological function, this work explored and described
a broader neuropsychological profile of preschoolers. Using clustering analysis at multiple levels, we assessed the
children’s performance for each task, the developmental stage of each function, and the interrelations between
neuropsychological domains. We also explored the interplay between cognition and experience. Our results
highlight the fact that not only biological and environmental factors drive and support cognitive development:
there is a third factor related to how children build their knowledge, namely, how their own cognitive charac-
teristics enable them to process the stimuli provided by their environment.
Methods
Participants. Data acquisition consisted of applying a Neuropsychological battery of tests (Supplemen-
tary Table 1) on a total of 643 typical (born at ≥ 37 weeks of gestation; birth weight between 2500 and 4000 g;
no reports of prenatal, perinatal, or postnatal complications, or TBI, without a neurodevelopmental disorder
diagnostic) Latin-American children (315 boys, 328 girls) ranging from 30 to 71 months of age. The database
involved scores from 473 Mexican, 115 Colombian, and 55 Guatemalan children with similar socioeconomic
backgrounds.
Tests. The evaluation instruments were based on procedures developed in cognitive neuroscience and were
standardized for Spanish-speaking preschoolers13. The 52 subtests belong to twenty domains grouped into five
classical cognitive f unctions5,54: (1) receptive functions (domains: visual, auditory, haptic perception; they involve
the processing of sensory information and receptive language), (2) expressive functions (domains: fine motor,
ideomotor praxis, constructional abilities, graphic skills, gross motor, and expressive language), (3) attention/
memory functions (domains: coding, delayed recall, attention), (4) processing functions (domains: reasoning,
math, and pre-reading skills), and (5) executive functions (domains: cognitive flexibility/shifting, self regulation
working memory and theory of mind). We used non-digital, manipulative material (pencil, paper, objects like
dolls, cars, balls, among others; see Supplementary Table 1 for a detailed description of each test). These chil-
dren were subdivided into seven well-balanced age groups, with the following number of children per group:
30–35 months: n = 98 (54 boys, 46 girls); 36–41 months: n = 97 (46 boys, 51 girls); 42–47 months: n = 102 (50
boys, 52 girls); 48–53 months: n = 101 (48 boys, 53 girls); 54–59 months: n = 87 (42 boys, 45 girls); 60–65 months:
n = 83 (41 boys, 42 girls); 66–71 months: n = 75 (36 boys, 39 girls). We used a parent’s clinical questionnaire,
adapted from the Evaluación Neuropsicológica Infantil55 to ascertain the presence of certain guidelines of typical
development: (a) born at term (≥ 37 weeks of gestation)56, (b) birth weight between 2500 and 4000 g (5.5–8.8
lbs.)57, and (c) no reports of prenatal, perinatal or postnatal complications or trauma that could affect nervous
system development54,58. No children had any diagnosis of neurological or psychiatric disorders. Trained psy-
chologists assessed the children and interviewed the parents in well-lit locations, free of distractions. Rooms
were provided by the day-care or preschool centers, but the children who were not in day-care or preschool
were evaluated in their homes. All testing was done individually, within a single week, and lasted approximately
2 h, divided into three sessions of 40–45 min. each. The order of tasks presentation was counterbalanced. We
explained the whole procedure, the use, and confidentiality of data, and provided feedback to the parents of the
children when requested. Examiners were sensitive to the regional differences in spoken Spanish when test-
ing children from different regions/countries59. Validation of these tests (consistency, reliability) was previously
demonstrated60–62. All children were monolingual native Spanish speakers. Agreements were reached with each
public and private institution to assess the children and collect the data; then, parents signed informed consent
before testing their children. The ethics committee of our institution approved the tests we performed in this
study, which followed the principles of the Helsinki Declaration (#ET062009-62; Instituto de Neurociencias,
Universidad de Guadalajara).
Analysis of neuropsychological functions. We normalized all the obtained scores to a scale 0–1 and
grouped them into the five neuropsychological functions described above (receptive, expressive, attention/mem-
ory, processing, and executive functions). Due to our balanced group numbers, we did not consider size differ-
ences across age g roups12. We calculated the peak global cross-correlations across tasks using the scores from
either the entire data set or from subjects belonging to each age group. We estimated the differences in average
correlation by subtracting the average correlation values from contiguous age groups.
Cluster analysis. We partitioned the original data set into a discrete number of clusters by using the squared
Euclidean distance and the k-means algorithm for cluster center initialization. We selected the optimal number
of clusters by using the Calinski–Harabasz and the Davies–Bouldin criteria. We measured the absolute Euclid-
ean distance between cluster centroids and the within-cluster sums of point-to-centroid distances as a function
of age. From the original dataset, the scores from 32 children were partial and, therefore, could not be classified
appropriately. We discarded these from subsequent analyses. We created cross-correlograms using data from
subjects belonging to each cluster for each age group, and the average correlation difference was calculated
between clusters for each age group. The average performance (and choice variance) from subjects belonging to
each cluster for all ages or the different age groups was calculated and sorted either by neuropsychological func-
tion or by the summed correlations across tests (for the entire dataset). The polynomial coefficients (i.e., slopes
and intercepts) from linear fits were obtained using a conventional least-squares algorithm.
We used measures from complex network analysis to characterize the relationship among t ests22. In par-
ticular, we used a sensitive measure of global connectivity termed betweenness centrality (BC;63,64. This binary
Scientific Reports | (2021) 11:6533 | https://doi.org/10.1038/s41598-021-85891-2 11
Vol.:(0123456789)You can also read