Effects of Symbol Component on the Identifying of Graphic Symbols from EEG for Young Children with and without Developmental Delays - MDPI
←
→
Page content transcription
If your browser does not render page correctly, please read the page content below
applied
           sciences
Article
Effects of Symbol Component on the Identifying of
Graphic Symbols from EEG for Young Children with
and without Developmental Delays
Chih-Hsiung Huang 1 and Pei-Jung Lin 2, *
 1   Department of Early Childhood Education, Nanhua University, Chiayi 622, Taiwan; hk633193@gmail.com
 2   Department of Computer Science and Information Engineering, Hungkuang University,
     Taichung 433, Taiwan
 *   Correspondence: lin.tomato@gmail.com; Tel.: +886-4-26318652

 Received: 3 February 2019; Accepted: 21 March 2019; Published: 26 March 2019

 Abstract: Using Augmentative and Alternative Communication (AAC) to improve the
 communication skills of children with disabilities is generally supported by both domestic and foreign
 scholars. Graphic symbols that represent individual words or phrases are often used in conjunction
 with AAC; however, research on the reading and identifying of AAC graphic symbols is scant.
 Therefore, this study used electroencephalogram (EEG) to investigate the success rates of identifying
 AAC graphic symbols and brainwave changes of young children with and without developmental
 delays. The results revealed that the number of symbol components affected participants’ success
 rates of identifying AAC graphic symbols. The EEG Attention Index between the children with
 and without developmental delays varied during the test. By contrast, the EEG Relaxation Index
 exhibited no difference between the children with and without developmental delays. When the
 participants viewed the single-component animations, the children without developmental delays
 had a significantly higher Relaxation Index than those with developmental delays did. According
 to cognitive load theory, the children with developmental delays and low cognitive capacities may
 feel stressed.

 Keywords: Augmentative and Alternative Communication (AAC); picture communication symbols
 (PCS); symbol learning; developmental delays; electroencephalogram (EEG) technology

1. Introduction
      During the last 20 years, a wide variety of evidence has indicated that augmentative
and alternative communication (AAC) can improve the communication skills of children with
disabilities [1–3]. Mukhopadhyay & Nwaogu, [4] stated that AAC exhibits potential advantages to
improve language, literacy, and communication skills even for nonspeaking children with intellectual
disabilities and is imperative to their learning and communicative competence. Most researchers in
AAC studies have employed graphic symbols as vocabulary items to improve the communication
skills of children with disabilities; these children have been taught how to express their needs and
interact with others through graphic symbols [5–9]. Graphic symbols are considered as the techniques
for enhancing efficiency to communicate and primary vocabulary for children with disabilities [10,11].
Emms and Gardner [6] argued that, for AAC users, graphic symbols are the most credible alternative
vocabulary, and the development of a graphic symbol vocabulary is absolutely critical and fundamental
for pediatric AAC users with disabilities. The critical role of graphic symbols in AAC highlights the
importance of symbol learning topics in AAC research. Applications of graphic symbols are extensive
in both research and teaching practice. Numerous researchers have used graphic symbols to improve

Appl. Sci. 2019, 9, 1260; doi:10.3390/app9061260                                www.mdpi.com/journal/applsci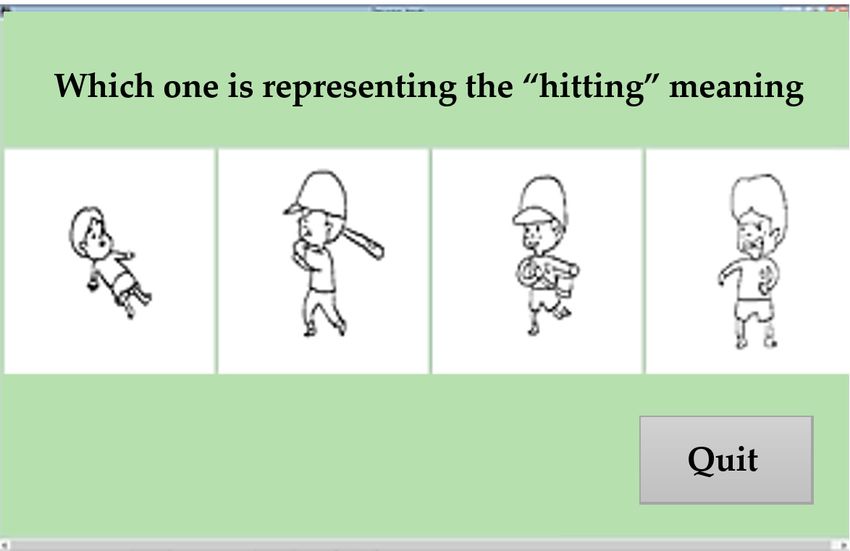
Appl. Sci. 2019, 9, 1260                                                                         2 of 17

the communication skills of students with disabilities or mitigate their challenging behavior [1,10].
Numerous studies have reported that picture book reading found effective for laying the foundation
for children’s future literacy capabilities [9,12–14]. It is closely related to language development,
print awareness, and emergent literacy [9,12–14]. In addition, graphic symbols are frequently used
as a teaching medium and as learning materials in both preschool and special education. Sandall
and Schwartz [15] encourage teachers and parents to use pictures and symbols to (a) improve oral
instruction comprehension for children with disabilities and (b) promote social interaction and
participation between all children with and without disabilities. Therefore, the use and learning
of graphic symbols are imperative for young children with and without disabilities. Most studies
have argued that graphic symbols can assist children with disabilities in functional competence (e.g.,
communication, writing, and learning) or improve their communication and literacy skills [6–11].
However, graphic symbols are merely a part of a symbol system, and the so-called symbols refer to
objects that stand for or represent referents. Beukelman and Mirenda [5] contended that if symbols
characterize the referents, they exhibit a problem of recognizability or specificity. Researchers have
also pointed out that many AAC studies have explored the learnability of various graphic symbol
systems through the intrinsic characteristics of the systems, and iconicity of symbols has often drawn
attention from researchers and practitioners [16–18].
      Symbol iconicity refers to any association between a symbol and a referent. The association
can be either based on a visual concept or any feature association by the viewer. Published studies
have primarily measured symbol iconicity through their transparency and translucency [16]. Symbol
transparency refers to the degree to which viewers can directly understand the referent or meaning
represented by an individual graphic symbol. Essentially, transparency means the guessability of
symbols for viewers without prior training or learning. By contrast, symbol translucency refers to the
degree to which viewers can understand or infer the referent or meaning represented by a graphic
symbol when some limited descriptive explanation or a contrast object is present. Symbol translucency
is also known as the learnability of symbols. Because the iconicity of symbols is one of the key
variables that affect symbol learning [19], researchers that have long identified these challenges and
have sought solutions proposed an iconicity hypothesis which states that graphic symbols with high
iconicity promote symbol learning and comprehension and favor learning outcomes [20]. For years,
the iconicity hypothesis has continued to garner attention [18], and learners have been able to easily
learn and comprehend graphic symbols with high iconicity. Essentially, graphic symbols that bear
a greater resemblance to their referent are more easily learned by individuals [17]. Often, the key
challenge of learning AAC applications is whether the learner can quickly associate the graphic
symbol iconicity with language and communication functions. Therefore, when communication
training or instructional intervention is involved, instructors should select graphic symbols with high
transparency and translucency from a variety of symbols and symbol systems to facilitate effective
learning outcomes [5].
      Most studies on symbol iconicity have compared various graphic symbol systems and reported
that symbol systems with high specificity or a variety of symbol elements (e.g., picture communication
symbols (PCSs)) yield favorable learning outcomes [16]. Empirical analyses have also revealed that
the characteristics of corresponding referents affect the learnability of symbols [21]. Moreover, some
studies have verified the iconicity hypothesis and reported that, in addition to favorable learning
outcomes yielded by graphic symbols with high iconicity, the complexity of symbols and components
are major factors of symbol learning [22]. Although numerous studies have been published on
the characteristics and learnability of AAC symbols, few of such studies have been published in
Taiwan. In light of this, preliminary studies on AAC symbols and iconicity of color PCS systems
commonly used in Taiwan have revealed that the translucency of color PCS systems tended to be
high, and nouns had higher translucency than both verbs and descriptors did. In addition, the results
confirmed the graphic symbol iconicity hypothesis and demonstrated that PCSs with high translucency
favored the participants’ learning outcomes [18]. Huang [13] investigated graphic symbol learning;
Appl. Sci. 2019, 9, 1260                                                                          3 of 17

the effects of 27 sets of self-compiled verb graphic symbols on the learning outcomes of 40 children
with developmental delays and 120 typically developing children were measured. The results revealed
that a wide variety of symbol components favored symbol recognition and learning for both children
with and without developmental delays. In addition, participants demonstrated significantly higher
performance on verb graphic symbols with two, four, and five components than they did on those with
a single component in terms of accuracy. Furthermore, children with developmental delays required
more time to identify verb graphic symbols with more components.
      However, from the cognitive psychology perspective, children should first pay attention to
certain content they read to trigger their learning; the cognitive process varies with the time spent on
reading pictures or texts [23]. The dual-coding theory believes that multi-element graphic symbols
provide more visual clues and stimuli, which can help readers form a coherent mental representation,
which is conducive to the recognition and memory of graphic symbols [24]. Some studies support a
positive relationship between the number of symbol elements and the degree of recognition [13,16,19].
However, cognitive load theory holds the opposite position [25]. It believes that human beings have a
limited ability to process information. Excessive information volume can cause readers to overload
information. Under the premise of limited working memory capacity, if readers need to encode and
organize multiple elements at the same time, it is easy to cause cognitive resources to compete and
distract, which is not conducive to the identification and learning of graphic symbols [25,26]. Some
literature addressing graphic symbol recognition also supports cognitive load theory [22,27,28].
      Although most relevant studies [13,16,17,29] have reported that the variety of symbol components
affects graphic symbol recognition and learning, the following questions warrant in-depth attention:
(a) whether the complexity of graphic symbols (i.e., the number of symbol components) affects
children’s concentration when they learn or read PCSs composed of various symbol components,
(b) whether graphic symbols with numerous components increase or decrease children’s reading
concentration, and (c) whether graphic symbols with numerous components affect learning outcomes.
      Published studies on AAC graphic symbol learning have employed techniques such as video
recording, observation of behavior, and computer systems to chronicle the learning reactions of the
participants [6]. However, the data collected through the aforementioned methods can only present the
participants’ responses and reaction times after learning or reading graphic symbols; such data do not
demonstrate the learning or reading processes (e.g., the children’s concentration) or the association of
concentration and reaction time with learning outcomes from reading PCSs and animations composed
of various numbers of components. Researchers have focused on this problem for investigations
of AAC symbol learning in children. However, conventional behavioral observation and computer
documentation cannot demonstrate the children’s inner psychological process when they learn AAC
symbols. Fortunately, the application of brain research in education has gradually become a trend, and
researchers have applied various brain research devices to objectively explore the variance of learning
competence. Numerous studies have examined the correlations of electroencephalogram (EEG) data,
learning outcomes, and concentration. In recent years, as brainwave-detecting devices have become
increasingly lightweight (e.g., Neurosky MindSet and MindWave) and research and development of
Brain–Computer Interface (BCI) programming have continued to advance, experts and scholars have
increasingly participated in the discipline of brainwave analysis [30,31].
      Medical and educational applications of brainwave measurement have emerged because of
the association between brainwaves and human consciousness. From the viewpoint of attention
theory and cognitive neuroscience, the importance of studying brainwave intensity is to link the
level of mental description of information processing in cognitive science to the anatomical level
in neuroscience. A brainwave is quantified as a difference between high and low potentials of an
electrophysiological signal in the brain. Generally, brainwaves are measured by connecting electrodes
to the scalp. The human brain contains an estimated total of 50–100 billion neurons connecting to up
to 1 quadrillion synapses, and the brain passes signals through the electric currents generated by these
neuron cells [31]. Brainwaves are loosely classified according to frequency range into four categories,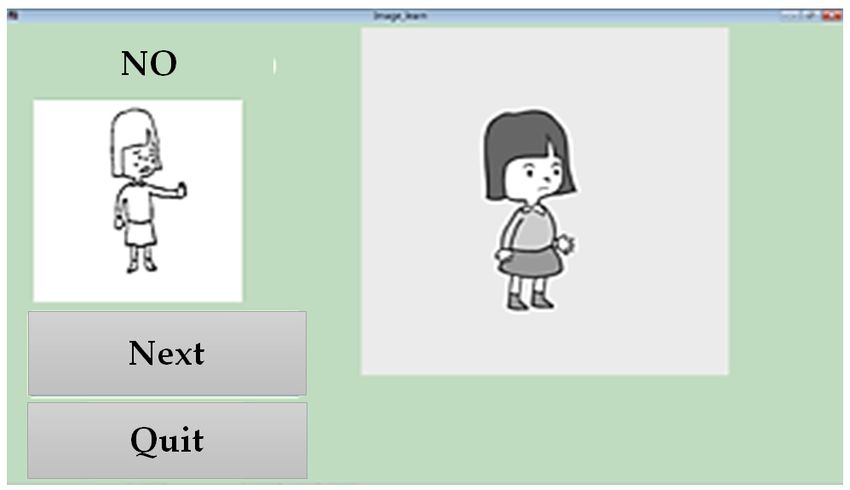
Appl. Sci. 2019, 9, 1260                                                                             4 of 17

namely alpha, beta, theta, and delta waves. The alpha wave can be easily detected in a relaxed state
(e.g., eyes closed, zoning out, and absent-minded), whereas the beta wave tends to be detected in an
alert state (e.g., playing sports and concentrated thinking). These two types of brainwaves are the
types of brainwaves most relevant to human beings’ conscious activities. One can calculate alpha and
beta waves to obtain the numerical values of brain concentration and relaxation.
      The present study employed Neurosky EEG devices and systems to investigate the effects and
variance of the number of symbol components on AAC graphic symbols identifying for children with
and without developmental delays. The two objectives of the present study are listed as follows: (a) to
further understand the factors of AAC graphic symbols learning, and (b) to identify the most suitable
number of graphic symbol components for children with developmental delays.

2. Related Work
      The information processing theory emphasizes that learning is an internal psychological activity of
human beings; learning is a process of acquiring and utilizing knowledge through sensory awareness,
attention, identification, conversion, and memory [32]. Attention is one of the crucial factors of learning
outcomes. During the learning process, attention facilitates active learning, comprehension, and
familiarity. Humans exhibit mental attention when they are engaged in various activities; mental
attention exhibits three aspects, namely selectivity, continuance, and transferability [23]. Learning
requires the transmission of signals; the first step of learning is to stimulate the sensory nervous
system from some external object, leading to the excitement. During the entire process, once the
stimulus disappears, the excitement of the sensory nervous system briefly remains and becomes a
signal [23,32]. Therefore, one must continuously focus on the topic to be learned to convert it into
effective signals processed by the brain [33]. Previous educational research has mainly examined
students’ attention through explicit behavioral observation and documentation, but the research data
have consistently lacked objectivity. From the viewpoint of attention theory and cognitive neuroscience,
the importance of studying brainwave intensity is to link the cognitive science concepts of the level of
mental description during information processing to the neuroscience concepts of the anatomical level.
      After discovering the electric discharge released by the electric eel in the late 19th century,
Hans Berger guessed that the same phenomenon would occur in the human body [34]. Subsequently,
he recorded the same radio phenomenon in the human skull. Berger documented and measured
the tiny discharge process in the human brain. This was the first time in human history that human
brainwaves were recorded, and this process Berger named “EEG.” Because of the association between
brainwaves and human consciousness, medical and educational applications of brainwaves emerged
thereafter. Numerous studies have pointed out the close associations of brainwaves with aspects such
as stress, job performance, learning outcomes, and attention [34,35]. For example, some studies have
stressed that athletes’ attention is strongly enhanced in certain brainwave states (e.g., archers can
effectively improve their performance by concentrating on aiming) [35]. Regarding learning outcomes,
some theories have stated that the rhythms of classical music can change the state of brainwaves so
that people can focus on learning and work with considerable efficiency [36]. Some scholars have
also analyzed and explored the relationship between brainwaves and learning outcomes. After the
statistical data of various attributes had been obtained, e-learning materials were recommended
according to the user profile [37]. Brainwaves are the differences between high and low potentials
of the electronic signals in the human brain and are generally measured by connecting electrodes
to the scalp. Because the brain consists of two cerebral hemispheres, the transmitted signals vary;
this phenomenon is known as frontal EEG asymmetry [35]. Brainwaves are loosely classified by
frequency range into four categories, namely alpha, beta, theta, and delta waves [35]. The alpha wave
can be easily detected in a relaxed state, whereas the beta wave tends to be detected in an alert state
(e.g., concentrated thinking). By contrast, the theta and delta waves become prominent in states of low
consciousness or unconsciousness (e.g., meditation and deep sleep). Because the theta and delta waves
are weak, cluttered, and irregular, the present study did not investigate these two types of waves.
Appl. Sci. 2019, 9, 1260 5 of 17
Regarding the bands of brainwaves, each frequency range exhibits a specific physiological
significance. Alpha waves are neural oscillations in the frequency range of approximately 8–13 Hz.
According to published studies, zen qigong training effectively relieves stress because high-frequency
and calm alpha waves are generated during meditation, indicating a direct relationship between
alpha waves and emotions [38]. The decreased energy consumption in the body leads to strong
brainwaves, which is the primary reason that scientists have argued that alpha waves benefit learning
outcomes. Because alpha waves become prominent during muscle relaxation, when the participant is
blinking, when the participant’s eyes are closed, or when the participant is asleep, alpha brainwaves
are often employed in music therapy [37,39]. Klimesch and his colleagues [40] compared the EEGs of
children with and without dyslexia who performed working memory tasks of three difficulty levels.
The results revealed that the normal children’s high and low alpha waves were more dispersed and
selective than those of children with dyslexia. In addition, the normal children employed fewer neural
resources (e.g., active high alpha waves) with a high attentional level (i.e., inactive low alpha waves)
to complete semantic encoding than the children with dyslexia did. Therefore, alpha wave activity
in the frontal lobe can be regarded as an indicator of inefficient information processing in children’s
working memory. By contrast, beta waves are neural oscillations in the frequency range of 14–30 Hz
that are prominent when people are stressed or focused [41,42]. When human beings exercise, focus on
thinking, or are busy or paying attention to something, the brain is in a waking state and the generated
brainwaves are known as beta waves. Beta waves are advantageous brainwaves that are prominent in
an awake and proactive mental state and are primarily associated with activities in the left hemisphere.
A prolonged period in such a mental state leads to body tension. Consequently, the prolonged mental
tension drains the brain and makes the person feel tired easily while the physical exhaustion causes
anxiety, irritability, and inability to relax. The attention and relaxation parameters examined in the
present study were the beta and alpha waves calculated from EEG measurements. Generally, when a
participant was in a focused state, the relaxation parameter decreased substantially. By contrast, when
a participant was in a relaxed state, the attention parameter did not increase.
Brainwave intensity is a relatively abstract and complex concept and is predominantly obtained
by beta wave calculation. Beta waves are classified into two types, namely high and low beta waves.
High beta waves are brainwaves with a relatively high frequency (≥30 Hz); the high portion of the beta
range overlaps with the low portion of the gamma range. High beta waves become prominent during
intensive brain activities and fast information processing. A recent study developed an interface to
enable wheelchair control through attentive focus [43]. Another study employed shooting accuracy
in archery and coin-stacking height to confirm that human beings’ attention in a conscious state far
exceeds that in a normal state [44]. Technological advances in medical science have made brainwave
research one of the key topics in applied science and technology. Applications of EEG monitoring
have become widespread in various disciplines. For example, numerous scholars in the field of design
have investigated the effect of lighting color arrangement on brainwaves; this has applied to design
e-books and learning materials that increase readers’ attention [45]. Moreover, intact phonological
processing is crucial for successful literacy acquisition. While learning reading and writing, children
should be aware of the sounds of their mother tongue from segmental phonemes as the smallest
sound elements to the prosody of supra segmental words and phrases. Phonemic awareness has not
only been found to explain individual differences in reading and spelling but also to differentiate
typical and literacy-impaired populations (e.g., developmental dyslexia) [46]. In addition, other
studies have investigated brainwave differences among individuals with disabilities and examined
BCI applications [31]. In conventional EEGs, the participant is required to wear a head covering that
encompasses the entire scalp and collects brainwave signals. Inside the head covering are several
electrodes that touch the scalp; the electrodes are coated with conductive adhesives to improve
signal collection. Furthermore, the measurement must take place in a specific environment without
interference. In recent years, EEG devices have overcome the constraints of conductive adhesives and
special locations; brainwaves can now be measured with an EEG headset. Currently, the primary brainAppl. Sci. 2019, 9, 1260 6 of 17
activities that can be detected by EEGs comprise attention, excitement, and relaxation. The present
study investigated the effect of the number of symbol components on AAC graphic symbol learning
using EEGs to explore and analyze the attention and relaxation parameters of children with and
without developmental delays when learning PCSs with various numbers of components. The findings
demonstrate potential factors of PCS learning.
3. Material and Methods
The purpose of this study was to investigate the effects of the number of graphic symbol
components on the brainwaves of children with and without developmental delays after reading and
learning PCSs. Although the research objective was suitable for experimental and quasi-experimental
research design, complete random sampling would have been difficult to achieve because the
participants were children with developmental delays. In addition, the vast differences of the
participants’ attributes meant that they could not be randomly assigned to an experimental and
a control group. Therefore, this study employed a quasi-experimental design with a pretest and a
posttest but without group partition. The independent variable was the number of graphic symbol
components, and the dependent variables were the participants’ learning outcomes and EEG histories
while learning PCSs, including the accuracy of identifying correct graphic symbols and the EEG
attention (primarily the beta waves) and relaxation (primarily the alpha waves) parameters.
3.1. Research Design
This study recruited children with developmental delays currently attending kindergarten in
Taiwan for purposive sampling. The selection criteria for children with developmental delays were as
follows: (a) currently attending a public or private kindergarten, (b) experiencing developmental delays
certified by a doctor’s diagnosis or the Special Education Students Diagnosis and Placement Counseling
Committee of a county government, (c) possessing basic receptive language skills (e.g., ability to
understand commands and simple sentences), and (d) no other disabilities, such as physical, sensory,
and emotional handicaps. In addition, to understand the homogeneity and variance of PCS recognition
and learning between children with developmental delays and their peers without developmental
delays, the research staff requested that the kindergarten teachers recommend two peer students
without special educational needs who frequently interacted with the participating student with
developmental delays. The research team visited the kindergarten classes to explain research objectives,
implementation methods, expected outcomes, data confidentiality, and ethical compliance to the
kindergarten’s managers, teachers, parents, and participating children. Finally, after obtaining written
consent from the parents and the kindergarten teachers, the research team recruited 17 children with
developmental delays and 34 peer students without developmental delays from five kindergarten
classes in Taiwan as research participants. The primary disabilities among the 17 children with special
needs were cognitive and language developmental delays. The biological ages ranged between 67
and 77 months (or 5.7 and 6.5 years) (SD = 2.88 months) with a mean age of 72 months (6.0 years).
The male–female ratio of the 17 participants with special needs was 9:8. Similarly, the biological
ages of the peer students without special needs ranged between 68 and 77 months (or 5.7 and
6.5 years) (SD = 2.94 months) with a mean age of 73 months (6.1 years). The male–female ratio
of the 34 participants without special needs was 19:15.
3.2. PCS Recognition
The aim of this study was to explore the effect of the number of symbol components on PCS
recognition. Table 1 shows the words of the 30 PCSs. The vocabulary list was compiled according to a
survey of vocabulary commonly used by kindergarten children. Each word had two corresponding
PCS patterns with various numbers of components (a single symbol with one component and multiple
symbols with five components). Table 2 shows an example of single and multiple symbols and the
corresponding word.Appl. Sci. 2019, 9, x Appl. Sci. 2019, 9, x 7 of 17 7 of 17
Appl. Sci. 2019, 9, x 7 of 17
Table 1. Picture
Table 1. Picture communication communication
symbol symbollist.
(PCS) vocabulary (PCS) vocabulary list.
Appl. Sci. 2019, 9, 1260 Table 1. Picture communication symbol (PCS) vocabulary list. 7 of 17
Number Number
2 1 31 24 35 64 75 86 97 8 10 9 10
Number 1 2 3 4 5 6 7 8 9 10
Word
Word (Work) (Play) (Work) (Play) (Give)(Please)
(Run) (Sleep) (Drink) (Yes)
(Sleep) (Please) (Yes)
(Goodbye) (No)(Goodbye) (No)
Word 1.(Run)
Picture
Table(Work) (Give) (Drink)
communication
(Play) (Run) symbol
(Give)(PCS) vocabulary
(Drink) (Sleep) list.
(Please) (Yes) (Goodbye) (No)
Number 11 Number 12 11
13 1214 13
15 1614 1715 1816 17
19 1820 19 20
Number 1 Number 2 113 12 4 13 5 14 6 15 7 16 8 17 9 18 10 19 20
Word (Do) (Eat)Word(Go (Do) Home)(Eat)
(Come) (Go Home) (Come)
(Punch) (Pull) (Pat)
(Use) (Punch) (Use) (Put) (Pull) (Pat)(Wash) (Put) (Wash)
Word (Work) Word
(Play) (Do)
(Run) (Eat)(Give)
(Go Home) (Come)
(Drink) (Punch)
(Sleep) (Please)(Use)(Yes) (Pull) (Pat) (No)
(Goodbye) (Put) (Wash)
Number
Number 21 Number
11 22
12 21
23 2224 23
25 2624 2725 2826 27
29 28 30 20 29 30
Number 2113 22 14 23 15 24 16 25 17 26 18 27 19 28 29 30
Word
Word (Wear) Word (Go
(Do) (Take)
(Eat) (Wear)
Home)(Take)
(Carry) (Come)(Carry)
(Push) (Paste) (Push)
(Punch) (Buy) (Pull)(Sell)
(Use) (Write)
(Paste) (Pat) (Thank)
(Buy) (Put) (Sell)
(Write) (Throw) (Thank) (Throw)
(Wash)
Word (Wear) (Take) (Carry) (Push) (Paste) (Buy) (Write) (Sell) (Thank) (Throw)
Number 21 22 23 24 25 26 27 28 29 30
Word (Wear) (Take) (Carry)
Table 2. (Push) (Paste)
Table
PCS example (Buy)example
(Write)
and2.description.
PCS and (Sell) (Thank)
description. (Throw)
Table 2. PCS example and description.
Pattern of Pattern of Table 2. PCS example and description.
Pattern
PCS of
(Give) PCS (Give) Component Component Description
Description
Symbol Symbol PCS (Give) Component Description
Symbol
Pattern of Symbol PCS (Give) Component Description
1. Made of one component 1. Made of one component
1.
1. Made
Made
of one component
ofextending
one
Single-symbol Single-symbol 2. A person extending 2. A person
one arm to component
depictone thearm to depict the
Single-symbol
Single-symbol 2. A2.person
A person extending
extending one armone toarm
depict tothe
depict the
movementmovement movement
of giving of giving
of giving
movement of giving
1. Made of five components
1. Made of five components
1. Made ofcomponents
five components
2. (a)1.AMade
2. (a) A person extending oneofarm
person five
extending one arm and to depict
and to depict
Multiple- Multiple- 2. (a) A person extending
2. (a) A person extending one armone arm
and and to depict
to depict
Multiple-
Multiple-symbol the movement of the movement
giving (b) of
grasping giving
an (b)
apple grasping
in hand an
(c)apple
in inin hand (c)
symbol symbol the movement of giving (b) graspingapple
the movement of giving (b) grasping an an apple hand (c)
symbol directional arrowhand directional
(d) child arrow
(c) adirectional
(e) arrow(d)(d)
a table afull
child (e)(e)aatable
of apples
a child tablefull of apples
directional arrow (d) a child (e) a table full of apples
full of apples (background)
(background) (background)
(background)
3.3.
3.3.Research 3.3. Research Instruments
ResearchInstruments
Instruments
3.3. Research Instruments
3.3.1.Graphic
3.3.1. GraphicSymbol
Symbol LearningSymbol
3.3.1. Learning
Graphic SystemLearning System
System
3.3.1. Graphic Symbol Learning System
Thisstudy
This studyaimed
aimed toobjectively
This
to objectively
study aimed collect dataregarding
regarding
to objectively
collect data collect graphic symbollearning
data regarding
graphic symbol learning outcomes
graphic outcomes
symbol andto
learning
and tooutcomes and to
This study aimed to objectively collect data regarding graphic symbol learning outcomes and to
understandthe
understand the factors
factors
understand
of these thelearning
factors of outcomes. The
The research
these learning
outcomes. outcomes.
research team
team conducted
The researcha ateam
conducted literature review
conducted
literature review aofliterature review
understand the factors of these learning outcomes. The research team conducted a literature review
published
of published researchof and
research instructional
published
and experiences
research
instructional and to design
instructional
experiences aexperiences
to designgraphic symbol
a graphic learning
to design
symbol softwaresymbol
a learning
graphic program
software learning software
of published research and instructional experiences to design a graphic symbol learning software
as the primary
program as the research
programinstrument
primary as the primary
research in thisresearch
instrument study.
in thisThe interactive
instrument
study. The teaching
in interactive
this study. material was
The interactive
teaching developed
material teaching
was material was
program as the primary research instrument in this study. The interactive teaching material was
by BorlandbyDelphi,
developed Borland which
developed
Delphi, enabled
by Borland
which the recording
Delphi,
enabled which
the of user
enabled
recording data in recording
the
of user adata
database ofinuser
a back-end
in a database data asystem.
in ainback-end
database in a back-end
developed by Borland Delphi, which enabled the recording of user data in a database in a back-end
The graphic
system. The symbol
graphic learning
system. Thesystem
symbol graphic
learningis divided
systeminto
symbol two subsystems:
learning
is divided system
into two Graphic
is divided Symbol
into two
subsystems: Assessment
subsystems:
Graphic SymbolandGraphic Symbol
system. The graphic symbol learning system is divided into two subsystems: Graphic Symbol
AAC graphic
Assessment symbol
and AACanimations.
Assessmentgraphic and Figuregraphic
AAC
symbol 1 illustrates
animations. symbol thatanimations.
Figure the1 Graphic
illustrates Symbol
Figure Assessment
that1theillustrates
Graphicthat interface
the Graphic Symbol
Symbol
Assessment and AAC graphic symbol animations. Figure 1 illustrates that the Graphic Symbol
is divided into two portions.
Assessment The top
interface isportion
divided displays
into two the question
portions.
Assessment interface is divided into two portions. The top portion displays the question in written Thein written
top and
portion audible
displays forms
the question in written
Assessment interface is divided into two portions. The top portion displays the question in written
(e.g.,audible
and which oneformsrepresents
and audible
(e.g., theforms
which “hitting”
(e.g.,meaning?),
one represents whichtheone whereas
represents
“hitting” the bottom portion
the “hitting”
meaning?), whereas displays
meaning?),
the bottomfour clickable
whereas
portionthe bottom portion
and audible forms (e.g., which one represents the “hitting” meaning?), whereas the bottom portion
graphic symbols
displays as answer
displays
four clickable four
graphic options.
symbolsIn addition,
clickable graphic
as answer user
symbols information
options. asIn answer and
addition, activity
options. Inrecords
addition,
user information areuser
saved
and in the
information
activity and activity
displays four clickable graphic symbols as answer options. In addition, user information and activity
database of
records are savedthe learning
records system
in the are for
saved of
database subsequent
in the
the learning uploading
databasesystem and
of the learning analysis.
for subsequent Figure
systemuploading 2 illustrates
for subsequent that the
uploading and analysis.
and analysis.
records are saved in the database of the learning system for subsequent uploading and analysis.
Graphic
Figure Symbol Figure
2 illustratesanimations
that 2the interfacethat
illustrates
Graphic is divided
Symbol into two
the Graphic
animations portions.
Symbol The
animations
interface is leftinterface
divided portion
into twoincludes
is dividedtheinto
portions. target
Thetwo portions. The
Figure 2 illustrates that the Graphic Symbol animations interface is divided into two portions. The
word
left on topincludes
portion andleft
the portion
corresponding
the target wordgraphic
includes thetop
on symbol
target theon
andword thetop
on bottom,
corresponding and thewhereas the
corresponding
graphic right portion
symbol graphic
on displays
symbol on the bottom,
the bottom,
left portion includes the target word on top and the corresponding graphic symbol on the bottom,
the instruction
whereas the rightcombining
whereas
portion the texts,
right
displays animation,
portion
the and audio
displays
instruction thecues.
combininginstruction
texts, combining
animation, texts, animation,
and audio cues. and audio cues.
whereas the right portion displays the instruction combining texts, animation, and audio cues.
Figure Figure
Figure1.1.Screenshot
Screenshot 1. Screenshot
ofofgraphic
graphic symbol of graphic symbol assessment.
symbolassessment.
assessment.
Figure 1. Screenshot of graphic symbol assessment.Appl. Sci. 2019, 9, 1260 8 of 17
Appl. Sci. 2019, 9, x 8 of 17
Figure 2.
Figure Screenshot of
2. Screenshot of animations
animations on
on graphic
graphic symbol
symbol vocabulary.
vocabulary.
3.3.2. MindWave EEG Device
3.3.2. MindWave EEG Device
This study used the MindWave EEG headset developed by NeuroSky as the EEG detecting
This study used the MindWave EEG headset developed by NeuroSky as the EEG detecting
instrument. The headset employs ThinkGear technology to collect electronic signals from the brain
instrument. The headset employs ThinkGear technology to collect electronic signals from the brain
and is as portable as a regular headset for music listening. In addition, the headset can be paired with
and is as portable as a regular headset for music listening. In addition, the headset can be paired with
a computer wirelessly through Bluetooth, and the device’s user-friendliness favored the participants’
a computer wirelessly through Bluetooth, and the device’s user-friendliness favored the participants’
usage and enabled the research team to collect the data in a natural environment. The electrodes are
usage and enabled the research team to collect the data in a natural environment. The electrodes are
distributed in three touch points across the MindWave headset. In addition to detecting brainwaves
distributed in three touch points across the MindWave headset. In addition to detecting brainwaves
in the frontal lobe, the frontal electrode also detects the user’s blinking. The other two electrodes are
in the frontal lobe, the frontal electrode also detects the user’s blinking. The other two electrodes are
normal electrodes that are primarily used to detect alpha and beta waves. Conductive adhesives are
normal electrodes that are primarily used to detect alpha and beta waves. Conductive adhesives are
not required for the MindWave headset, leading to reduced test time by eliminating preparation.
not required for the MindWave headset, leading to reduced test time by eliminating preparation.
3.3.3. Liquid Crystal Display Touch Screen
3.3.3. Liquid Crystal Display Touch Screen
Because the participants’ e-learning experience and computer literacy varied, this study employed
Because the participants’ e-learning experience and computer literacy varied, this study
a touch-screen interface for both PCS assessment and learning. A high-end computer featuring an
employed a touch-screen interface for both PCS assessment and learning. A high-end computer
independent graphic card, a four-core high-speed processor, and a liquid crystal display touch-screen
featuring an independent graphic card, a four-core high-speed processor, and a liquid crystal display
monitor was used as the research instrument in this study to stabilize the clarity of graphic symbols,
touch-screen monitor was used as the research instrument in this study to stabilize the clarity of
accelerate system response time, and minimize irrelevant factors.
graphic symbols, accelerate system response time, and minimize irrelevant factors.
3.3.4. Real-Time EEG Monitoring System
3.3.4. Real-Time EEG Monitoring System
This study used the MindWave EEG headset developed by NeuroSky as the experimental
This study
instrument used the MindWave
and combined EEG headsetand
it with a self-developed developed
patentedby NeuroSky
real-time EEGasmonitoring
the experimental
system
instrument and combined it with a self-developed and patented real-time
to obtain EEG data [47]. Once the headset had been successfully paired with the computer EEG monitoring system to
and
obtain
had EEGproperly
been data [47].donned
Once the byheadset had been successfully
the participant, the EEG signal paired with the computer
measurement and had
was ready been
to start.
properly donned by the participant, the EEG signal measurement was ready
The measured data in the headset were sent to the computer wirelessly through Bluetooth. The data to start. The measured
data in
were the headset
updated were sent once
approximately to theevery
computer
second, wirelessly
and the through
updatedBluetooth.
data were The data weredisplayed
immediately updated
approximately
on the programonce everyon
window second, and the updated
the computer screen. ThedataEEG
weremonitoring
immediately displayed
system on thereal-time
displayed program
window on the computer screen. The EEG monitoring system displayed real-time
alpha, beta, theta, and delta waves detected by the headset so that the research team could observe alpha, beta, theta,
the
and delta waves detected by the headset so that the research team could observe
experimental data of brainwave movement and obtain numerical values for variables such as attention, the experimental
datarelaxation
and of brainwave movement and obtain numerical values for variables such as attention, and
parameters.
relaxation parameters.
Before the real-time EEG monitoring system was turned on, the EEG headset was paired up
with Before the real-time
the computer. After EEG monitoring
the port system was turned
value corresponding to theon, the EEG
headset washeadset was paired
confirmed, up with
data collection
the computer. After the port value corresponding to the headset was confirmed,
began when the “Start” button was pressed. A brief waiting period followed while the headset data collection began
was
when the “Start” button was pressed. A brief waiting period followed while
connecting to the system. Once the headset had paired with the system, the start menu was displayed the headset was
connecting
on to the
the screen. Once system.
the userOnce
hadthe headset
clicked “OK”had onpaired with
the start the system,
menu, the EEGthe start menu
monitoring was displayed
system began its
on the screen. Once the user had clicked “OK” on the start menu, the
monitoring process. The user was able to view the EEG data on the system menu while the EEG monitoring system began
monitoring
its monitoring process. The user was able to view the EEG data on the system
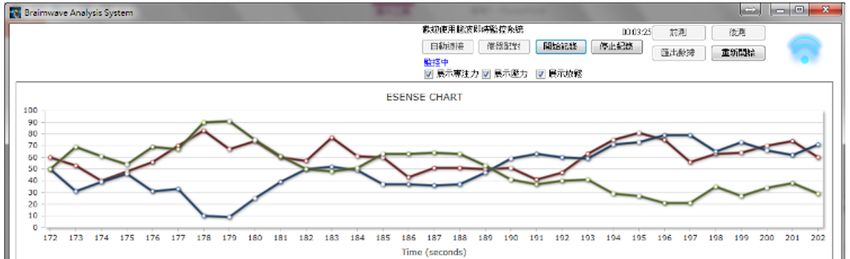
system was running. Figure 3 illustrates that the top portion of the system screen displayed a line menu while the
monitoring
graph systemstress
of the user’s was and
running.
energyFigure
indices3while
illustrates that the
the bottom top displayed
portion portion ofa bar
thechart
system screen
of various
displayed a line graph of the user’s stress and energy indices while the bottom portion
EEG band data. The screen refreshed once every second to monitor the user. In the top half of Figure 3, displayed a
bar line
the chartgraph
of various EEGand
of stress band data.indices
energy The screen refreshed once
are displayed everycomparison
to enable second to monitor
at each the
timeuser. In
point,
the top half of Figure 3, the line graph of stress and energy indices are displayed to enable comparison
at each time point, whereas the bottom half displays real-time numerical changes of eight EEG bands
comprising delta, theta, low alpha, high alpha, low beta, high beta, low gamma, and high gamma.Appl. Sci. 2019, 9, 1260 9 of 17
whereas the bottom half displays real-time numerical changes of eight EEG bands comprising delta,
theta, low
Appl. Sci. alpha,
2019, 9, x high alpha, low beta, high beta, low gamma, and high gamma. 9 of 17
monitoring system.
Figure 3. Screenshot of the real-time electroencephalogram (EEG) monitoring system.
The brainwave
brainwavedata datadetected
detectedfrom the MindWave
from the MindWave headset consisted
headset of eight of
consisted EEG bands.
eight EEG However,
bands.
because
However, copious
because volumes
copiousof volumes
data wereofcollected,
data were thecollected,
meaningsthe of these brainwave
meanings data
of these were difficult
brainwave data
to understand without organization and analysis. Figure 4 illustrates the raw
were difficult to understand without organization and analysis. Figure 4 illustrates the raw data data measured by the
monitoring
measured bysystem. The monitoring
the monitoring system. system converted
The monitoring raw data
system to an intuitive
converted raw dataline chart
to an and a line
intuitive bar
chart, as shown in Figure 3. The researcher had to ensure that the MindWave
chart and a bar chart, as shown in Figure 3. The researcher had to ensure that the MindWave EEG EEG headset was worn
on the participant’s
headset was worn on head
theproperly once head
participant’s the real-time
properlymonitoring system had
once the real-time begun itssystem
monitoring recording.
had
Subsequently, both the
begun its recording. line chart and
Subsequently, boththethe
barline
chart appeared
chart and theon barthe pretest
chart and posttest
appeared on the monitoring
pretest and
screen.
posttestThe three lines
monitoring on the
screen. linethree
The chartlines
on the
on top
the half of theon
line chart screen comprised
the top attention,
half of the screen stress, and
comprised
relaxation parameters.
attention, stress, Table 3 illustrates
and relaxation parameters. theTable
frequency range the
3 illustrates of each EEG band.
frequency rangeRecorded
of each EEGEEG raw
band.
data wereEEG
Recorded filtered
rawinto
datadifferent brainwaves.
were filtered Before
into different performing
brainwaves. statistical
Before analysis,
performing the brainwave
statistical analysis,
powers were subjected
the brainwave to a subjected
powers were natural logarithm
to a naturalto make the distribution
logarithm close to normality.
to make the distribution close to normality.
4. Screenshot of raw data in real-time EEG monitoring system.
Figure 4.
Figure
Table 3. Frequency range of EEG bands.
Brainwave Range (Hz)
Delta 0.1~4
Theta 4~7
Low Alpha 8~9
High Alpha 11~12Appl. Sci. 2019, 9, 1260 10 of 17
Table 3. Frequency range of EEG bands.
Brainwave Range (Hz)
Delta 0.1~4
Theta 4~7
Low Alpha 8~9
High Alpha 11~12
Low Beta 12.5~16
High Beta 20.5~28
Low Gamma 25
High Gamma 100
3.4. Procedure
3.4.1. EEG Headset Wearing and Calibration
Before the formal pretest, posttest, or PCS instruction commenced, the participant was required
to wear the EEG headset properly. After ensuring the participant was wearing the headset properly,
the research team first interacted with the participant using a picture book. The purpose was to
establish a relationship with the participant, mitigate the participant’s unfamiliarity, and enable the
participant to be accustomed to wearing a headset. Meanwhile, the headset was paired up with the
computer and calibrated during the interaction between the research team and the participant. After
the calibration was completed, the data collection was formally implemented.
3.4.2. AAC Graphic Symbols Test
The graphic symbols vocabulary test was conducted using the Graphic Symbol Assessment
function of the Graphic Symbol Learning System. The test evaluated the participants’ comprehension
of the 30 aforementioned graphic symbols and the corresponding words. Because the participants
were asked to wear the EEG headset and work with digital media and a tablet computer, the research
staff arranged sufficient practice time before the formal pretest took place to mitigate irrelevant factors
such as computer operation and headset wearing issues. The practice time enabled the participants
to become familiar with the clicking and dragging methods on a touch-screen computer, and the
participant’s seating height and distance were also adjusted during the practice time. After the research
team ensured that the participant was capable of understanding how to operate the computer and the
learning system, the monitoring software was set up before the pretest commenced.
3.5. Data Collection and Analysis
This study collected the participants’ identifying outcomes and brainwave histories for tests of
AAC graphic symbols largely through the Graphic Symbol Learning System and EEG technology.
To mitigate the effect of activities prior to the test on the participants’ brainwave changes, all data
collecting tests were conducted during kindergarten school hours after the lunch break. In addition,
to prevent grading errors and irrelevant factors, the research team members served as evaluators.
The assessment was carried out with touch-screen computers with identical specifications and a
standardized oral guidance method. Once the participant put on the EEG headset properly, the research
team spent 5–10 min talking to the participants casually and establishing a relationship to prevent
evaluation errors caused by factors such as unfamiliarity and nervousness. Meanwhile, during this
time span, the participant was allowed to become familiar with the clicking and dragging functions of
the touch-screen computer. Subsequently, the research team operated the computer and the assessment
software to display the assessment menu. The computer recorded the participant’s answers and
response times for questions containing various target words while the EEG headset and the real-time
monitoring system recorded the participant’s numerical brainwave data. This study used SPSS as
a tool for statistical analysis. The mean and standard deviation were calculated for the accuracyAppl. Sci. 2019, 9, 1260 11 of 17
of the participant’s graphic symbols identification and for the EEG numerical values representing
attention and relaxation parameters. The numerical values were paired up with graphs to illustrate
the brainwave changes that reflected the participant’s attention. Furthermore, this study conducted
a two-way analysis of variance (ANOVA) to compare the effect and variance of the number of AAC
graphic symbol components on identifying outcomes and brainwave histories of children with and
without developmental delays. The integrated EEG Biofeedback function enabled the user to monitor
his or her own attention for brainwave data analysis. Once the Graphic Symbol Learning System began
running, the system automatically measured the EEG attentional performance as the baseline before
the training. Subsequently, various degrees of attention during training were configured in the system
from low (Attention: 50) to moderate (Attention: 70) and substantial (Attention: 90). Once the user
put on the EEG headset, the EEG monitoring system performed real-time computation using the data
measured from the MindWave headset and transmitted through the Bluetooth connection. In addition,
the monitoring system calculated and displayed indices such as Pressure Index (PI), Meditation Index
(MI), Body Energy Index (BEI), and Comprehensive Index (CI). These indices were calculated through
the following equations:
PI can be converted from MI as follows:
PI = 100 - β waves. (1)
The Relaxation Index can be regarded as MI, and BEI can be calculated as follows:
(High θ waves + Low θ waves)
BEI = (2)
2
CI can be calculated as follows:
(High θ waves + Low θ waves)
CI = θ waves/ [ ] (3)
2
The Attention Index demonstrated the participant’s mental focus or concentration. When the
participant was able to control psychological activities in a highly concentrated state, the Attention
Index (ranging between 0 and 100) increased. By contrast, mental states such as distraction, fainting,
inattention, and anxiety decreased the Attention Index. The Relaxation Index, also ranging between 0
and 100, demonstrated the participant’s mental calmness or relaxation. Several studies have confirmed
that unstable brainwaves affect attention, thereby affecting the development of learning capacity.
Therefore, the BCI in this study retrieved MindWave data through an EEG Biofeedback mechanism
and uploaded the user’s EEG Attention Index to a cloud server for statistical analysis of subsequent
EEG attention training. According to the official data published by NeuroSky, the data accuracy of the
MindWave headset is up to 90–96% [48]. Other studies that have employed the MindWave headset have
also confirmed that the headset has an accuracy up to 80% that facilitates a cost-effective, noninvasive
brain machine interface for mind-controlling robotic arms by retrieving EEG signals [49]. Another
study reported that EEG-based e-learning had a 96% accuracy in detecting user’s emotions [50].
4. Experimental Results and Discussion
4.1. Success Rates of AAC Graphic Symbols Identification
This study aimed to investigate the effect of a number of symbol components on graphic
symbols recognition and learning outcomes. Table 4 shows the success rates of the children with
and without developmental delays identifying the 30 graphic symbol sets with various numbers of
components. Table 4 demonstrates that the average success rates for children with developmental
delays identifying single- and multiple-component symbols were 37.04% (SD = 17.03%) and 50.00%
(SD = 17.09%), respectively. The overall success rate for these participants was 43.14% (SD = 17.81%).
By contrast, the average success rates for children without developmental delays identifying single-Appl. Sci. 2019, 9, 1260 12 of 17
and multiple-component symbols were 64.71% (SD = 15.23%) and 74.12% (SD = 13.31%), respectively.
The overall success rate for these participants was 69.41% (SD = 14.87%). In addition, the overall
success rates for the total population identifying single- and multiple-component symbols were 55.13%
(SD = 20.53%) and 66.40% (SD = 18.31%), respectively. This study conducted a two-way ANOVA to
examine the effects of developmental status (i.e., children with developmental delays and peers) and a
number of components (i.e., single- and multiple-component symbols) on the success rate of graphic
symbols identification. The results revealed a nonsignificant interaction between developmental
status and the number of components (F = 0.154, p>.05), indicating no interaction between these
two variables. Subsequently, this study separately examined the main effects of these two variables.
The first one-way ANOVA revealed a statistically significant interaction between developmental status
and the success rate of graphic symbols identification (F = 32.656, p < 0.05), indicating that the two
population groups had a significant difference in graphic symbols identification. The mean numerical
values also demonstrated that the children without developmental delays had a significantly higher
success rate than did those with developmental delays. In addition, this study further explored the
effect size of the developmental status variable on the success rate of graphic symbols identification.
The results revealed that the developmental status variable could explain 41% of the variance of
the success rate (η 2 = 0.410). These two variables exhibited a strong correlation to each other [51].
By contrast, the second one-way ANOVA also revealed a statistical significance between a number of
components and the success rate of graphic symbols identification (F = 6.096, p< 0.05), indicating a
significant difference for success rates between single- and multiple-component symbols. The mean
numerical values also demonstrated that the participants had a significantly higher success rate
at identifying multiple-component symbols than single-component symbols. The effect sizes for a
number of components and success rates of graphic symbols identification indicated that the number
of components explained 11.5% of the variance of the success rate (η 2 = 0.115), indicating a moderate
correlation between the two variables.
Table 4. Success rates of PCS identification for children with and without developmental delays (DD)
(by percentage).
Group N M SD F η2
DD—single-symbol 37.04 17.03
17
multiple-symbol 50.00 17.09
Peers—single-symbol 64.71 15.23
34
multiple-symbol 74.12 13.31
DD (All) 17 43.14 17.81
32.656 * 0.410
Peers (All) 34 69.41 14.87
Single-symbol (All) 51 55.13 20.53
6.096 * 0.115
Multiple-symbol (All) 51 66.40 18.31
* p < 0.05.
4.2. The Variance of Attention Index
This study investigated the effect of a number of components on participants’ EEG differences
when they attempted to identify graphic symbol sets. Table 5 shows the average Attention Index
values of the children with and without developmental delays identifying the 30 graphic symbol
sets with various numbers of components. Table 5 demonstrates that the average Attention Index
values for children with developmental delays identifying single- and multiple-component symbols
were 60.22 (SD = 14.66) and 50.00 (SD = 7.29), respectively. The overall Attention Index for these
participants was 55.41 (SD = 12.59). By contrast, the average Attention Index values for children
without developmental delays identifying single- and multiple-component symbols were 50.33
(SD = 11.13) and 45.16 (SD = 7.76), respectively. The overall Attention Index for these participants wasYou can also read