CMI REPORT - The costs of corruption to the Mozambican economy Why it is important to fight corruption in a climate of fiscal fragility - Chr ...
←
→
Page content transcription
If your browser does not render page correctly, please read the page content below

NUMBER 6

CMI REPORT
                 D E C E M B E R 2 0 16

The costs of corruption to
the Mozambican economy
Why it is important to fight corruption
in a climate of fiscal fragility

Centro de Integridade Pública (CIP)

Chr. Michelsen Institute (CMI)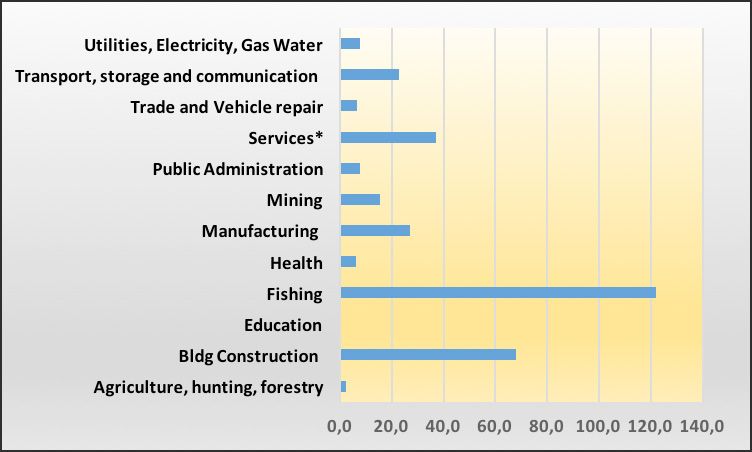
2   C M I R E P O RT                                    NUMBER 6, DECEMBER 2016

                                CMI report
                         Number 6, December 2016

                           ISSN 0805-505X (print)
                           ISSN 1890-503X (PDF)
                       ISBN 978-82-8062-616-5 (print)
                       ISBN 978-82-8062-617-2 (PDF)

                             Graphic designer
                             Kristen Børje Hus

                                www.cmi.no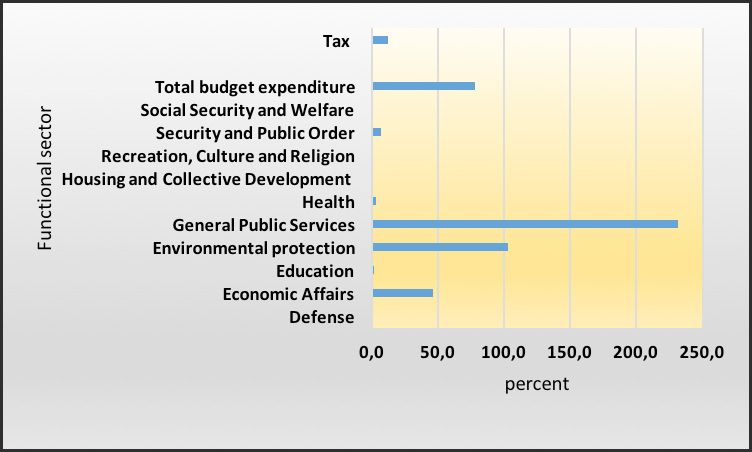
NUMBER 6, DECEMBER 2016                                               C M I R E P O RT             3

                 ACRONYMS
                 ADM        Aeroportos de Moçambique
                 AGE        Applied General Equilibrium
                 AML        Anti-Money Laundering
                 AR         Assembleia da República
                 AT         Autoridade Tributária de Moçambique
                 AUCPCC     African Union Convention on Preventing and Combating Corruption
                 BM         Banco de Moçambique
                 BOT        Build, Operate and Transfer
                 CB         Concessional Borrowing
                 CFM        Caminhos de Ferro de Moçambique
                 CFPOA      Canadian Corruption of Foreign Public Officials Act
                 CSO        Civil Society Organisation
                 DFID       Department for International Development (UKAid)
                 EDM        Electricidade de Moçambique
                 EIA        Environmental Investigation Agency
                 EITI       Extractive Industry Transparency Index
                 FCPA       Foreign Corrupt Practices Act
                 FCPA       Foreign Corrupt Practices Act
                 FDI        Foreign Direct Investment
                 FIPAG      Fundo de Investimento e Património de Agua
                 GAZEDA     Gabinete das Zonas Económicas de Desenvolvimento Acelerado
                 GCCC       Gabinete Central de Combate à Corrupção
                 GCPV       Gabinete Central de Proteção a Vítima
                 GDP        Gross Domestic Product
                 GFI        Global Financial Integrity
                 GNI        Gross National Income
                 GPI        Corruption Perception Index
                 ICVL       International Coal Ventures Limited
                 IIAG       Ibrahim Index of African Governance
                 IMF        International Monetary Fund
                 INE        Instituto Nacional de Estatísticas
                 IRPC       Imposto sobre Rendimento de Pessoas Coletivas (corporate income tax)
                 IRPC       Imposto Simplificado para Pequenos Contribuintes
                 IRPS       Imposto sobre Rendimento de pessoas Singulares (income tax)
                 JUE        Janela Única Eletrónica (single electronic window)
                 LIBOR      London Inter Bank Offered Rate
                 LNG        Liquefied Natural Gas
                 MCNET      Mozambique Community Network
                 MNC        Multinational Company
                 NCB        Non-Concessional Borrowing
                 ODA        Official Development Assistance
                 OECD       Organization of Economic Cooperation and Development
                 P–A–C      Principal–Agent–Client
                 PAF        Performance Assessment Framework
                 PAP        Programme Aid Partners
                 PEP        Politically Exposed Person
                 PLAC       Pacote Legislativo Anticorrupção
                 SADC       Southern African Development Community
                 SEC        Securities and Exchange Commission
                 SME        Small and medium sized enterprises
                 SOE        State-owned Enterprise
                 SPAC       SADC Protocol against Corruption
                 TA         Tribunal Administrativo
                 TDM        Telecomunicações de Moçambique
                 TIMS       Trade Information Management System
                 UFSA       Unidade de Formação e Supervisão de Aquisições
                 UKBA       UK Anti-Bribery Act
                 UNCAC      UN Convention against Corruption
                 VA         Value Added
                 VAT        Value Added Tax
                 WB         World Bank
                 WWF        World Wildlife Fund
4   C M I R E P O RT                                                        NUMBER 6, DECEMBER 2016

    CONTENTS
                       Acronyms                                                                  3
                       Contents                                                                  4
                       Disclaimer, confidentiality of sources and credits                        6
                       Executive Summary                                                         7

                       SECTIONS
    1                  Introduction                                                            15
    1.1                Corruption Damages Development                                          16
    1.2                Mozambique: Perceptions of Corruption                                   18
    1.3                Anti-Corruption Legislation                                             20
    1.4                The Need to Measure Corruption                                          21
    2                  Economic Context                                                        23
    2.1                Aspects of the Political Economy of Mozambique                          23
    2.2                Present Macro-Economic Challenges                                       24
    2.2.1              Government Debt                                                         24
    2.2.2              Tax Collection                                                          25
    2.2.3              Import Dependence and Currency Exposure                                 26
    2.2.4              Open Economy and Global Context                                         27
    2.3                Implications                                                            28
    3                  Putting Numbers to Corruption: A Methodological Approach                30
    3.1                Approach to Case Selection                                              30
    3.1.1              The Principal–Agent–Client Model                                        30
    3.1.2              Types of Corruption                                                     31
    3.1.3              Sectors                                                                 32
    3.1.4              Time Frame                                                              32
    3.2                Methodology: Sampling, Producing Evidence and Estimating Costs          33
    3.2.1              Non Purposive Sampling and Role of the Researcher                       33
    3.2.2              Generation, Types and Qualification of Evidence                         34
    3.2.3              Data Verification and Assumptions                                       34
    3.3                Translating Evidence and Assumptions into Costs of Corruption           34
    3.3.1              Measuring Effects of Corruption                                         36
    4                  Results and Analysis                                                    37
    4.1                Overview on Results                                                     37
    4.2                The Economic Costs of Corruption                                        38
    4.2.1              Impact on Value Added, Overall and by Economic Sector                   38
    4.2.2              Impact on the Public Budget                                             39
    4.3                Discussion of Value Added Loss in a National Accounts
                       (Input-Output) Framework                                                41
    4.4                Indirect Costs and Impact                                               42
    4.4.1              On Poverty                                                              42
    4.4.2              On Public Sector and Social Welfare (Health and Education)              43
    4.4.3              On Natural Resources, Environment and Tourism                           44
    4.4.4              On Foreign Aid                                                          47
    4.5                Budget Distortions of Maintaining Political Economy
                       Prone to Corruption                                                     49
    5                  Corruption, Business and Investment                                     51
    5.1                Direct Costs and Major Corruption Concerns: Customs and Trade           51
    5.1.1              Customs and Bribery                                                     51
    5.1.2              Trade Mis-invoicing                                                     52
    5.1.3              The Single Electronic Window (JUE)                                      53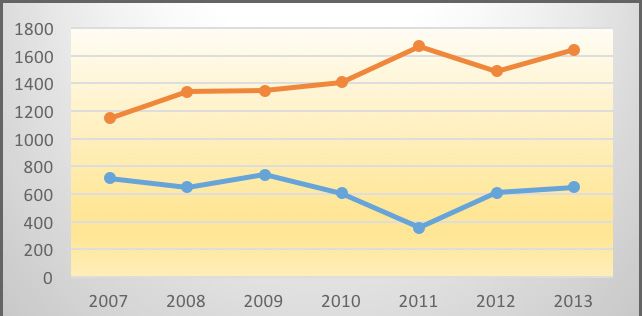
NUMBER 6, DECEMBER 2016 C M I R E P O RT 5
5.2 Indirect Costs and Impact 54
5.2.1 Impact on the Structure of the Private Sector 54
5.2.2 Value for Money, Doing Business and Investment 59
6 Conclusion and recommendations 61
6.1 Conclusions 61
6.1.1 Effects on the economy and public services 61
6.1.2 Effects on Business and Private Sector 62
6.1.3 Effects on Reputation 63
6.1.4 Corruption and Domestic Politics 63
6.2 Recommendations 64
6.2.2 Recommendations: Medium to Long Term 67
7 Annexes 68
7.1 Corruption: Principal–Agent–Client (PAC) Model 68
7.2 Categories of Corruption 69
7.3 Sample of Cases 70
7.4 Input–Output Table A and B 71
7.5 Bibliography 72
TA B L E S
Table 1: Total cost of corruption cases in relation to economic aggregates 14
Table 2: Types of corrupt relationships 31
Table 3: Sectors considered 32
Table 4: Total cost of corruption cases in relation to economic aggregates 37
Table 5: Value added (VA) and estimated cost of corruption in Million US$
and percent (2014) 38
Table 6: Budget and costs of corruption in million US$ and as a percentage 40
Table 7: Total cost of corruption cases in relation to economic aggregates 61
FIGURES
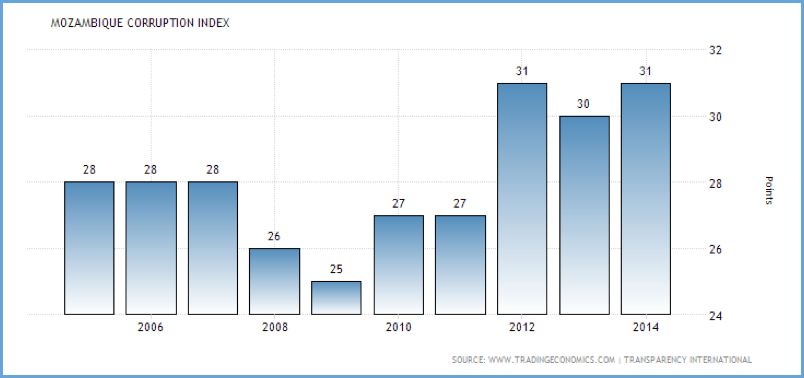
Figure 1: Mozambique: Corruption perception Index 18
Figure 2: Corruption and fraud related cases, 2007–2013 19
Figure 3: External debt stock, FDI and Revenues as % of GDP 25
Figure 4: Cost of corruption by production sector in per cent
(average 2012–2014) 39
Figure 5: Cost of corruption by budget functional sector in per cent
(average 2012–2014) 40
Figure 6: ODA as a percentage of Gross National Income, 2007–2013 47
Figure 7: ODA donor commitments, 2007–2013 48
Figure 8: Mozambique: net disbursements of ODA by type,
2007–2013 (million US$) 49
Figure 9: Principal–Agent–Client Corruption actor model 68
B OX E S
Box 1: Public tenders for construction 17
Box 2: EMATUM 35
Box 3: Brief explanation of input-output table 41
Box 4: Corruption Traffic Police 43
Box 5: Corruption in road construction 44
Box 6: Elephant poaching 45
Box 7: Non-official use of fuel and travel allowance by civil servants 50
Box 8: Attempts to privatize TDM? 58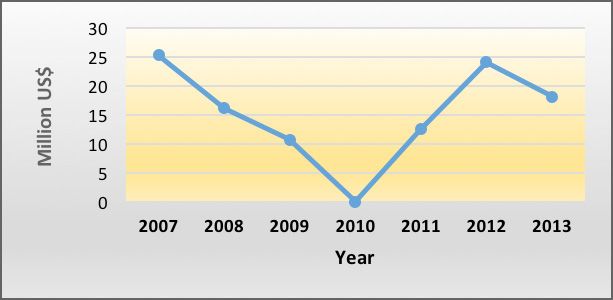
6                   C M I R E P O RT                                                   NUMBER 6, DECEMBER 2016

                    DISCLAIMER, CONFIDENTIALITY OF SOURCES
                    AND CREDITS

                    The research for this study was conducted by a team of researchers and staff of both Centro
                    de Integridade Pública (CIP) Maputo/Mozambique (www.cip.org.mz), and the Chr. Michelsen
                    Institute (CMI), Bergen/Norway (www.cmi.no), the latter operating the U4 Anti-Corruption
                    Resource Centre (www.U4.no). The opinions expressed in the study do neither necessarily
                    represent those of these institutions nor those of their senior management.
                        Their joint endeavour in this undertaking would not have been possible without
                    thorough (economic) research, the review of available literature and the information
                    provided by a considerable number of Mozambicans and foreigners living inside and outside
                    Mozambique. The informants cover a wide societal spectrum, ranging from present and
                    former government officials, technicians, representatives of public and private companies
                    inside and outside Mozambique and members of the Judiciary. For obvious reasons, the
                    identity of the sources cannot be revealed.
                        Credit is also due to Aled Williams, Senior Advisor at U4/CMI for thoroughly reviewing
                    an earlier version of this report. The authors are also grateful to two peer reviewers,
                    contracted by CMI/U4, for pertinent observations and critical comments, as well as to the
                    copy editor of this report. Special credit is given to the CMI U4 team and the U4 Director,
                    Mr Boris Divjak, for hosting a methodology workshop for this study in August, 2015 as
                    well as their valuable contributions to this report.

    No nosso país a incompetência e a ilegalidade,
    quando não são premiadas, facilmente se
    refugiam na impunidade.
                  In our country incompetence and illegality,
              if not awarded, easily take refuge in impunity.
    – Rui Baltazar Alves, former Minister of Justice, of Finances and
    former President of the Constitutional Council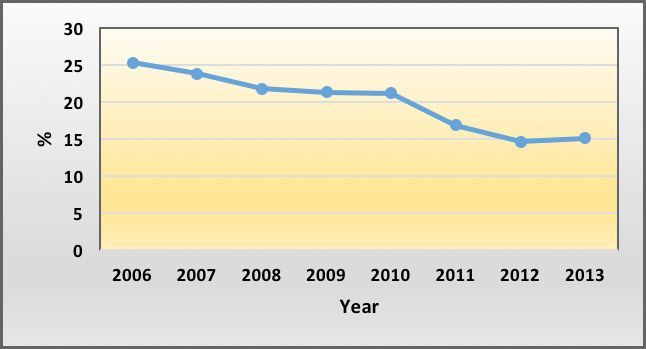
NUMBER 6, DECEMBER 2016                                             C M I R E P O RT   7

EXECUTIVE SUMMARY

Introduction and overview

What is the price that Mozambique has to pay for the widespread
corruption in the country? What is the cost of corruption for the
Mozambican economy, the state and its people? The present study aims
at providing succinct answers to those questions.

In a nutshell: the estimated average annual cost of corruption, as observed
during the ten years from 2004 to 2014, is up to 4.9 billion US $, equivalent
to around 30% of the 2014 GDP and 60% of the 2015 budget. This burden
caused by corruption is certainly crippling for the budget, the economy,
business and socio-economic development and welfare.

The present study is the result of five months’ worth of intensive work
of a study team composed of researchers and staff of both Centro de
Integridade Pública (CIP) Maputo/Mozambique (www.cip.org.mz), and
the Chr. Michelsen Institute (CMI), Bergen/Norway (www.cmi.no), the
latter operating the U4 Anti-Corruption Resource Centre (www.U4.no).

It is hoped that this study, launched on the 9th of December 2015, the
International Anti-Corruption Day – an occasion which also marks the
10th anniversary of CIP – provokes the necessary and wide debate on
the causes and implications of corruption in Mozambique and ways to
curbing it and thus easing its burden on state, economy and society.
8   C M I R E P O RT                                                    NUMBER 6, DECEMBER 2016

    The background, methodology and findings of the study are summarised as follows:

    Corruption: International and national context

    An increasing body of literature demonstrates how corruption damages the social fabric
    of a society and has toxic effects on the economy. Others argue that corrupt practices may
    ‘grease the wheels’ of economic growth and be a means of economic necessity and political
    settlement among elites in development countries (Khan, 2004). However, one needs to
    consider that one type of corruption may be more damaging than another. However, the
    overall net effect of widespread and endemic forms of corruption, as the overwhelming
    weight of studies and analyses indicate, is damaging to an economy and retards development
    (Lambsdorff, 2007). The argument of corruption ‘greasing the wheels’ and contributing
    positively to economic development is thus difficult to uphold.
        The damaging effects of corruption, or rather the perception thereof, are measured
    globally, e.g. by Transparency International (TI) through their global Corruption Perception
    Index (CPI). And the damaging effects on economic growth, poverty, income distribution,
    investment, capital productivity and social sectors such as health and education among
    others are being studied worldwide. Ten years ago, the World Bank estimated that each
    year, 20 to 40 billion US$, corresponding to 20% to 40% of official development assistance,
    are stolen through high-level corruption from public budgets in developing countries
    and hidden overseas (cited in Wickberg, 2013:2). A recent study by researchers of the U4
    Anti-Corruption Resource Centre (U4) and the Chr. Michelsen Institute (CMI) in Norway
    concludes that corruption not only undermines development and reduces the effectiveness
    of development aid, but also damages poor people disproportionally, given that illicit
    financial flows are a consequence of flourishing corrupt practices, often amongst the rich
    in society. The authors estimate that an amount of up to 1 trillion US$ is drained every
    year from developing countries (Johnson et al., 2015).
        Regarding the African continent, it has been estimated that ‘during the 1990s corruption
    cost African economies about 148 billion US$ per year, or about 25 percent of Africa’s
    total output’ (Wickberg, 2013). Other reports show that during one year, corrupt African
    politicians and civil servants divert amounts in excess of 30 billion US$ in development
    aid to foreign bank accounts. The impact of corruption is especially hard on the poor with
    estimates showing that low-income households in Africa spend as much as 2–3% of their
    income on bribes (Kimenyi & Mbaku, 2011). The real illicit flows from Africa grew at an
    average rate of 12.1% annually over a 39-year period. Illicit flows of money from Africa as
    a percentage of Gross Domestic Product (GDP) stand at some 8% (Astorga et al., 2012).
        According to the most recent global Corruption Perception Index (GPI) in 2014,
    Mozambique holds position 119 of 175 countries, with a score of 31 points in a range between
    0 (highest) and 100 (lowest). Compared with previous years, there is not much of a change
    in terms of score (2012: 31; 2013: 30), although Mozambique slightly improved its overall
    position from the rank of 123rd which it held in 2012. In the African context, Mozambique,
    together with Sierra Leone and Tanzania, ranks 20th in the list of the 20 most corrupt
    countries in Africa. The rather unchanging situation during the past three years is also
    reflected in the World Bank’s Country Policy and Institutional Assessment (CPIA) indicator
    on transparency, accountability and corruption in the public sector. Mozambique, with its
    score of 3 (on a scale of 1 = low and 6 = high) being constant since 2011, holds a position
    somewhere in the middle.
        In the Ibrahim Index of African Governance (IIAG), Mozambique, scoring 52.2 (out of
    100) holds a middle position, ranking 22nd out of all 52 African countries assessed. The
    country scores lower than the average in Southern Africa, and the overall score has slightly
    deteriorated since 2009 (by –2.2 points). The IIAG’s (partial) accountability index’ overall
    accountability score decreased by 3.3 points between 2009 and 2014. This index includes
    aspects such as corruption in the public sector (including office bearers in government and
    public administration) and in rural areas, accountability and transparency, abuse of office
    and diversion/misuse of public funds. There has been a negative change in this index since
NUMBER 6, DECEMBER 2016 C M I R E P O RT 9
2009, with the exception of the sub component ‘Access to Information’.1
It is known from international comparative studies that, on average, the increase in the
CPI of one unit triggers a 0.59 percentage point decrease in the growth rate of per capita
income (Ugur & Dasgupta, 2011). Under this assumption, corruption in Mozambique would
have had no effects on growth since the corruption perception indices have remained more
or less constant over the past three years.
Concerning the domestic efforts to gauge corruption in Mozambique, the second national
Assessment of the Perception of Corruption was commissioned in 2010 by the Ministry of
Public Service. The results show that police, licensing departments, procurement units
and customs services, as well as the health, education services and justice, are considered
to be foci of endemic corruption by businesses and households. Corrupt practices are
perceived to be most frequent in the capital Maputo, the centre of political, governmental
and administrative power. The government (politicians and government officials),
followed by multinational businesses and drug traffickers are institutions perceived to
have a considerable influence on corrupt practices. Another study suggests that the foci
of corruption in Mozambique are Public Financial Management (budget processes; public
procurement; revenue administration), the judiciary, police, and environment, natural
resources and extractive industries (Martini, 2012).
According to the 2014 annual report of the Attorney General to Parliament, between
2012 and 2013 an accumulated total of 876 corruption related cases, including fraud and
embezzlement, were registered with the institution and its subordinated Central Anti-
Corruption Agency (Gabinete Central de Combate a Corrupção – GCCC) and its regional
delegations. Out of these, 296 indictments were made with 138 cases being judged (PGR,
2014). The total of all registered corruption-related cases only represents 2% of all criminal
cases during that period. The total damage to the state’s treasury attributable to corruption
was estimated to be around 2 million US$.
The crux with this type of information is that little data is based on targeted specialised
research, or, as in the case of the GCCC, on investigated cases, but rather on perceptions
of the problem. Hence the data produced may be vulnerable to subjective bias in terms of
values, habits, and expectations, etc., of the observer.
Taking the above perceptions as a point of departure, the research team posed the
questions: Are the above assumptions on the dimension of corruption and its perceptions
plausible? Is there an observable shift in major forms of corruption? Can an alternative
methodology and way of measuring and estimating the real cost of the corruption to the
economy be employed, to gain a better understanding of and gauge the immediate, direct
and indirect effects of corruption on an economy?
The present study takes up the challenge of measuring corruption using the case of
Mozambique. We introduce and apply an approach to measure corruption and its effects
on the economy, by quantitative estimates for a considerable number of cases of corruption
either revealed or researched. The approach is informed by recent studies on measuring
corruption (CMI, 2014; DFID, 2015). We thus attempt to take the approach of measuring
perceptions of corruption considerably further by providing informed estimates. The aim
is to make policy makers and the public aware of the deadweight burden that corruption
entails for socio-economic development; an oppressive burden, which households, public
and private alike, have to bear. With a clearer understanding of that burden and the elements
of which this is composed, the perspectives on avenues and measures to reduce or partially
eliminate that weight may become clearer.
A brief look at the economy
As corruption is damaging to the economy, we first seek to understand the character of this
damage, and its consequences, regarding structural and cyclical aspects of the Mozambican
economy.
From a structural perspective, Mozambique’s formal economy, as reflected in national
1 The Right of Access to the Information Act was promulgated on the 29th of December 2014.10 C M I R E P O RT NUMBER 6, DECEMBER 2016
and international statistics and documents, is characterised by an export-oriented extractive
economy, in which little capital is retained and accumulated for domestic investment and
economic diversification, and industrialisation. This type of economy is ‘porous’ (Castel-
Branco, 2015), i.e. open and exposed to the volatility of global markets and the self-interests
of international financial capital. Capital investment is primarily ‘rewarded’ overseas and
not within the country, e.g. in the sense of revenue, since most of the megaprojects have
been benefitting from generous tax holidays and other privileges (CIP, 2013a; b). With its
high degree of openness, porosity and neglect of the small scale agriculture and inward
oriented industrialisation, the economy does, in its structure, resemble that of its colonial
predecessor. Little transformation has taken place, especially in favour of the interests of
small-scale agriculture and the rural population at large which constitutes the overwhelming
majority of the country’s population (Mosca, 2011).
From a political economy perspective, Mozambique’s economy may be characterised
as one in which a predominant party, Frelimo, has established hegemonic power over the
state, the economy and the resources the country is endowed with. The established social,
political and economic order has been characterised as a Limited Access Order (Levy, 2012),
i.e. an order in which access to benefits is limited to those belonging to the established
hegemonic elites and those who support them in a clientilist relationship. These elites can
be considered to be self-serving principals or patrons, who consolidate power by organising
groups of clients through offering financial, organisational, economic, etc., benefits and
access to resources in exchange for their support. The relationship and distribution of
power, resources and influence do not necessarily take into consideration the structure and
dynamics of formal productive institutions, i.e. the formal economic and fiscal system. For
this reason, opportunistic economic behaviour and all forms of rent seeking and predation
as well as corruption, are intrinsically part of a clientilist political economy (Khan, 2010).
The economic outlook for 2016 is characterised by an interaction of a number of
constraining factors which produce considerable budgetary constraints, and less space
for manoeuvre regarding spending on priority social sectors, recurrent cost (salaries),
infrastructure investment and debt repayment. Others speak of an economic crisis bound
to worsen, and requiring stabilising measures, such as a loan by the IMF to the country.2
The following are amongst the constraining factors:
a. Despite a projected growth of the economy of 7% (in constant price terms) for 2015,
corresponding roughly to a per capita growth rate of 4.6% under the assumption of
2.4% population growth per annum, there are clear signs of contraction. The recent
downward adjustment of the annual growth projections (of initially 8% or more) is
indicative of a less favourable global and domestic environment for the Mozambican
economy in the near future with increasing economic, investment and fiscal risks
(IMF, 2015), and the prospects for the gas business become less certain than they
were during the past few years due to globally depressed energy (oil and gas) prices.
b. Mozambique’s total public debt (foreign and domestic), measured as a percentage of
GDP, increased between 2012 and 2015, from around 40% on average between 2008
and 2014 to well above 50% in 2014, and is expected to reach almost 60% in 2016 (IMF,
2015). In nominal terms, public debt increased from 4.8 billion US$ in 2012 to 7 billion
US$ in 2014, where 1.5 billion US$ thereof are debt incurred by three ‘projects’ financed
by Non Concessional Borrowing (NCB), namely EMATUM, the Maputo-KaTembe bridge
and the Maputo Ring Road, the latter two are financed by China. Reliance on NCB
does not only exhaust the cushion of credit for projects promising short to medium
term returns, it may also trigger a spiral of more financing needs or more borrowing,
and/or a reduction in the budget deficit through raising of revenue and/or reduction of
spending. Both have a negative impact on private sector activity and growth and thus
on revenue generation (Staines & Nucífora, 2010). The increasing indebtedness and
2 Joseph Hanlon, More austerity & price rises predicted in economic crisis. MOZAMBIQUE 304. News reports & clippings.
25 November 2015.NUMBER 6, DECEMBER 2016 C M I R E P O RT 11
the present mix of debt (NCB/CB; domestic/foreign) may have caused the downgrading
of Mozambique’s creditworthiness by two agencies, Standard’s and Poor and Fitch.
c. The generation of revenue by the Autoridade Tributária de Moçambique (AT) may
slow down, since it appears that the tax collection returns from increased fiscal
effort are declining. The Value Added Tax (VAT) collection may be indicative: with
around 8% of total tax collection on average, it has been almost constant during
the past five years. There has been an increase in direct taxes on income and profit
(ISPS and ISPC) during the past couple of years, attributable, in the case of ISPC,
to revenue from taxing exceptional windfalls caused by the sale of concessions,
notably in the gas exploration business. Increasing the income and profit tax
yield from non-extractive industries of the economy and from individuals will
be hampered by the present unfavourable economic cycle and the already high tax
burden, which drives business to evade tax and ‘escape’ into the informal sector.
d. There are very strong signals from various branches of business all over the country
(tourism, manufacturing, agriculture, real estate, etc.) that the economy is slowing down,
with an exception of some investments and projects in the extractive industries (e.g.
ruby and graphite mining in Cabo Delgado, and gas/oil extraction in Inhambane). Não
há dinheiro (There is no business) is a complaint often heard throughout the country
and across various branches of industry. Inflows of Foreign Direct Investment (FDI)
had its boom period between 2010 and 2013, with a decrease in 2014. Depending
on the world economic trends and commodity prices, this tendency may continue.
The depreciation of the Metical, particularly against the US$,3 has advantages for
exporters, but hits importers by increasing the prices of important fuel, food and
other consumer goods on which the country is structurally dependent. The dramatic
depreciation of the Metical may, however, not only be caused by a globally strong
dollar, but also by an increasing domestic demand for ‘hard currency’. This may,
in turn, mirror a reduced trust in the Metical (MT) under the present conditions of
uncertainty, and the expectations of price increases for basic commodities and food. 4
e. Regarding global factors, the global demand and price prospects for the major
Mozambican exports (namely minerals, coal, metal/aluminium and some agricultural
products) are not very encouraging, with the exception of unprocessed tobacco, rubies
and graphite. Low commodity prices, in turn, increase the pressure on the balance
of trade and services. Mozambican energy exports to the region, a major potential
market, have suffered from the lack of commitment of potential buyers, notably
South Africa. China’s economic downturn will certainly affect its demand for
resources, and its capacity to support Mozambique with NCB facilities, apart from
putting a question mark behind its role as a potential market for Mozambican LNG.
Furthermore, Mozambique’s donor landscape and volumes of aid have also suffered
profound changes. This is mainly felt within the Programme Aid Partners (PAP) group,
which gives budget support to the Mozambican Treasury in various forms. Not only
has the total number of PAPs been reduced from 19 to 14 in 2015, but the volume of
aid has also decreased substantially, contributing to financing the budget with less
than 30% at present as compared to around 50% about ten years ago. Gone are the
days in which the donors generously covered large parts of the annual budget deficits.
In summary, this means that the annual budget deficit which in 2014 exceeded 10% of
GDP and is already one of the highest in Sub-Saharan Africa will put the government under
continued fiscal stress, with less options and facilities.
3 In one year, the value of the MT against the US$ dropped by 45%.
4 At the time of writing, the public electricity utility announced an increase of its tariffs by almost 20%. See: Mozambique:
Electricity Prices Rise. http://allafrica.com/stories/201511070339.html.12 C M I R E P O RT NUMBER 6, DECEMBER 2016
Under these circumstances, the government will need to identify domestic fiscal reserves
and ways of getting the economy going. Obviously, fighting corruption may help achieve
these two objectives, simultaneously ‘killing two birds with one stone’ and the present
study aims at providing data and information to do so. From a policy perspective, it is
important, for this reason alone, to have a realistic estimate of the cost of corruption and
in which sectors of state budget and economy the cost arises. We also need to know what
public resources that may be mobilised if effective anti-corruption action is vigorously
taken forward.
Methodology
On the basis of a comprehensive review of literature, the study team designed and employed
an approach which distinguishes actors in corrupt transactions, type of corruption and
the relevant sectors in which corruption manifests itself. The methodology allows us to
generate and verify evidence of corrupt practices, by type and sector. This ‘evidence’ is not
evidence in sensu stricto, i.e. facts and figures, but rather reasonable, plausible assumptions
on monetary values involved in corrupt transactions. Quantitative estimates of the ‘cost’
of each case or practice were fed into a calculation framework. This framework enabled
the aggregation of the monetary value “’cost’” of individual cases to illustrate the total
damage caused by corruption to the state budget and to assess, with reasonable plausibility,
its impact on macro-economic aggregates such as GDP or Value Added produced by the
Mozambican economy.
Based on a Patron/Principal (P)–Agent (A)–Client (C) actor model (Lambsdorff,
2003), the methodology includes the distinction between five types of corruption, from
embezzlement, via stealing of public resources, bribing and extortion, to collusion and cases
of public private partnerships, in which the distinction of actors becomes blurred and a
conflict of interests may occur. The research team also added the dimension of budgetary
distortions to maintain a corrupt system producing benefits, notably for P.
The approach also ensured that a relevant composition of sectors in which corruption
is known to be happening was selected. A wide range of relevant sectors were identified,
ranging from public finance, customs, police via the social sectors (health, education) to
economic sectors (construction, fisheries, telecommunications, environment and natural
resources). As a result, a case matrix was constructed consisting of the predetermined
sectors and the predetermined types of corruption. The time frame to be considered was
2002 to 2015, covering a period of 13 years.
With this matrix as a working tool, the team proceeded to generate evidence and data
on corruption aimed at populating the matrix in order to create a purposive sample. This
type of sampling, sometimes also referred to as judgemental or expert sample (Richie et
al., 2003; Battaglia, 2008), is non-probability based, i.e. not a sample based on statistical
representativeness but an intended or purposive selection of cases across a wide spectrum
that includes both corruption sectors and types. Such a sample is said to be logically, not
stochastically representative of all cases of corruption. Mainly using expert knowledge for
the selection of evidence (particularly from CIP), purposive sampling allowed the team to
produce a matrix with 36 cases, covering all predetermined corruption types and sectors.
Care was taken to assure a good mix of small cases (petty corruption), medium cases (with
estimated values of between 10 and 100 million US$ per corrupt transaction) and big cases
(above 100 million US$).
Taking into consideration the secretive nature of corrupt deals as well as the advantages
of the purposive sampling, the researchers defined ‘evidence’ in a pragmatic, broad way. In
their understanding, ‘evidence’ includes scientific and research publications and studies,
published or unpublished newspaper reports of professional and investigative quality, and
information generated through ‘elite interviews’ conducted by the researchers. The latter
are interviews, conversations and discussions with individuals who have insider knowledge
and thus are able to provide insights and information about an event and/or a process (e.g.
a corruption case), understanding its trajectory and outcomes. A total of 47 oral testimonies
were collected covering a wide range of sources (institutions of the state and government,
businesses, CSOs, diplomatic missions, etc.).NUMBER 6, DECEMBER 2016 C M I R E P O RT 13
It should be stressed again that considerable care was taken to ensure that the ‘evidence’
gathered by the methods described above was verified and, where possible, tested against
information from other sources. In particular, information on monetary values of corrupt
deals was double checked and subjected to plausibility control. Even so, those monetary
values were not considered to be a fact (which, in the case of corruption, is hard to establish
anyway by academic researchers), but considered as more or less plausible assumptions.
In all cases studied, assumptions on minimum and maximum values were made and fed
into a databank which allowed the aggregation and processing of data and the calculation
of the direct and indirect impact of corruption.
The data and assumptions gathered were introduced in a tool for economic analysis,
which makes it possible to gauge the impact of accumulated values of corrupt transactions
contained in the sample matrix on the budget and other macro-economic data, notably
Value Added (equivalent to the value of goods and services produced within the country
over a year). This is done within a national accounts framework.
To make a comparison with annual budget and value added figures, the approach
has been to express annual cost as a yearly average of the three most recent years for
which national accounts and budget data are available, namely 2012–2014. The annual
cost of corruption is thus defined as the annual average over these three years. A further
assumption is that corruption does not just take place in the year in which it is discovered. It
is reasonable to believe that most types of corruption take place year by year at approximately
the same level as when discovered, unless there is evidence that a certain type or case of
corruption has been stopped. In a few cases, however, corruption cases are stand-alone
cases. In this regard, the amount involved was split into equal parts over the three-year
period 2012–2014.
Results
The methodological and analytical framework described above produced the aggregated
values of the corruption cases for the 2004–2014 period, which allows a calculation of
the overall direct cost of all 36 documented cases. The assumption, and this needs to be
emphasized again, is that the data used in the sample merely represents plausible estimates
of monetary values involved in the registered corrupt deals.
The picture emerging from the analysis is that of a Mozambican economy and, by
implication, society at large, severely crippled by corruption.
The aggregated value of the corruption costs (as represented in the sample) during the
period 2002 to 2014, at current prices, is 4.8 to 4.9 billion US$, equivalent to around 30%
of the 2014 GDP. This percentage is well above the average figure for all African countries
cited in section 1. It means that, on average over the period covered by the sample, the
annual damage is close to 500 million US$ per year.
The sectors (cases) in the sample in which corruption is most pronounced and with
amounts to considerably above 200 000 million US$ per case each are:
• Customs;
• EMATUM;
• Overpricing of liquid fuel imports;
• Procurement in the telecom sector;
• Procurement in the construction/public works sector.
In the period under observation, corrupt practices in Customs can be identified as the
major cause of damage to the economy, involving large sums of illicit transactions. Customs
related bribing, underreporting and avoidance of import tax payments have cost the state
dearly. The single most important loss of public resources recorded in the sample is related
to the mounting of a Customs-shadow system aimed at circumventing the official MCNET
system. It has cost the country an estimated 2.5 billion US$, i.e. in excess of 1 billion US$
more than the total expenditure budgeted for education and health (1.4 billion US$) in 2015.
But oral sources also point to a growing importance of State-owned Enterprises (SOEs)
and particularly private companies owned by state institutions as well as Private Public14 C M I R E P O RT NUMBER 6, DECEMBER 2016
Partnerships (PPPs) as hubs of corruption. Damage inflicted by specific types of corruption
associated with such companies, including collusion and manifest conflict of interest, is
second to that caused by illicit and corrupt practices in Customs.
The table below provides the dimension of the total cost due to corruption during the
period under observation (10 years) in relation to key macroeconomic aggregates for 2014
and 2015.
TA B L E 1 Corruption Cost as percentage of %
Total cost of corruption
Expenditure 2014 (executed) 71.7
cases in relation to economic
GDP 2014 30.8
aggregates (in %)
Total investment 2015 (budget) 195.2
Source: Authors, Education spending 2015 (budget) 362.8
based on DNO, 2015.
External budget component 2015 (budget)* 287.1
* ODA + credit.
The monetary value of the corruption cost accumulated over the period covered by the
sample could have doubled the investment budget for 2015 and more than tripled planned
expenditure in education. And that amount would have covered almost three times the
amount of aid plus the external credit budgeted for 2015.
It can also be seen from the dataset that corruption is estimated to have caused a loss
of about 11.6% of the tax revenue average for the three years 2012 to 2014. Together with
the loss in expenditure of 4.8 billion US$ for the same period, the state has lost 5.3 billion
US$ or 86% of the average 2012–2014 budget. This means that the state could deliver
public goods and services worth 205 US$ per capita less than it could have done without
corruption.
The impact of corruption on the economy is equally severe. In terms of Value Added, it
is responsible for the loss of 2.5 billion US$ or more than 17% of the average Value Added
between 2012–2014, meaning that each person would have lost 98 US$ per year due to
corruption or some 18 per cent compared to what their income would have been without
corruption. Most affected by corruption were the building/construction sector, as well as
fisheries, services and transport, and communication.
Corruption produces far-reaching, indirect effects on the provision of public services, and
on poverty and social welfare as a whole. The data provided by the study largely confirms,
for Mozambique, conclusions drawn from other, comparative material. Considerable fiscal
resources drained by corruption could have been put to good use in the priority sectors,
notably education and health.
The impact on the private sector, analysed in a differentiated way in section 5, is also
considerable, producing additional costs, lack of competitiveness and crowding out effects
on the private sector benefitting the public sector and State-owned Enterprises (SOE) in
particular. The evidence produced by the study shows that some foreign direct investment
worth about 90 million US$ has not been realized and that major investors, ruled by
national and international anti-corruption codes, have to think twice before investing in
and partnering up with national firms, both private and public ones. This implies a risk that
‘clean investors’ may be crowded out in favour of investors with a less favourable reputation,
posing a reputational risk for Mozambique as a favourable destination of foreign investment.
Recommendations
The study provides a series of short and medium term recommendations aimed at curbing
the cost of corruption through targeted anti-corruption measures. It suggests three areas
of reform which, in a long-term perspective, need to be addressed to lower the exposure of
the country to corruption, i.e. a thorough rethinking of the future Mozambique, alluded to
by President Nyusi at a conference in June 2015, is part of a long-term solution.
It is hoped that the present study is seen as an input into that rethinking process.NUMBER 6, DECEMBER 2016 C M I R E P O RT 15 1. INTRODUCTION In this study, the authors attempt to quantify the effect of corruption on the Mozambican economy and the welfare of the Mozambican people, using a macro-economic approach for estimating the costs of corruption. Although this attempt will certainly be questioned by various stakeholders and the government, given the methodological difficulties associated with the undertaking – and the resultant estimates of the costs of corruption in Mozambique, the exercise is considered useful for obtaining a ‘palpable’ understanding of the weight of corruption on the Mozambican economy and in limiting the space for economic and fiscal decision-making of the government and other economic actors. Having said this, the study does neither delve into the analysis of the main causes of corruption in Mozambique, and into the political processes which lead to corrupt practises in general and in the cases documented in this study. Nor does it claim to show the reader a ‘strategic highway’ to combat corruption, considered to be endemic, despite its suggestions (in Section 6.2) to curb certain practises, measures aiming at undermining the confidence between the corruptor and corrupted, as suggested by Lambsdorff (2007). An analysis of the political and systemic causes of corruption would have required a more profound and broader framework of analysis of the Mozambican political economy. Studies of this type do exist and some of their findings were indeed used in the present study (see the bibliography). However, the political economy analyses in their various forms, many developed and applied by bi-and multilateral donors,5 have been criticised for being largely donor driven and prone to excluding recipient states of aid in their design, serving, in practice, ‘as a donor-centric diagnostic and risk management tool’ in aid partnerships, particularly those associated with budget support (Fisher & Marquette, 2014: 16). Instead, the authors have opted for an economic calculation of the cost of corruption. In the absence of an established universal methodology for such an undertaking, they saw themselves challenged with developing a methodology to arrive at figures used as indicators for the economic costs of corruption. In doing so, they may have been breaking new ground in corruption analysis and possibly providing a tool to decision makers for strategic corruption assessment and for defining priorities of anti- corruption measures. 5 For an overview see: Boak (2011).
16   C M I R E P O RT                                                      NUMBER 6, DECEMBER 2016

     After a general introduction in this first section, we set the theme of the
     study, sketching, in section 2, the salient structural and present cyclical
     features and challenges of the Mozambican economy. This is necessary
     to understand causes and potential remedies for the present fiscal and
     economic bottlenecks, caused by many domestic and international factors,
     corruption included. If intensified anti-corruption measures are considered
     to be part of the solution to overcome present budgetary and economic
     constraints, the economic dimension and facets of corruption need to be
     understood and measured. Based on an innovative methodology which
     allows a high degree of confidence in measuring and gauging the impact
     of corruption in its various forms (section 3), we present and discuss, in
     section 4, the results of our corruption analysis. Section 5 is specifically
     dedicated to the impact of corruption on business and investment, since
     both increasingly have an important role to play in Mozambique’s socio
     economic development. Section 6 provides final conclusions and makes
     recommendations for elements of an anti-corruption strategy.

     1.1. Corruption Damages Development

     Every year, large amounts of resources destined for human welfare and development
     are wasted through corruption, all over the world. ‘Wasted’ may not even be the most
     appropriate term, since corruption is preventing that the resources are applied to producing
     benefits for all citizens, in the sense of providing public goods and services to groups of
     people, children and old aged included, and society at large. Instead, public resources,
     including fiscal resources, illicitly appropriated through corrupt practices, become privatised
     and shared between individuals and small groups, including families, businesses, political
     parties, etc. These individuals or groups engage in a corrupt relationship motivated by low
     qualities of human behaviour such as greed, gaining personal advantages over others and
     securing positions of power, in short, by individual and collective egotisms. The custom
     of corruptors and corrupted in their confidential relationship of seeking individual mutual
     advantages in various forms is not driven by a sense of responsibility for and engagement
     in collective social welfare, human development and access for all citizens to primary
     public services. At the same time, in many countries, corruption is an accepted cultural and
     economic practise and considered as part of doing business and its cost for a company are
     sometimes even deductible in its tax declaration. The dimension, practises and economic
     weight of corruption in an economy thus result from a combination of various political,
     economic, cultural, historical and institutional factors of a given political economy of a
     country of course including the strengths (or weaknesses) of institutions and policies aimed
     at curbing corruption and minimising its effects on the economy and the day-to-day life
     of the population.
          For the authors, there is, however, no doubt that the ‘net effects’ of corruption are
     damaging for the social fabric of a society and have toxic effects on the economy, even if
     it is admitted that corrupt practices may contribute to economic growth and be a means
     of economic necessity and political settlement among elites in development countries
     (Khan, 2004). The authors agree with a number of studies and analyses (e.g. cited in
     Lambsdorff, 2007, DFID, 2015) which suggest that the net effect of corruption, especially in
     its widespread and endemic form, is damaging to the economy and retards and undermines
     development. This is particularly the case in poor developing countries, where corruption
     tends to be widespread and endemic.
          Another academic argument to explain corruption is that it facilitates economic
NUMBER 6, DECEMBER 2016 C M I R E P O RT 17
exchange, by overcoming and circumventing cumbersome
regulation and red tape. However, this argument has Box 1:
commonly been countered by observing that cumbersome Public tenders for construction in Mozambique?
regulation and corruption are two sides of the same coin.
For example, Kaufmann and Wei (1999) show that high Case:
levels of corruption are positively associated with the Office and residential buildings of the state, infrastructure
managers’ waste of time on bureaucracy and bureaucrats.
This suggests that regulation should commonly not be Type:
regarded as exogenous in an analysis of corruption. And Bribing, collusion
Lambsdorff has argued that the net effect of corrupt practice
is clearly damaging to any economy (Lambsdorff, 2007). Sector:
The argument used in the 1970s of corruption ‘greasing the Construction, public works, public administration
wheels’ and contributing positively to economic development
is thus difficult to uphold. In fact, it has been laid to rest by Year:
scholars working on corruption and providing evidence of 2013
the corrosive and detrimental effects of corruption on the
economy and society, particularly in developing countries Evidence:
(Hope & Chikulo, 2000; Lawal, 2007, Lambsdorff, 2007, REO, oral, high fidelity
DFID, 2015).
It is because of the negative net effects of corruption on Description:
economic growth, poverty, income distribution, investment, Many sources interviewed for this study allege that there
capital productivity and social sectors such as health and is a large degree of corruption in the tendering for public
education, among others,6 that a number of initiatives construction contracts.
exist that try to quantify the problem (e.g. Transparency
International’s Corruption Perception Index), and this is the Calculation base:
reason why the phenomenon is being studied in various All budget items covered by the economic expenditure
continents and globally. Ten years ago, the World Bank classifier 211000 (construction, buildings) for recurrent
estimated that 20 to 40 billion US$ are stolen through expenditure (funcionamento) and investment (internal and
high-level corruption from public budgets in developing external components) at all levels of government (excl.
countries and hidden overseas every year. This corresponds municipalities): 1.028 billion US$ (2013).
to 20% to 40% of the official development assistance (cited
in Wickberg, 2013: 2). A recent study by researchers of the Assumptions:
U4 Anti-Corruption Resource Centre (U4) and the Christian All public construction projects are tendered out
Michelsen Institute (CMI) in Bergen, Norway, concludes Percentage of total budget drained by corruption:
that corruption does not only undermine development Minimum: 10%
and reduce the effectiveness of development aid, but also Maximum: 30%
disproportionally affects poor people, given that illicit Medium: 20%
financial flows are a consequence of flourishing corrupt
practices, often amongst the rich in society. It is estimated Direct costs/damage (US$):
that an amount of up to 1 trillion US$ is drained every year Minimum: 102.9 million
from developing countries (Johnson et al., 2015). Maximum: 308.6 million
Regarding the African continent, it has been estimated Medium: 205.7 million
that ‘during the 1990s corruption cost African economies
about $148 billion per year, or about 25% of Africa’s total Equivalent to:
output. Other reports show that during one year corrupt 11.8% of projected budget deficit for 2013;
African politicians and civil servants diverted amounts in 9.0% of investment budget (2013)
excess of 30 billion US$ in development aid to foreign bank 14.2% of public salary bill (2013)
accounts. The impact of corruption is especially hard on the
poor with estimates showing that low-income households Indirect effects:
in Africa spend as much as 2–3 per cent of their income Less quality and use life of public buildings
on bribes’ (Kimenyi & Mbaku, 2011). The real illicit flows Higher maintenance or replacement cost
from Africa grew at an average rate of 12.1% annually over
a 39-year period. While illicit flows from Africa increased
from around 2% of Gross Domestic Product (GDP) in 1970,
6 For an overview, see Wickberg, (2013); DFID (2015), and Lambsdorff (2003).18 C M I R E P O RT NUMBER 6, DECEMBER 2016
it peaked at around 11% in 1987, fell sharply to below 4% for much of the 1990s, rose again
to 8% of GDP in 2007 before declining to around 7% in 2008 (Astorga et al., 2012). This
means that a considerable part of the GDP of African countries is systematically, but to
varying degrees, withdrawn from the economy, with implications for (reduced) public and
private sector spending and investment.
1.2. Mozambique: Perceptions of Corruption
How does corruption manifest itself and affect the Mozambican society and economy?
According to the most recent global Corruption Perception Index (GPI) 2014, Mozambique
holds position 119 of 175 countries, with a score of 31 points in a range between 0 (most
corrupt) and 100 (least corrupt). The lowest score globally in 2014 was 8 (held jointly by
North Korea and Somalia) and the highest was 92 (held by Denmark). Compared to previous
years, for Mozambique there was not much of a change in terms of corruption perception
(2012: 31; 2013: 30), although there has been a slight improvement in the country’s overall
position from 123rd in 2012 to 119th in 2014.7 This is mostly due to a deterioration in the
FIGURE 1 corruption perceptions in other countries. In the African context, Mozambique is perceived
Mozambique: Corruption to be the 20th most corrupt country together with Sierra Leone and Tanzania. The figure
perception Index on this page gives an overview of the CPI for Mozambique.
The lack of progress during the past
three years is reflected in the World Bank’s
Country Policy and Institutional Assessment
(CPIA) ind icator on t ransparenc y,
accountability and corruption in the public
sector. Similarly to the CPI, Mozambique
has not progressed past the score of three
out of six since 2011 (where 1 = most corrupt
and 6 = least corrupt).8
In the Ibrahim Index of Af r ican
Governance (IIAG),9 Mozambique scores
52.2 out of 100 (where 100 = least corrupt)
and again holds a middle position, ranking
22nd out of all 52 African countries assessed.
However, the country scores lower than the average in Southern Africa, and the overall
score for Mozambique has deteriorated slightly since 2009 (by 2.2 points). The IIAG’s
(partial) ‘Accountability Index’ score decreased by 3.3 points between 2009 and 2014. This
index includes accountability and transparency aspects such as corruption in the public
sector (including office bearers in government and public administration), corruption in
rural areas, as well as the abuse of office and diversion/misuse of public funds. A negative
change in this index has occurred since 2009, with the exception of the sub component
‘Access to Information’ which improved in 2015.10
From international comparative studies, it is known that, on average, the increase of the
CPI by one unit triggers a 0.59 percentage point decrease in the growth rate of per capita
income (Ugur & Dasgupta, 2011). Under this assumption, corruption in Mozambique would
have had no effects on growth since the corruption perception indices have remained more
or less constant over the past three years.
Concerning national sources, a National Assessment of Corruption Perceptions, the
7 http://www.transparency.org/cpi2014
8 http://data.worldbank.org/indicator/IQ.CPA.TRAN.XQ
9 http://www.moibrahimfoundation.org/iiag
10 The Right of Access to Information Act was promulgated on the 29th of December 2014.NUMBER 6, DECEMBER 2016 C M I R E P O RT 19
second of its kind,11 was commissioned in
2010 by the Ministry of Public Service. The
survey for the study was conducted by the
Higher Institute of International Affairs’
Centre of Strategic and International
Study (ISRI-CEEI) subordinate to the
Ministry of Foreign Affairs. The results
demonstrate that, in general, police,
licensing departments, procurement units
and customs services, and the health and
education services, are considered to be the
most corrupt institutions by businesses and
households. According to the survey, both
businesses and households also believe that
the courts are endemically corrupt. Corrupt
practices are perceived to be most frequent
in the capital Maputo, the centre of political,
governmental and administrative power, FIGURE 2
as well as in Maputo Province, and the Niassa and Zambézia Provinces. Government Corruption and fraud related
(politicians and government officials), followed by multinational businesses and drug cases, 2007–2013
traffickers are perceived to have most influence over corrupt practices.
The findings by ISRI-CEEI generally overlap with other studies. According to a U4 Expert Source: PGR, 2014
Answer on the status of corruption and anti-corruption in Mozambique (Martini, 2012),
the main corruption problems in Mozambique pertain to a) Public Financial Management
(budget processes; public procurement; revenue administration), b) the Judiciary, c) Police,
and d) Environment, Natural Resources and Extractive Industries. The U4 Expert Answer
also identifies political corruption, cronyism and patronage networks as major causes of
corruption.
According to the most recent annual (verbal) report by the Attorney General to
Parliament, between 2012 and 2013 an accumulated total of 876 corruption related
cases, including fraud and embezzlement, were registered with the Institution and its
subordinated Central Anti-Corruption Agency (Gabinete Central de Combate a Corrupção
– GCCC) and its regional delegations. Out of these, 296 indictments were made, with 138
cases leading to prosecutions (PGR, 2014). The total of all registered corruption-related cases
represents only 2% of all criminal cases during that period. According to these figures, the
total damage to the state’s treasury attributable to corruption was estimated to be around
2 million US$.12 As illustrated by this report, this figure is far too low in our view and the
result of the limited capacity, capability and reach of the Mozambican judicial system. The
limited capacity of the aforementioned institutions is illustrated in figure 2, which shows
that only a small number of cases actually result in prosecutions, with the vast majority
not even leading to indictments.
The limited capacity of the GCCC has also been a hot topic in the discussions of anti-
corruption measures by Mozambican civil society. CIP noted that the Attorney General’s
2015 report to parliament did not reflect the true picture of corruption prevailing in
Mozambique due to the fact that the AG report has too narrow a focus on ‘petty corruption’
(e.g. in schools, police and health services). Furthermore, according to CIP, some known
cases that are in the interest of the public were simply not mentioned in the AG’s report –
for instance, major corruption cases which involved senior government officials. Finally,
CIP highlighted inconsistencies between the findings of the report and the corruption-
related results of a joint monitoring report of budget support by the government and the
11 Pesquisa Nacional Sobre a Governação e Corrupção. The first survey stems from 2004. These Surveys inform the
Government’s National Anticorruption Strategy.
12 http://www.jornalnoticias.co.mz/index.php/politica/35985-no-seu-informe-annual-ao-parlamento-pgr-apela-a-
contencao-de-discursos-sobre-violenciaYou can also read