Color over content? The impact of Color Temperature on Brand Engagement in Instagram - Universidade Católica Portuguesa
←
→
Page content transcription
If your browser does not render page correctly, please read the page content below
Color over content?
 The impact of Color Temperature on
 Brand Engagement in Instagram

 Ana Rita Martins Lopes

 Dissertation written under the supervision of Pedro Rosa

Dissertation submitted in partial fulfillment of requirements for the MSc in
Management with Specialization in Strategic Marketing, at the Universidade
 Católica Portuguesa

 April 2019
ABSTRACT

Title: “Color over content? The impact of Color Temperature on Brand Engagement in Instagram”
Author: Ana Rita Martins Lopes

When Social Media meets Marketing, endless possibilities become available for brands. Although
the wide reach of these platforms provides a suitable channel for Marketing Managers to promote
interaction with their customer base, little is known about the best practices for brands channeling
their Marketing efforts to Social Media. Instagram is one of the fastest growing platforms and a
highly potential one, with emphasis on visual content, known to perform better in terms of
engagement. However, its usefulness for brands and the impact of image features, like color, on
consumer engagement is not documented yet.
This dissertation analyzes the relationship between Color Temperature and Engagement Rate on
Instagram to understand if color influences engagement and, if so, which color hues perform better.
To this end, 450 Instagram posts were analyzed, from brands in 3 different product categories -
Women’s Fashion, Travel, and Food & Snacks.
Results showed Color Temperature directly impacts the engagement as Cool and Neutral colors
overperform Warm colors regarding Engagement Rate. Additionally, a moderator effect for
Product Category was found as the best performing colors differ with the category of the brand.
These findings suggest that Marketing and Social Media Managers should contemplate the impact
of color on their Digital Content strategy, by coordinating their content with the color temperature
that drives the higher engagement for the respective product category.

Keywords: Social Media Marketing; Engagement Rate; Color Temperature; Instagram; Product
Category; Brand Engagement.

 ii

SUMÁRIO

Título: “Cor sobre conteúdo? O impacto da Temperatura de Cor no Envolvimento com a Marca
no Instagram.”
Autor: Ana Rita Martins Lopes

Quando as Redes Sociais e o Marketing se unem, surgem inúmeras possibilidades para as marcas.
Embora o grande alcance destas plataformas garanta um canal apropriado para promover interações
Marca-Consumidores, pouco se sabe sobre as melhores práticas nestes meios, para marcas que se
focam nas Redes Sociais. O Instagram é uma das plataformas com maior crescimento e potencial,
tendo como core um conteúdo visual à base de imagens, que gera um maior envolvimento. No
entanto, a utilidade do Instagram para as marcas, e o impacto de detalhes visuais como a cor no
Envolvimento do Consumidor, é pouco discutido.
Esta dissertação analisa a relação entre a Temperatura de Cor e a Taxa de Envolvimento no
Instagram, com o fim de compreender se existe um impacto direto entre as duas variáveis, e, nesse
caso, que cores geram um maior envolvimento. Com este fim, 450 publicações do Instagram, de
marcas em 3 categorias diferentes – Moda de Mulher, Viagens e Bens Alimentares - foram
analisadas.
Os resultados demonstraram que a Temperatura impacta diretamente a Taxa de Envolvimento:
publicações com tons Frios e Neutros geram um maior envolvimento do que os tons Quentes, em
termos gerais. Além disso, foi encontrado um efeito moderador ma Categoria de Produto, sendo
que a cor com melhores resultados varia com a categoria. Estas conclusões sugerem que os gestores
de Marketing e/ou Redes Sociais devem considerar o impacto da cor no planeamento das
estratégias de conteúdo digital, tendo em atenção os tons que geram maior envolvimento na sua
categoria.

Palavras-Chave: Marketing de Redes Sociais; Taxa de Envolvimento; Temperatura de Cor;
Instagram; Categoria de Produto; Envolvimento de Marca.

 iii
ACKNOWLEDGEMENTS

 “The smallest act of kindness is worth more than the grandest intention.”

 - Oscar Wilde

To my dearest friends. To my boyfriend. To my parents. To my dissertation supervisor.

Thank you for your support and orientation. You were essential to having this thesis delivered and
all the small acts did matter.

 iv
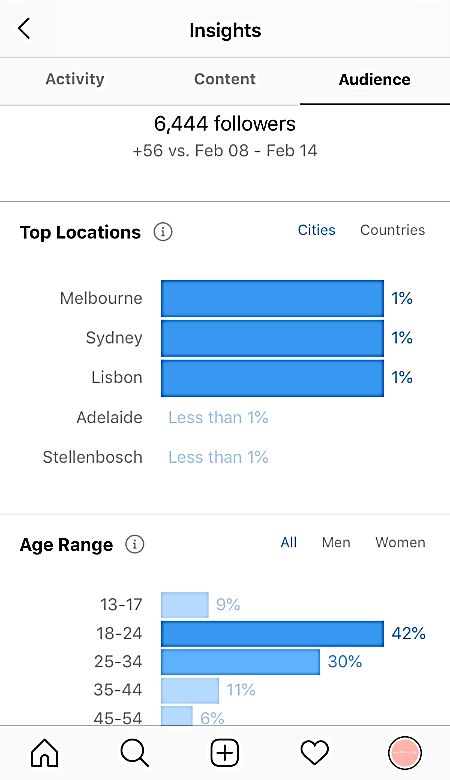
TABLE OF CONTENTS

ABSTRACT .................................................................................................................................... ii

SUMÁRIO ..................................................................................................................................... iii

ACKNOWLEDGEMENTS ............................................................................................................iv

TABLE OF CONTENTS ................................................................................................................. v

TABLE OF FIGURES .................................................................................................................. vii

TABLE OF TABLES ................................................................................................................... viii

TABLE OF APPENDICES .............................................................................................................ix

CHAPTER 1: INTRODUCTION .................................................................................................... 1

 1.1 Background & Problem Statement ......................................................................................... 1

 1.2 Aim & Scope .......................................................................................................................... 3

 1.3 Research Methods .................................................................................................................. 4

 1.4 Relevance ............................................................................................................................... 4

 1.5 Dissertation Outline................................................................................................................ 5

CHAPTER 2: LITERATURE OVERVIEW & RESEARCH QUESTIONS .................................. 6

 2.1 Digital Content Marketing ..................................................................................................... 6

 2.2 Consumer Brand Engagement ................................................................................................ 7

 2.3 Instagram as a Marketing Tool............................................................................................. 10

 2.4 The Relevance of Color........................................................................................................ 13

 2.5 Psychology of Colors ........................................................................................................... 13

 2.6 Conclusion and Hypothesis .................................................................................................. 14

CHAPTER 3: METHODOLOGY ................................................................................................. 16

 3.1 Research Approach .............................................................................................................. 16

 3.2 Research Design ................................................................................................................... 16

 3.3 Population & Sample ........................................................................................................... 18

 v
3.4 Data Collection & Analysis .................................................................................................. 19

CHAPTER 4: Results and discussion ............................................................................................ 23

 4.1 Mean Analysis ...................................................................................................................... 23

 4.2 Color Temperature ............................................................................................................... 25

 4.3 Product Category .................................................................................................................. 26

 4.4 Discussion ............................................................................................................................ 29

CHAPTER 5: CONCLUSIONS AND LIMITATIONS ................................................................ 33

 5.1 Main Findings & Conclusions.............................................................................................. 33

 5.2 Managerial and Academic Implications ............................................................................... 34

 5.3 Limitations and Further Research ........................................................................................ 35

REFERENCES ............................................................................................................................... 37

APPENDICES ................................................................................................................................ 44

 vi
TABLE OF FIGURES

Figure 1 – Screenshots of an Instagram Feed ................................................................................ 10

Figure 2 - Screenshots of an Instagram Analytics Dashboard ....................................................... 11

Figure 3 - Screenshots of an Instagram Content Analytics Dashboard .......................................... 12

Figure 4 – Example of the dominant color extraction tool ............................................................ 20

 vii
TABLE OF TABLES

Table 1 – Color hue and temperature matrix.................................................................................. 17

Table 2 - Data base variables ......................................................................................................... 21

Table 3 – Results of the Kolmogorov-Smirnov and Shapiro-Wilk normality tests ....................... 21

Table 4 – Skewness and Kurtosis of the Depende Variable Ln_Engagement ............................... 22

Table 5 – Comparison of Means by Product Category .................................................................. 23

Table 6 - Comparison of Means by Color Temperature ................................................................ 24

Table 7 – ANOVA Table results .................................................................................................... 25

Table 8 – Tukey Post-Hoc Test of the One-way ANOVA ............................................................ 25

Table 9 – Two-way ANOVA Results for the Color Temperature Product Category Interaction .. 26

Table 10 – Tukey Post Hoc Tests of the Two-Way ANOVA for Product Category ..................... 27

Table 11 – Estimated Marginal Means of the Two-way ANOVA for the Interaction Product

Category * Color Temperature ....................................................................................................... 28

 viii
TABLE OF APPENDICES

Appendix 1 - Selected brands by Product Category ...................................................................... 44

Appendix 2 – Histograms of the numeric variables with Normality Curves ................................. 47

Appendix 3 – Normality Tests for the transformations of the dependent variable Engagement ... 48

Appendix 4 – Test of Normality and Q-Q Plots for the Ln_Engagement and Product Category

interaction ....................................................................................................................................... 49

Appendix 5 - Test of Normality and Q-Q Plots for the Ln_Engagement and Color Temperature

interaction ....................................................................................................................................... 51

Appendix 6 – Results of the One-Way ANOVA comparing Engagement Rate means for each Color

Temperature group ......................................................................................................................... 53

Appendix 7 - Results of the Two-Way ANOVA comparing Engagement Rate means for each Color

Temperature and Product Category interactions ............................................................................ 54

Appendix 8 - Estimated Marginal Means on the Two-Way ANOVA for the interaction Product

Category * Color Temperature ....................................................................................................... 56

 ix
CHAPTER 1: INTRODUCTION

1.1 Background & Problem Statement

Digital Technology and Marketing are two underwired concepts, evolving alongside for several
years. The process usually starts with the emergence of new technology and its first use by the
early adopters, followed by the popularity growth and eventual exploration by marketers, in search
for new ways to interact with their target (Ryan & Jones, 2009). Coming together as Digital
Marketing, this process has been changing the business landscape. According to Kotler et al (2009),
Digital Marketing refers to the use of digital technology to interact and inform consumers, using
internet-based channels.

One of the milestones of Digital Marketing was the emergence of Social Media. Defined by Kaplan
& Haenlein (2010) as Internet-based applications that allow the exchange of User Generated
Content (UGC) through the basis of Web 2.0, these platforms have caused a paradigm shift in the
way companies to interact with their customers (Kohli, Suri, & Kapoor, 2015). Now, not only
consumers can interact among themselves, but they also have the tools to start conversations with
brands and are often in control of these (Kohli et al., 2015; Peters, Chen, Kaplan, Ognibeni, &
Pauwels, 2013)

These changes were mainly determined by consumers’ attitude towards brands and their products.
If traditionally consumer path to purchase was defined by Lemon & Verhoef (2016) as a linear
three-phased process, it’s now more of a circular one (Kruh, 2017) as consumers are progressively
turning to Social Media on each phase and using these channels to look for information or reviews
to support their decision (Mangold & Faulds, 2009).

This adoption of Social Media by the consumers is clear when looking at worldwide usage data:
according to Statista (2018), 71% of the global Internet users are now on social networks. This
value rises to 90% when it comes to European and Northern American users (Chaffey, 2018).
Additionally, the number of Social Media active users has grown by 13% since January 2017, as
stated by Kemp (2018) in Hootsuite’s Digital Yearbook. This means that, besides providing a richer
communication channel and facilitating information exchange, Social Media is now a place where
most worldwide consumers are.

 1
Driven by these opportunities, brands are increasing its investment on Digital and Social Media
Marketing and adopting it as a key Marketing channel – in 2018, American companies augmented
their spending on Digital Marketing by 15,1% while cutting the investment on traditional
Marketing by 1,7% (The CMO Survey, 2018).

One of the most popular Social Media platforms is Instagram – a free photo and video sharing
mobile app, where users can share content in both these formats, with other users of their choice
or all their followers (Instagram, 2018), and interact with this content. Instagram reached 1 billion
monthly active users in June 2018, up from 800 million users as of September 2017 (Statista,
2018b). On average, 38% of the US citizens from 18 to 44 years old, use the app at least once a
day (Statista, 2018a) and 80% of Instagram users follow a business (Instagram, 2017).

In 2016, the platform launched a dashboard of business tools, that brought several marketers into
the platform: as of September 2017, there were 25 million active business profiles on Instagram
(Ha, 2017), expanding its potential as a powerful Marketing tool. Accordingly, brands use the
platform to share content that can engage their audience (Schmitt, 2012).

Therefore, Marketing and Social Media managers keep looking for the best-practices on Social
Media, and for a deep understanding on how consumers use it and what makes them engage with
this branded content (Hanna, Rohm, & Crittenden, 2011).

However, hardly any studies have focused on investigating how the visual elements of Instagram
posts impact brand engagement on the platform, particularly color. It remains unclear what exactly
makes users interact with an image shared by a brand on Instagram.

It’s known that the psychology of color influences perceptions in several areas. Regarding
Marketing, it is known to impact in-store purchases (Labrecque & Milne, 2012) and the perception
of consumers towards the waiting time (Singh, 2006), so it does impact the Marketing efforts of
brands overall. Can the dominant color of an Instagram post make a user interact with it too?

Further insight on this matter is becoming relevant as brands try to optimize their Social Media
efforts.

 2
1.2 Aim & Scope

The aim of this research is to study how the color of a Social Media post affects user engagement
with this content. To asses this, throughout the dissertation two main research questions will be
answered:

 RQ1: Does the color of an image shared on Social Media impact consumers’ engagement with
 it?

 RQ2: Is the resulting impact moderated by the brands’ product category?

The Social Media platform chosen for this study was Instagram. The platform’s adoption all over
the world has been noteworthy – as of January 2019, Instagram was the 6th Social Media platform
with most users in the world (Statista, 2019). The 3rd, when only considering platforms that allow
for brand profiles. Besides this, it’s a highly visual platform, as the content shared can be either
videos or photos, that are the highlight of each user’s profile (Instagram, 2018). This makes photos
and color much more relevant on Instagram, an image and video-only platform, than on Facebook,
that allows a mix of images, videos, and text (Facebook, 2019).

For this dissertation, engagement is assessed through the total sum of interactions of an Instagram
post, this is, the total amount of likes and comments on the given post. This data was selected as a
metric since it’s public to all the users and could be accessed for every brand studied.

Lastly, there is a need to restrict the brands in the analysis, and the profiles that would be used for
this study. According to research on Yellow Pages advertising by Lohse, Rosen, & Hall (1999)
color can function as a cue for the quality of a product or service – however, this effect depended
on the product category. More recently, Bottomley & Doyle (2018) studied the effect the logo
color has on brand perceptions. They concluded consumers find it more appropriate when colors
are congruent with the product category. Both researches suggest the effect of color varies with
the product category.

Building from these researches, and having color has a proven impactful variable, this dissertation
will use the variable Product Category and study its moderator effect. Hence, the product categories
in study will be Food & Snacks, and Women’s Fashion and Travel. Instagram posts of brands in
these categories will be analyzed and compared to understand if the product category is, in fact, a
moderator for the impact of color on Social Media engagement.

 3
1.3 Research Methods

To answer the research questions, secondary data was used. Quantitative data was analyzed,
following an explanatory approach to study causal relationships between variables (Saunders,
Lewis, & Thornhill, 2009).

Numbers of the total sum of interactions for 3 chosen posts and the follower count was collected
from 150 business profiles on three different industries: Food & Snacks, Women’s Fashion. And
Travel These numbers were then used to derive the Engagement Rate of each post, a measure of
Consumer Brand Engagement on Social Media.

Quantitative data on the dominant color of each post was collected using a color extraction tool 1.
This tool allowed the categorization of the posts in terms of Color Temperature.

The relationship of both variables was analyzed afterward, to understand how Color Temperature
impacts the Engagement Rate on Instagram. Product category was introduced as a moderator of
this impact.

1.4 Relevance

Providing guidelines and ideas on how to improve a brand’s presence on Social Media, specifically
on Instagram, is the ultimate intent of this dissertation. The results drawn will contribute to the
knowledge about user behavior on Instagram, and topic researchers haven’t focused much on until
now.

As brands adopt Social Media as important channels, they also look for the best practices to share
their content, whether it is on the impact of different message types (Peters, Chen, Kaplan,
Ognibeni, & Pauwels, 2013), the impact of community (Naylor, Lamberton, & West, 2012) or even
the best times to post (Kanuri, Chen, & Sridhar, 2018).

Having brand engagement as the goal for brands’ Social Media presence (Phua & Ahn, 2016), a
better understanding of how to increase it is meaningful for these brands.

1
 In https://labs.tineye.com/color/

 4
The results of this dissertation will be useful for any Social Media Manager or others responsible
for brand communication on these platforms. By knowing the characteristics of content users
interact the most with, these professionals can plan their presence on the platform accordingly,
considering not only brand identity but also these insights on how the users react to different colors.
This dissertation will, therefore, provide marketers valuable and time-saving findings on this
practice. Designers will also benefit these conclusions, when responsible for the digital content
strategy.

Furthermore, when brands know and adopt the best practices to optimize engagement on Instagram,
they can eventually impact brand performance positively, through brand loyalty and consumer
satisfaction for instance (Barger, Peltier, Schultz, & Barger, 2016; Cummins, Peltier, Schibrowsky,
& Nill, 2014; Dessart, 2017; Hollebeek, Glynn, & Brodie, 2014; Pansari & Kumar, 2017).

1.5 Dissertation Outline

The following chapter presents a literature overview and hypothesis development. It will dig deeper
into Social Media, what’s behind it and how it’s an important tool for businesses. It will also go
through the existent literature on brand engagement and the psychology of color. Chapter 3 presents
in detail the methods used to collect and analyze the data. In Chapter 4, the main results of this
dissertation will be presented and discussed, while Chapter 5 summarizes the conclusions drawn.
The managerial implications, limitations of the study and suggestions for further research in the
field are then detailed to close the dissertation.

 5
CHAPTER 2: LITERATURE OVERVIEW & RESEARCH QUESTIONS

2.1 Digital Content Marketing

Social Media represents a good channel for brands to communicate with their target audience
(Ashley & Tuten, 2013). Behind any kind of Social Media is the concept of digital content
Marketing. Defined by the Content Marketing Institute (2013) as the “creation and distribution of
valuable, relevant and consistent content to attract and retain a defined audience” content
Marketing is now seen as a way to create and offer customer value (Rowley, 2010) and is a
fundamental practice for brands on Social Media.

Similarly, Pulizzi (2012) defines it as “the creation of valuable, relevant and compelling content
by the brand itself on a consistent basis, used to generate a positive behavior from a customer or
prospect of the brand”. In this case, besides attracting and retaining an audience, content Marketing
should also focus on turning an audience into effective customers and generate positive behaviors.

On a different approach, Dan Blank, Marketing content specialist from We Grow Media, defines
content Marketing as focusing on an idea instead of a product while engaging a community, trying
to share valuable information first without expecting any return (Cohen, 2016). This definition,
however, may appear to look at content as the opposite of advertising and is an example of how
both should be considered. Content Marketing, in fact, includes both types: paid content
(advertising) or nor paid (organic) (Kamerer, 2017). Regardless, the goal is to create something
that should effortlessly attract your customers instead of pushing product information that they may
not, be looking for, and this works for both organic and paid content (Opreana & Vinerean, 2015).

Although these definitions may partially or totally explain content Marketing through different
lenses, it’s understandable that this is still an evolving concept, in the fast-changing business
environment (Kannan & Li, 2017).

Overall, all research on the concept agree on what are considered the main characteristics of digital
content, for instance, it’s contextual value, intangibility, reproducibility with no lost value (when
it’s shared for several users) and the accessibility through several devices (Koiso-Kanttila, 2004;
Rowley, 2010).

 6
When companies adopt a content Marketing strategy, they are trying to raise brand awareness,
develop the relationships with their customers and eventually engage their audience with their
brand or products (De Vries, Gensler, & Leeflang, 2012; Kumar, Bezawada, Rishika, Janakiraman,
& Kannan, 2016).

However, as more and more brands are implementing these strategies it appears that more content
is being produced than people can consume: according to a Smart Insights Infographic (Allen,
2017) the number of new posts on Facebook reaches the 3.3 million every 60 seconds and over 65
thousand on Instagram. At the same time, according to the same report, social shares are decreasing
as 75% of the blog posts analyzed get 10 or fewer shares.

Data suggests there is a saturation that comes from the repeated consumption of similar content
(Zhang & Sarvary, 2011), making it more difficult to create content that stands out and impact the
audience. This is now the decisive task of digital and Social Media Marketing: produce content
appealing and interesting enough to get noticed and foster the benefits Social Media can generate
(Villarroel Ordenes et al., 2018).

To overcome this challenge brands should learn how to create valuable content that is significant
to the customer (Malkin & Venkatesan, 2005) and how to do it through digital content, testing
different Social Media posts, that may be images, video or text, depending on the social network
in use (De Vries et al., 2012).

2.2 Consumer Brand Engagement

Brand engagement or consumer brand engagement (CBE) (Dessart, 2017) is now the factor every
Social Media manager strives for (Leckie, Nyadzayo, & Johnson, 2016), as brands progressively
go after emotional connections with their customers, rather than merely communicating sales
messages (Pansari & Kumar, 2017).

Literature has been focusing on defining CBE, its drivers and consequences for several years now
(Leckie et al., 2016) and researchers have shared distinct approaches on the topic.

Hollebeek (2011) defined CBE as “the level of a consumer’s motivational, brand-related and
context-dependent state of mind characterized by specific levels of cognitive, emotional and

 7
behavioral activity in brand interactions”, perceiving it as a multi-dimensional concept, alike other
researchers’ theories.

Mollen and Wilson (2010) focused specifically on online settings, describing CBE as “the cognitive
and affective commitment to an active relationship with the brand as personified by the website or
other computer-mediated entities designed to communicate brand value”. In line with Hollebeek’s
study, the authors unfold this construct as a multi-dimensional concept as well, driven by cognitive,
instrumental and experiential values.

While diverse, these theories explain CBE beyond consumer involvement, as a psychological
condition triggered by consumer’s emotional relationship with the brand (Brodie, Ilic, Juric, &
Hollebeek, 2013; Dessart, 2017) and the experiences with it (Brodie et al., 2011). This means
engagement is psychological and multidimensional as the authors describe – more than
interactions, it is related to consumer needs, purposes and goals (Ashley & Tuten, 2013).

If consumers feel their needs are being answered by a brand or if their goals are supported, they
will more easily engage (Ashley & Tuten, 2013). This should be maximized by creating strong
brand associations, through valuable content, that can generate a sense of belonging and identity
in the consumers, an emotional connection (Hollebeek et al., 2014).

In fact, theories like the Self-Expansion suggest that consumers engage with brands whose
identities they identify themselves with, doing do so by attributing human character to a brand
(Huang & Mitchell, 2014). If the consumer relates to this personality, it is easier to develop an
engaging relationship.

This is a theory brand managers use to develop likable brands – create one that consumers can
relate with (Reimann, Castaño, Zaichkowsky, & Bechara, 2012). This process is also known as
Consumer-Brand Identification, driven by memorable brand experiences or associations and brand-
self similarity (Stokburger-sauer, Ratneshwar, & Sen, 2012).

Social Media help by providing additional touch points, as every post or content shared will prompt
certain emotions on consumers. These eventually helps developing associations with the brand, for
instance associating a brand as a relatable entity that is, therefore, engaging and valuable (Ashley
& Tuten, 2013).

 8
Muntinga, Moorman, and Smit (2011) found out that there are two main motivations behind
consumers interactions with brands on Social Media: entertainment or information. Informational
content is any post that shares information about a company or product. Entertaining content is the
one that appeals to the emotions. Both address different motivations and can be valuable depending
on the consumers’ needs. (De Vries et al., 2012)

Moreover, it’s now known that interactive posts that call to a certain action like a click or answering
a question, as well as multisensory – like videos with sound, that stimulates more than sight only -
naturally get a higher number of interactions (De Vries et al., 2012). The same is proved to happen
with posts that include photos (when compared to text-only posts) (Kim, Spiller, & Hettche, 2015).

By adopting the best content practices for engagement, brands can positively impact brand
performance, through CBE. The direct outcomes remain unclear (Barger et al., 2016) but it’s
known that potential results from the consumer-brand relationships and increasing levels of CBE
include a higher consumer satisfaction, sales growth, brand loyalty and customer lifetime value
(Barger et al., 2016; Cummins et al., 2014; Dessart, 2017; Hollebeek et al., 2014; Pansari & Kumar,
2017).

Even if the addressed theories on CBE highlight the same emotional and psychological
context of engagement, there seems to be doubt regarding an effective measure (Sashi, 2012).
Hence, as Social Media are naturally interactive-based, brands often use relevant content to
emotionally engage with consumers (Schmitt, 2012).

Engagement is subsequently assessed using social interaction metrics – such as likes, comments,
and shares – that are then used to conclude about performance on Social Media (Barger et al., 2016;
Sashi, 2012). Measuring the Engagement Rate from the interactions is now a regular procedure in
most Social Media and a key metric recommended by several Marketing blogs (Buffer, 2018;
Vaughan, 2011). It may vary with Social Media, but it’s a feature included in the analytics reports
of brand pages (Facebook, 2018), and is generally computed by dividing the Total Sum of
Interactions of a post by the follower base of the brand on the platform.

 9
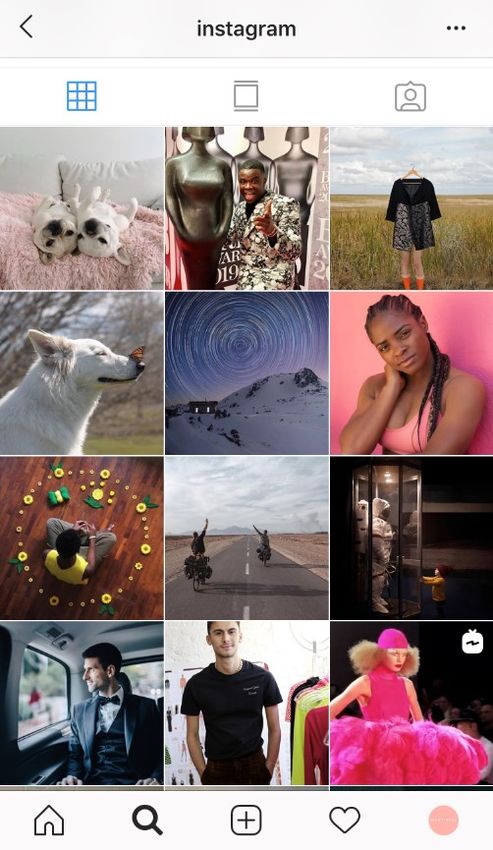
2.3 Instagram as a Marketing Tool

Social Networking Sites are, according to Kaplan and Haenlein (2010) “applications that enable
users to connect by creating personal information profiles, inviting friends and colleagues to have
access to those profiles, and sending e-mails and instant messages between each other”.

On the top 10 of the most used SNS is Instagram, the 6th platform in terms of the number of active
users (Statista, 2019). The SNS reached 1 billion monthly active users in June 2018, up from 800
million users as of September 2017 (Statista, 2018b).

Instagram is a free photo and video sharing mobile app, where users can share this content with
other selected users or all their followers (Instagram, 2018). It works similarly to Facebook: each
user as its own account where they can either get followed by the ones that are interested in their
content or follow users they are interested in (Instagram, 2018).

After following a user, their content will start appearing regularly on the Instagram feed, based on
an algorithm that tries to predict which content is more important or valued by the user (Loren,
2018). Users can then interact with the content through several actions, like ‘likes’, ‘comments’,
‘saves’ in a personal folder inside the app or ‘shares’ to other users.

 Figure 1 – Screenshots of an Instagram Feed 10
Instagram is a highly visual platform, as the users’ profiles are composed by a grid of their lately
shared photos or videos (Figure 1). As seen in the previous chapter, this content performs well in
terms of engagement (Kim et al., 2015), meaning the app is also a powerful tool to interact with
customers. On average, 38% of the US citizens from 18 to 44 years old, use Instagram at least once
a day (Statista, 2018a) and 80% of Instagram users follow a business (Instagram, 2017), so
Instagram is also a powerful Marketing tool.

The platform noticed this trend, and by May 2016 launched a set of tools for businesses, like the
creation of business profiles linked to Facebook pages, a business analytics dashboard and the
possibility of turning posts into paid ads for higher reach (Perez, 2016).

Using these tools, brands that create business profiles can access a set of information that was not
tracked before. This includes not only data on the number of followers and unfollowers, but also
detailed information about these followers/audience, their location, age range and gender (Figure
2). This ends up having great utility for businesses trying to evaluate their efforts on Social Media.

 z

 Figure 2 - Screenshots of an Instagram Analytics Dashboard

 11
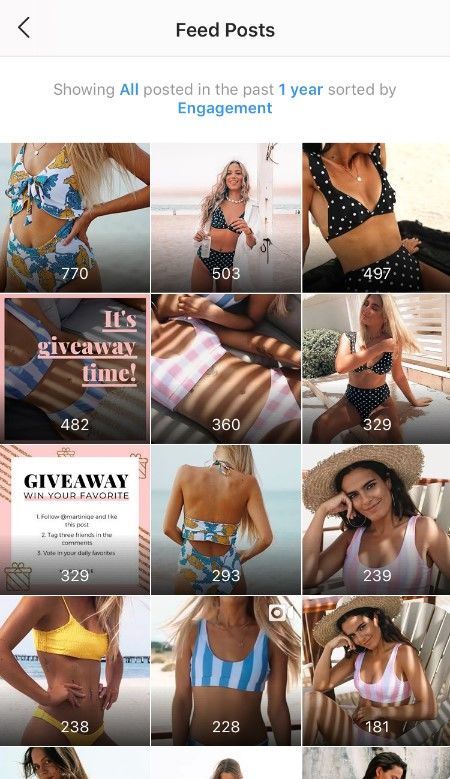
Regarding Brand Engagement, one of the most important Insights of this dashboard is content
analysis. This allows businesses to analyze the engagement of their audience with each of their
posts (Figure 3).

 Figure 3 - Screenshots of an Instagram Content Analytics Dashboard

This metric, as seen in Figure 3, reflects “the number of times a post was liked, saved and
commented on”. However, only the brands’ itself have access to the number of times a post was
saved – this information is private and cannot be seen by a regular user. Therefore, for this
dissertation, the engagement will be studied considered ‘likes’ and ‘comments’ only, this is, the
total sum of interactions.

Overall, the success of Instagram goes in line with the Pew research by Rainie, Brenner, and Purcell
(2012), that states photos and videos are now the “key social currencies online”. Regardless of its
popularity and growth, not many research has been focusing on Instagram, and information on best
practices is still unanswered (Hu, Manikonda, & Kambhampati, 2014).

 12
2.4 The Relevance of Color

With the adoption of Social Media and an increasing number of channels throughout which brands
communicate, the ideal integration of all Marketing communications becomes relevant (Batra &
Keller, 2016). The authors state that one of the main considerations regarding this integration is
consistency, and how the same brand message should be delivered in different ways, to emphasize
brand identity and associations.

One of the properties of visual consistency is the color scheme (McGrath, 2005) and possibly one
of the most salient on Instagram, as other symbols such as the logo or typography are not so overly
shared on the platform’s profiles. This symbol, such as the name, carries strong associations
intrinsically, that the consumers automatically translate to the personality of a brand (Abril,
Olazábal, Cava, Keating, & Coltman, 2009). Moreover, research on Yellow Pages advertising
(Lohse, Rosen, & Hall, 1999) showed color can influence the perception consumers have for the
quality of a product or service.

Brand fans are attached to brands’ colors and react to changes in the logo or in other visual elements
(Labrecque & Milne, 2012), so it could be easy to hypothesize that these changes may also affect
consumers reactions on Social Media. Thus, brands may often be tempted to follow a strict color
scheme on all their communication efforts, for brand consistency purposes, but this may not be the
best option to promote engagement, as colors have psychological meaning.

2.5 Psychology of Colors

Differences in color hues – red, blue, yellow and others - arose from the classic literature and the
development of the first color wheel by Isaac Newton in 1666 (Soegaard, 2019). According to the
author, hues are often divided by temperature to induce emotions and feelings, although they have
different representations and meanings around the globe. The categories are warm colors including
red, orange and yellow; cool colors, including green, blue and purple; neutral colors like white,
black, gray and brown.

It’s known that color affects our perceptions (Bagchi & Cheema, 2013) and even our purchase
intentions (Belk, 1975; Kotler, 1974). As Bagchi and Cheema (2013) show, most research
regarding the psychology of colors, focus on the differences of the colors red and blue, generally

 13
having red as a more arousing color, and blue as a relaxing one. (Elliot, Maier, Moller, Friedman,
& Meinhardt, 2007; Labrecque & Milne, 2012).

From the classical to the contemporary research, this finding has not been contradicted. When
applied to the digital background, blue is known to keep it’s relaxing properties, shortening
consumers’ loading time perception on websites (Gorn, Chattopadhyay, Sengupta, & Tripathi,
2004). Also, Coursaris, Swierenga and Watrall (2008) found that consumers seem to have favorable
perceptions of a website’s design when it uses cooler colors like blue, as opposed to warmer colors
like red.

In terms of shopping behavior, stores with blue environments are considered more pleasant, while
red colors induce more negative behaviors, such as decreasing purchase intention and purchase
postponement (Bellizzi & Hite, 1992).

Furthermore, in terms of digital content, these differences are also recognized. According to
research by Jalali & Papatla (2016) on the impact of color on UGC, photos with higher proportions
of green, a cooler color like blue, have a higher click-rate. The research focused on Instagram
content and proved that color does impact the way an audience interacts with these posts, and
therefore the engagement. Similarly, North & Ficorilli (2017) found that blue ads have higher rates
than red ones.

On the other hand, the red hue is often linked to exciting and arousing features and usually
concerned as a simulative color that promotes action (Clarke & Costall, 2008). According to
Labrecque & Milne (2012), orange and yellow share similar properties of excitement, energy and
live, although less than red.

2.6 Conclusion and Hypothesis

With the growth of Social Media and an increasing number of brands adopting it, it’s getting more
and more relevant to optimize digital content. The goal on platforms like Instagram is to drive users
to interact with a brand’s posts, make them feel engaged with valuable content. These interactions
are often psychological: if users relate to a brand or post, they will more easily engage with it.
Consequently, brands keep looking for ways to grab more attention towards this end – besides the
content, a detail like the color is proved to impact users’ actions.

 14
As seen in the previous chapter, warmer colors are more stimulant (Clarke & Costall, 2008) and
promote action. For this reason, it should be easy to hypothesize that these stimulating properties
would make it easier for Instagram users to interact with posts where the dominant colors are
warmer.

However, throughout the literature on the impact of colors, it’s clear that blue is usually associated
with more positive outcomes, as red is more related to negative ones (Labrecque & Milne, 2012).
Regarding Marketing, blue is the color that provides better results in terms of purchase, perceptions
and even click-through rates. Thus, we hypothesize:

 RH1: Posts that have cooler predominant colors have higher Engagement Rates.

Warm hues share the same general characteristics according to research on the psychology of colors
(Labrecque & Milne, 2012). Additionally, Color Temperature is linked to emotions, and will,
therefore, be the color variable used for this study. Furthermore, most research on the subject is
based on the comparison between red and blue hues (Bagchi & Cheema, 2013), so the use of Color
Temperature including Neutral hues is already an extension on the topic, as it includes more than
these two colors only.

Furthermore, knowing that the effect colors have on quality perception varies with the Product
Category (Lohse, Rosen, & Hall, 1999), the same effect can be visible while assessing for Color
Temperature. Therefore, we hypothesize.

 RH2: The impact of Color Temperature in the Engagement Rates is moderated by the product
 category.

 15
CHAPTER 3: METHODOLOGY

Chapter 3 presents and explains the methods used to study the research questions and hypothesis
proposed in the last chapter, and how these are addressed.

The chapter goes over the research approach and its definition, followed by a presentation of the
secondary data used for this study. Moreover, the data and analytical tools used to analyze it, are
described.

3.1 Research Approach

The aim of this research is to study whether there is a significant relationship between the variables
relating to post Color Temperature on Instagram and product category, and the variables reflecting
brand engagement.

As seen through the literature review, past research has shown that these variables have been
affecting brand attitude and brand performance (Abratt, 1989; Kotler, 1974) in offline
environments, as well as on website perceptions (Gorn et al., 2004). This dissertation goal is
understanding whether this link is also observable in the Social Media context and Instagram brand
pages.

Having this, to study this causal relationship between variables, an explanatory approach was
undertaken (Saunders et al., 2009). According to the authors, this approach is considered when
studying causal relationships between variables and explaining them.

To proceed with this explanatory study, secondary data was used, by gathering quantitative data
from past Instagram posts of brands on two different categories.

3.2 Research Design

To answer the research questions, data was compiled from 450 Instagram posts of 150
brands/Instagram pages in three different product categories. Data were collected concerning the
three different variables in study:

 16
Color Temperature:

Color Temperature is one of the independent variables in this dissertation. Quantittative data on
the color of each post is obtained by extracting the dominant on the post and positioning it in terms
of Color Temperature. The posts will be evaluated according to the following matrix:

 Dominant Color Color Temperature Level
 Red, Orange, Yellow, Pink Warm
 Green, Blue, Purple, Violet Cool
 White, Black, Gray, Brown Neutral

 Table 1 – Color hue and temperature matrix

Product Category:

Product Category is the second independent variable and its influence as a moderator will be
studied through the dissertation. The posts were labeled according to the product category as Food
& Snacks, Women’s Fashion on Travel, depending on the respective brand.

Engagement Rate:

Finally, the dependent variable in this dissertation is the Engagement Rate. This is a quantitative
variable operationalized through the total sum of interactions and number of followers, as these are
the metrics that express engagement on Social Media.

For this study, likes and comments will have the same relative weight on the total sum of
interaction. However, it’s easier for an Instagram user to like a post with one click only, that
engaging enough to share their thoughts by writing a comment.

The brands in study were randomly selected, so differences in the follower base are notable: the
database includes Zara with 31.1 million followers, and Califia Farms, with 207 thousand. When
the follower base is this dissimilar, the total sum of interactions will be highly different too, as the
post reaches much more users.

 17
For this reason, Social Media Managers use the Engagement Rate to relativize the number of
interactions, by dividing it by the total follower base. This way, engagement is analyzed as a
percentual value, relative to the number of followers, and can be compared regardless of the
audience size. Engagement Rate is therefore computed as:

 (# + # )
 (%) =

Overall, having these three variables, we can operationalize the study through the following
simplified model:

 Color Temperature Engagement Rate
 (independent variable 1) (dependent variable)

 Product Category
 (independent variable 2)

3.3 Population & Sample

The sample of this study consisted of 450 photos that brands shared on their own Instagram profile.
The chosen posts were selected from the platform feed of 50 brands of each product category: 50
Food & Snacks brands, 50 Travel brands and 50 Fashion brands.

For each of these brands, 3 posts were selected. The images were selected randomly among the
posts shared from the 1st December 2018 on, to ensure the current follower base is not that different
from the base when the image was posted.

 18
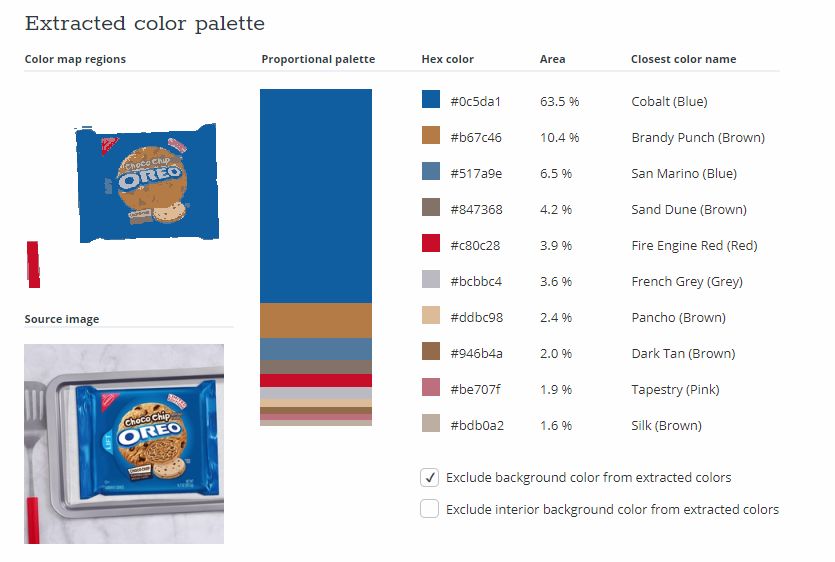
The brands chosen can be found in Appendix 1, with descriptive values on the number of posts
with each Color Temperature that were analyzed.

3.4 Data Collection & Analysis

All the data in this analysis was collected to a data set including the brand, the URL of the Instagram
post and the product category, for tracking and organization purposes.

The quantitative data collected from Instagram consisted of the brand’s follower number and the
total sum of interactions of the selected posts. This includes the total number of “likes” and
“comments” on each post.

As there is no accessible tool to do this collection at the time of this dissertation, all the data was
collected manually, by looking at each Instagram post individually. These values were then used
to measure the Engagement Rate of each profile and post and introduced into the Excel database.

Moreover, quantitative data on the color of each post was collected. Even though the main
Instagram platform is the mobile app, the desktop website was used for data collection, as it allows
several add-ons that made the process easier and faster. On desktop, it’s not possible for a user to
click-right on an Instagram image to save it or copy its link thanks to certain platform restrictions
over its content – it must be done over the page source, a time-consuming process. To accelerate
this, a browser extension2 was used to get the image URL and then insert it in a tool to extract the
dominant color of an image.

TinEye Lab is an image search and recognition company (“TinEye - About Us,” 2018) that allowed
the assortment of data on Instagram posts’ color. Using their color extraction tool3, a picture is
analyzed just by introducing its link. The page then displays a color palette with all the hues
identified in an image, including the percentage of dominance (Figure 4). The color that takes a
higher percentual area in the image, will be considered the dominant color.

Using TinEye, besides the color code and area value, we can get a color approximation name. This
makes the study objective, as we don’t have to subjectively evaluate if the color is, for instance,

2
 GetThatPic! Chrome extension was used to “Get url of instagram image easily and in well-known way”. Extension
can be found in: https://chrome.google.com/webstore/detail/getthatpic/fkdmnfbeaepmildaolaoicjbfkghpcco
3
 In https://labs.tineye.com/color/

 19
green or blue, orange or red: the platform itself provides this information, and this one is always
used with no space for perception bias.

 Figure 4 – Example of the dominant color extraction tool

Data was manually collected for each of the 450 posts, and introduced in the data set, one by one.
Subsequently, based on each post’s dominant color, they were then categorized by Color
Temperature, according to the division of hues above (Table 1).

The collected data is afterward registered in a data set for precise presentation and examination. At
the end of these stages, to answer RQ2, the database includes the three most relevant variables for
the analysis: for each post, the Engagement Rate, product category, and Color Temperature. The
database accounts for a total of 7 variables:

 20
Product Category Category of the brand. Food & Snacks, Women Fashion or Travel
 (string)
 Likes Number of likes on each post
 (numeric)
 Comments Number of comments on each post
 (numeric)
 Sum of Interactions Total number of likes and comments on each post
 (numeric)
 Followers Number of followers of each brand’s Instagram page
 (numeric)
 Engagement Rate Engagement Rate computed as (Sum of Interactions / Followers)
 (numeric)
 Color Temperature Color Temperature of each post. Warm, Neutral or Cool.
 (string)
 Table 2 - Database variables

No data cleaning was performed, and all the variables were compiled into an SPSS data set. When
analyzing the frequencies of the dependent variable engagement and the ones that are used to
operationalize it (Likes, Comments, Sum of Interactions and Followers), it was visible that they
did not follow a normal distribution. This would hamper the following analysis as the assumptions
for the parametrical tests could not be verified and these are usually more robust test (Rasch &
Vienna, 2019). To verify the distribution, Shapiro-Wilk test and Kolmogorov-Smirnov test were
then run. The results obtained are present in Table 3.

 Kolmogorov-Smirnova Shapiro-Wilk
 Statistic df Sig. Statistic df Sig.
 Engagement ,148 450 ,000 ,854 450 ,000
 Sum of Interaction ,338 450 ,000 ,424 450 ,000
 Comments ,302 450 ,000 ,521 450 ,000
 Likes ,338 450 ,000 ,422 450 ,000
 Followers ,343 450 ,000 ,403 450 ,000
 a. Lilliefors Significance Correction
 Table 3 – Results of the Kolmogorov-Smirnov and Shapiro-Wilk normality tests

Having the highly significant p values, the null hypothesis is rejected for all the variables meaning
that a normal distribution was not confirmed for any of them. Yet, these tests are known to lose
 21
robustness with the increase of the sample, and they may be limited to sample sizes between 3 to
50 (Royston, 1982), values way smaller than the 450 observation sample for this dissertation.

Therefore, to validate the results, the frequencies of the variables were run on SPSS through
histograms with normality curves, present in Appendix 2. By analyzing them, it became clearer the
variables did not follow a normal distribution.

Accordingly, and to continue the analysis, the variables were transformed through natural
logarithms to linearize them. More precisely, the dependent variable for this study, Engagement,
was transformed into Ln_Engagement. After this transformation, the variable seems to follow a
normal distribution, perceptible in the Normality Curve and the Q-Q plots (Appendix 3). Moreover,
the Skewness and Kurtosis values in Table 3 verify this normality (-0.462 ∈ [-2;2]).

 Valid 450
 N
 Missing 0
 Skewness -.462
 Std. Error of Skewness .115
 Kurtosis .429
 Std. Error of Kurtosis .230

 Table 4 – Skewness and Kurtosis of the Depende Variable Ln_Engagement

Nonetheless, having the sample size of N = 450 no normality issues should be concerning, and this
Ln transformed variable will be the one used in the following analysis.

To verify the assumption of Homogeneity of Variances, a Levene’s Test of Equality of Variances
was run Appendix 6. Having a significant p-value (p=0,343 > 0,05), the assumption of
homogeneity of variance is met and parametric tests like One-Way ANOVA can be performed.

The normality of the independent variables was also assessed, this is, the Engagement distribution
for each of the Product Category and Color Temperature groups. Following the same principles,
and as the Shapiro Wilk test is not adequate for a 150-sample size, the Q-Q Plots were used to
assess the normality of these interactions. To do so, the independent variables Product Category
and Color Temperature were recoded into numeric values. Appendix 4 and Appendix 5 present
these results and prove the normal distribution of these interactions.

 22
CHAPTER 4: RESULTS AND DISCUSSION

This chapter presents the results of the analysis of the data collected from the 150 brand’s Instagram
profiles. It goes through the initial comparison of means between categories, followed by the
analysis of Color Temperature impact on brand engagement. Lastly, the moderator effect of the
product category is analyzed, and all the findings are discussed.

4.1 Mean Analysis

To start with, a comparison of means of the variables Followers, Sum of Interactions and
Engagement was performed for each product category, to understand how different brands may
impact the results.

 Product Category Followers Sum of Interaction Engagement
 Mean 2.844.104 12.513 0,71%
 Fashion
 Std. Deviation 5.589.407 255.178 0,75%
 Mean 1.133.552 9.882 1,16%
 Food
 Std. Deviation 2.744.573 25.319 0,91%
 Mean 1.505.024 14.806 1,31%
 Travel
 Std. Deviation 4.577.439 36.303 0,83%

 Table 5 – Comparison of Means by Product Category

Table 5 illustrates the Means and Std. Deviations of the variables Followers, Sum of Interactions
and Engagement, for each Product Category.

As to the follower base, Fashion is the category with a larger audience, followed by Travel
(MTravel_Followers = 1.505.024). Food is the category with the lowest follower mean, displaying less
than half of the average followers of Fashion brands (MFood_Followers = 1.133.552 against
MFashion_Followers = 2.844.104).

It’s observable by looking at the Food category that the Sum of Interactions decrease with the
number of followers (MFood_Interactions = 9.882). However, both Fashion and Travel contradict this
rule of thumb: although it has the most followers, Fashion is not the category with the highest Sum
of Interactions (MFashion_Interactions = 12.513). Travel brands, on the other hand, presented the highest

 23
values of interactions (MTravel_Interactions = 14.806), even though the average of followers is less than
half of the Fashion values.

Consequently, even with the lowest Follower and Sum of Interactions means, Food is not the
category with the lowest Engagement Rate. In fact, the large audience of Fashion brands paired
with the relatively low total Interactions, make this the product category with lowest engagement
mean (MFashion_Engagement = 0,71%). Differently, both Food and Travel brands present high
Engagement Rates (MFood_Engagement = 1,16%; MTravel_Engagement = 1,31%)

Though, all the results are widely disperse having standard deviations higher than the means in
almost every scenario.

The same analysis was performed for the posts by Color Temperature, to run an initial study of
how Color Temperature may impact the dependent variable, and the results are present in Table 6.

 Color Temperature Followers Sum of Interaction Engagement
 Cool Mean 1.766.680 13.618 1,21%
 Std. Deviation 4.467.530 32.717 0,96%
 Neutral Mean 2.041.444 14.882 1,1%
 Std. Deviation 4.898.147 34.616 0,87%
 Warm Mean 1.677.024 8.651 0,87%
 Std. Deviation 4.165.780 17.992 0,72%
 Table 6 - Comparison of Means by Color Temperature

The posts that lead to better performance in terms of Engagement Rate are the ones with a cooler
dominant color (MCool_Engagement = 1,21%) closely followed by the neutral colors (MNeutral_Engagement
= 1,1%). Warm posts perform worse (MWarm_Engagement = 0,87%) than any others.

Although the neutral color posts come from brands with more Followers (MNeutral_Followers =

2.041.444) the Sum of Interactions value is not high enough to make these the most engaging posts
(MNeutral_Interactions = 14.882). Warm posts are linked to lower values for all the variables
(MWarm_Followers = 1.677.024; MWarm_Interactions = 8.651). The results regarding cool posts are relevant
towards RH1, indicating that cool posts are associated with good engagement values.

 24
You can also read