Combining process modelling and process evaluation in a complex service delivery work process
←
→
Page content transcription
If your browser does not render page correctly, please read the page content below
Master Thesis
             Information Sciences

                   Radboud University

Combining process modelling and
 process evaluation in a complex
  service delivery work process

Author:                                       Supervisor:
D.C.M. (Daniël)                      dr. S.J.B.A. (Stijn)
van Loon                              Hoppenbrouwers

                                        Second examiner:
                                       prof. dr. E. (Erik)
                                             Barendsen

                                      External Supervisor:
                                          dr. T.M. (Thea)
                                         van der Geest

                        August 2018
Abstract In order to close the potential gap, between those who perform the work and those that design it, a novel instrument interoperating both process mod- elling and process evaluation has been shown and used within the OMNIO- project. This instrument focussed on making experienced bottlenecks ex- plicit in combination with suggested solutions and used workarounds. The results of this project showed that the notion that bottlenecks are always solved by related solutions is false. Showing that the gap between the de- signers and performers needs a renewed consideration.
Acknowledgements

There are several people I would like to thank for their help during the
realisation of this thesis:
    • Stijn Hoppenbrouwers for his patience, advice, supervision and the
      possiblity he gave me to participate in the OMNIO-project.

   • Thea van der Geest for her advice during the many meeting we had
     for the project and this thesis.

   • The Centrum IT+Media research group of the HAN (Hogeschool Arn-
     hem en Nijmegen) and its members for their hospitality and their co-
     operation. Of which I especially want to thank Ilona Wilmont, Marcel
     van Heerdt, Boukje Postma and the team of facilitators.

In addition I would like to thank my family and friends and anyone that
supported me during the realisation of this thesis.

                                   1
Contents
1 Introduction 6
1.1 Scope . . . . . . . . . . . . . . . . . . . . . . . . . . . . . . . 7
1.1.1 Research Context . . . . . . . . . . . . . . . . . . . . . 7
1.2 Relevance . . . . . . . . . . . . . . . . . . . . . . . . . . . . . 8
1.3 Research Question . . . . . . . . . . . . . . . . . . . . . . . . 9
1.4 Outline . . . . . . . . . . . . . . . . . . . . . . . . . . . . . . 10
2 Theoretical Background 11
2.1 Organisational Routines . . . . . . . . . . . . . . . . . . . . . 11
2.2 Work system framework . . . . . . . . . . . . . . . . . . . . . 14
2.3 Experienced Bottlenecks and Solutions . . . . . . . . . . . . . 16
3 Instrument 19
3.1 Identifying contacts and activities . . . . . . . . . . . . . . . . 20
3.2 Identifying bottlenecks and solutions . . . . . . . . . . . . . . 21
3.3 Execution of the instrument . . . . . . . . . . . . . . . . . . . 23
3.4 Reflection of the instrument . . . . . . . . . . . . . . . . . . . 24
4 Analysis 26
4.1 Digitisation . . . . . . . . . . . . . . . . . . . . . . . . . . . . 26
4.2 Analysis first research question . . . . . . . . . . . . . . . . . 28
4.2.1 Clustering bottlenecks . . . . . . . . . . . . . . . . . . 29
4.2.2 Classifying bottlenecks . . . . . . . . . . . . . . . . . . 30
4.3 Analysis second research question . . . . . . . . . . . . . . . . 31
4.3.1 Classifying solutions (including workarounds) . . . . . 31
4.3.2 Relation bottleneck and solution elements . . . . . . . 32
4.3.3 Comparison between solutions and workarounds . . . 32
5 Results 33
5.1 Clustering bottlenecks . . . . . . . . . . . . . . . . . . . . . . 33
5.1.1 Phase A; Inquiry and Information . . . . . . . . . . . 34
5.1.2 Phase B; Application . . . . . . . . . . . . . . . . . . . 37
5.1.3 Phase C; Inspection and Enforcement . . . . . . . . . 42
5.2 Classifying bottlenecks . . . . . . . . . . . . . . . . . . . . . . 45
25.3 Classifying solutions (including workarounds) . . . . . . . . . 46
5.4 Relation bottleneck and solution elements . . . . . . . . . . . 48
5.4.1 First view; Bottleneck > Solution . . . . . . . . . . . . 49
5.4.2 Second view; Solution > Bottleneck . . . . . . . . . . 50
5.5 Comparison between solutions and workarounds . . . . . . . . 51
6 Conclusion 52
7 Discussion 54
7.1 Limitations . . . . . . . . . . . . . . . . . . . . . . . . . . . . 55
7.2 Future research . . . . . . . . . . . . . . . . . . . . . . . . . . 56
References 57
A Cases municipalities & environmental services 59
B Finalised codebook (translated) 62
C Results 64
3List of Tables
2.1 Examples of bottlenecks within the different work system el-
ements . . . . . . . . . . . . . . . . . . . . . . . . . . . . . . . 17
5.1 Clustering bottlenecks phase A (translated) . . . . . . . . . . 34
5.2 Clustering bottlenecks phase B (translated) . . . . . . . . . . 38
5.3 Clustering bottlenecks phase C (translated) . . . . . . . . . . 42
5.4 Classification bottlenecks . . . . . . . . . . . . . . . . . . . . 46
5.5 Classification solutions and workarounds . . . . . . . . . . . 47
5.6 Relations between bottlenecks and solutions . . . . . . . . . . 49
C.1 Relation between the clustering and classification of the ex-
perienced bottlenecks . . . . . . . . . . . . . . . . . . . . . . . 64
4List of Figures
2.1 Schematic view of the ostensive aspect . . . . . . . . . . . . . 12
2.2 Organisational routines: duality between ostensive and per-
formative aspects . . . . . . . . . . . . . . . . . . . . . . . . . 13
2.3 Work system framework (Alter, 2013, p78) . . . . . . . . . . . 15
3.1 Examples of the used modelling technique . . . . . . . . . . . 21
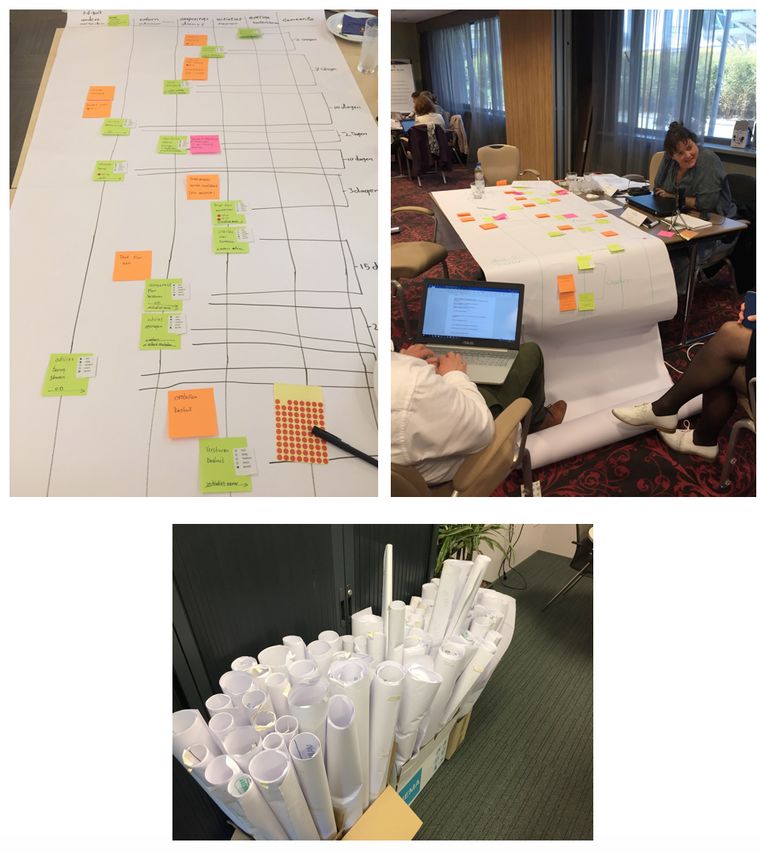
3.2 A finished swim-lane diagram, an action pic, and full har-
vest(83 scrolls from 6 workshops) Hoppenbrouwers, Wilmont,
van Loon, van der Geest, and Oppl (2018) . . . . . . . . . . . 24
4.1 Example of a created process model and its numbering . . . . 27
5Chapter 1
Introduction
Near the end of 2016 the Dutch association of general practitioners (Verenig-
ing Praktijkhoudende Huisartsen) informed the public about problems that
they experienced in their daily work12 . The association felt that existing
protocols were too rigid and were used too much as guidelines by the health
inspection and medical disciplinary colleges. Their chairman claimed that
these circumstances could create a situation in which general practitioners
would prioritize on following protocols instead of using common sense. If
his statement is true this could lead to actions by the general practitioners
that would not be in the best interest of the patient. The health inspection
however reacted by stating that practitioners already could deviate from the
protocols as long as a good reasoning was provided.
While both the VPH and the health inspection have a different view,
they both may be truthful. The possibility of deviation mentioned by the
health inspection can be checked when looking at existing protocols of the
practitioners, protocols of the health inspection and (case) law. Even though
the experience and feeling of the practitioners may be harder to measure,
it could still be truthful. While this is a single case were differing truths
between those who perform the work and those who manage, regulate or
design the work situation exist, it may well be present in other organisa-
tions. Even though not every organisation or sector deals with life or death
situations, differing views between performers and designers about the truth
may lead to unworkable or inefficient situations.
In order to be able to prevent or resolve these issues, awareness of such
a disparity of views is needed. Which is no easy task. The views of the de-
signers may in many cases be documented or represented within for example
internal processes, protocols and policies. Accompanied by external restric-
1
“Huisarten klagen over ‘protocolzieke’ inspectie.” NOS, November 30, 2016. http://
nos.nl/artikel/2145730-huisartsen-klagen-over-protocolzieke-inspectie.html
2
Effting, Maud. “Huisartsen: inspectie en tuchtcolleges lijden aan ‘protocolziekte’.” de
Volkskrant, November 30, 2016. http://www.volkskrant.nl/wetenschap/nederlandse
-huisartsen-lijden-aan-protocolziekte~a4424755/
6tions like agreements with other organisations and legislation. The views of
the performers will be harder to externalise, since it will likely not be doc-
umented. In addition, several factors have been found that discourage the
sharing of (negative) opinions or knowledge, e.g. knowledge as power (Ipe,
2003) and groupthink (Turner & Pratkanis, 1998). In pursuance of the ex-
ternalisation of the views of performers, this paper describes a novel method
that has been explored and conducted in which experienced bottlenecks are
the key element.
1.1 Scope
While there is potentially a multitude of different approaches to gain in-
sight of experienced bottlenecks, this research focuses on a single approach.
The approach consists of two parts. Firstly a form of collaborative S-BPM
(Subject-oriented Business Process Management) is used by performers or
participants in order to visualise their work situation. Secondly this visual-
ization is used as a tool for extracting experienced bottleneck and solutions.
Using S-BPM ensures that multiple participants act as domain experts and
collaboratively come to the actual situation instead of relying on documen-
tation of architecture and protocols.
The scope of this thesis is further limited to public service delivery,
where civilians or other organisations are the customers that are provided
to. Processes of services differ from other processes according to Niehaves
(2010) as with service processes, the customers are not only confronted with
the outcome of a process, but might play an active role during its execution
and contribute to the fulfilment. Due to this characteristic, participants like
general practitioners, not only have to take the interest of their organisation
into account but also those of the customer. Potentially creating bottlenecks
and reason to deviate from the designed standard. Besides this aspect, this
limitation was also used due to cooperation with a third party.
1.1.1 Research Context
The research has been conducted within the context of the OMNIO-project
(Ontwikkeling Monitor en Nulmeting Invoering Omgevingswet) of the Cen-
trum IT+Media research group of the HAN (Hogeschool Arnhem en Ni-
jmegen). The OMNIO-project was commissioned by the Dutch Ministry of
Infrastructure and the Environment, to inform and facilitate the upcoming
introduction of the ‘Omgevingswet’ in 2021. The Omgevingswet consists of
regulation on all types of activities in the environment and public space.
Anyone who plans an activity (such as building, demolition, water manage-
ment, etc) with a potential impact on the life environment, needs to consider
whether they need to apply for a permit, issued by a public administration
body.
7The public administration bodies have three main processes that are
relevant within this domain. The first consists of ‘Inquiry and Information’,
which takes place before an initiator of a plan has applied for a permit.
The public administration body inquires the potential plan and informs
the initiator about its feasibility and the deliverables/restrictions for their
application. The second process contains the ‘application’ for a permit.
Within this process the public administration body receives the application,
gathers advice for their judgement, and either accepts or rejects it. The
third process that is performed consists of ‘Inspection and Enforcement’.
In which public administration bodies inspect whether violations occur and
use enforcement to deter them.
The aim of the OMNIO-project is to answer four questions which were
posed by the ministry. Of these four questions two were related to the
working of the public administration bodies. The ministry wanted to know
how the public administration bodies arranged these processes. The cur-
rent legislation and policies allowed the administration bodies to develop
and implement their own processes. Which resulted in variety between the
bodies and a lack of overview for the ministry. Additionally they wanted to
know how the civil servants experience the processes and interactions with
initiators.
The answer to these questions and a description of the research instru-
ment have been reported to the ministry in two reports. In addition, two
papers were written, of which the second is this actual paper. The first paper
of Hoppenbrouwers et al. (2018) focussed mostly on the instrument within
the context of the OMNIO-project in addition of practicalities of executing
the instrument. This paper focusses on the analysis side of the instrument
after its actual execution, including the type of gathered data and results.
In other words this paper focusses on gaining insight in the experienced
bottlenecks and (suggested) solutions that can be identified when using a
research instrument which combines process modelling and experience eval-
uation. Through which the aim is to eliminate differing truths by providing
accurate overviews that can be used for the improvement of work situations.
1.2 Relevance
The exploration of the results of this research instrument is relevant due
to the novel idea within the research area of combining process modelling
and experience evaluation. Which has not been explored yet and current
instruments seem insufficient.
Currently the process modelling technique that is most suited for gaining
the view of the participants is collaborative S-BPM, since the participants
are considered the domain experts and their findings must be agreed upon.
Potentially discussions occur between the participants when seeking agree-
8ment, giving more insight in the reasoning and experience of the participants.
However, this insight is a secondary result and therefore may not entail the
complete set of reasoning and experience.
On the other hand the tools for evaluating experience are not sufficient.
They either are unsuitable for an entire process or need an artefact to be
usable. A popular instrument for evaluation is the use of questionnaires.
While you could potentially ask questions about the entire process, there
are several setbacks. Since questionnaires must be made in advance, the
researchers will have to use their own view of the process. Most likely based
on available explicit data, e.g. existing documents. Which could result in
steering the participants towards the viewpoint of the designers and thus
gaining an incomplete or incorrect result. A related setback is the limited
flexibility of a questionnaire. The researcher can only ask questions about
the entire process instead of individual process steps, since the researcher
and participants may differ on the process steps and what they entail. This
results in an inability to focus on process steps that may require more at-
tention. Another method that comes close is usability testing. This method
would give the participant the freedom to explore the process steps that are
more relevant for focussing on. However an artefact would be needed for
the participants to explore. A suitable artefact could be a process model
created by the participants themselves.
1.3 Research Question
In order to fulfil the aims of this paper two research questions have been
discussed, in addition with the description of the analysis side of the in-
strument. Both questions have been used as a means to show the data and
results that can be expected with the use of an instrument that uses both
process modelling and experience evaluation. Both questions are in line with
the original four questions that were posed by the ministry.
The first question posed and answered within this paper is:
Which kind of bottlenecks are experienced by the participants ex-
ecuting the processes that have been modelled?
This question has been answered twofold. Firstly the mentioned bottlenecks
have been clustered on their content, which is related and limited by the con-
text of the OMNIO-project. Secondly the mentioned bottlenecks have been
classified on a basis of a subset of the elements of the work system framework
of Alter. This framework is discussed in 2.2. Through using this framework
the results are no longer bound by the context of the project and could be
used in future projects.
9The second question posed and answered within this paper is:
Which kind of solutions are suggested or applied in order to
negate the experienced bottlenecks?
This question has been answered by classifying the mentioned solutions on
the elements of the work system framework of Alter. In addition the relation
between the element(s) of the bottleneck and the element(s) of the solution
has been looked at. Lastly this question has been answered by comparing
solutions that are suggested (in order to be fixed by the designers) and the
solutions that have already been applied (potentially against the wishes of
the designers).
1.4 Outline
In order to be able to answer the research questions chapter 2 introduces
two perspectives on organisiations (organisational routines and work sys-
tem framework), bottlenecks and solutions. Chapter 3 provides a broad
overview of the used instrument, since it’s specified in greater depth in
Hoppenbrouwers et al. (2018). Chapter 4 discusses the analysis of data that
the instrument provided. Chapter 5 states the results of the analysis, which
are used for the conclusion and discussion provided in chapter 6 and 7.
10Chapter 2
Theoretical Background
In order to understand and analyse organisations two frameworks are rel-
evant. Firstly, organisational routines are discussed in order to clarify the
influence of the duality between the participants and designers on the change
in organisations. Secondly the work system framework is discussed due to
its structuring capabilities, providing a potential tool for gap analysis.
2.1 Organisational Routines
Organisations can be composed of multiple organisational routines. Accord-
ing to Feldman and Pentland (2003, p96) the core definition of an organisa-
tional routine states:
“An Organisational Routine is a repetitive, recognizable pattern
of interdependent actions, involving multiple actors.”
As stated by the definition of Feldman and Pentland (2003) an organisa-
tional routine consists of a recognizable pattern, or in other words a set of
prior stipulated activities. An organisation will create these routines in case
of activities that will occur multiple times during the existence of the or-
ganisation. Since it will not be interesting for the organisation to put time
and energy into establishing a routine for activities that are bound to be
executed once. Hence the repetitive nature of organisational routines.
Due to the repetitive nature of the stipulated activities there are two
main benefits to the usage of organisational routines. Firstly, the stipula-
tion of activities on how, when, where, by whom they need to be executed
provides a form of organisational memory through which it is known what
is to be done, even when it is rarely executed. Secondly it is suggested by
Nelson and Sidney (2005) that the stipulation of the activities avoids con-
stant bickering about the way work is done. Therefore ‘routines as truce’
could provide efficiency by actual doing instead of talking. There are sev-
eral critiques on this constraining effect as cited by Feldman and Pentland
11(2003): mindlessness (Ashforth & Fried, 1988), deskilling (Leidner, 1993),
competency traps (March, 1991). The main criticism however is the con-
straining effect it has on participants and/or the organisation itself to be able
to adjust these routines if needed due to changing circumstances. While the
inability to change routines can be disastrous for the continuity of an or-
ganisation, Feldman and Pentland (2003) has a divergent view which shows
that organisational routines could be a source of change. Feldman and Pent-
land (2003) state that organisational routines consist of two related aspects.
Both aspects and their relation is shown in figure 2.2.
The ostensive aspect consists of the abstract idea of the routine that
provides structure to the participants, mostly created top down. First of
all, the activities are described. As shown in figure 2.1 the interdependent
actions/activities are described. In addition, the intention or goal of the
organisational routine is provided through the description of the expected
output. The output can either be the production of physical artefacts or in-
tangibles. Further required input is specified, which may include the output
of other or previous executed routines. Constraints in any form (e.g. law
and regulation, infrastructure, labour) can influence the decisions that are
made during the establishment of a routine. In addition, when constraints
are variable, the designers can create options in the routine, which partic-
ipants can choose between depending on the status of the constraint. For
example, ordering a greater amount of supplies when the price is lower and
the storage is at least half empty.
Figure 2.1: Schematic view of the ostensive aspect
While the ostensive aspect consists of the abstract idea of the routine,
Feldman and Pentland (2003) state that the performative aspect consists of
the actual performances of the routine by specific people, at specific times,
in specific places. So while the ostensive aspect acts like a blueprint or a
recipe, the performative aspect is the actual performance or execution of it,
12which should in theory not deviate from one another.
In practice however, the performance of an organisational routine may
unintendedly deviate from its original design due to the involvement of par-
ticipants. Firstly, participants influence the way a routine is executed due
to the interpretation they have of it, which is subjective. When looking at
the given example of ordering more supplies in a certain situation, it is not
clarified how significant the drop of the price of supplies needs to be. In
such cases participants need to interpret the intention of the designer and
will act according to their own skill or interest. Due to the involvement of
multiple participants and potentially differing participants over time, the
execution of routines will likely differ to some content every time. Secondly,
participants can also influence the execution of a routine during situations
that were unforeseen during the design of the routine. In such cases partic-
ipants will use their agency to improvise so that the expected output is still
provided.
Figure 2.2: Organisational routines: duality between ostensive and perfor-
mative aspects
The relation between both aspects is characterized by Feldman and Pent-
land (2003) through six types. Where three describe the relation from the
ostensive aspect to the performative aspect;
Guiding: The ostensive aspect of a routine can serve as a template for
behaviour or a normative goal (Feldman & Pentland, 2003,
p106).
Accounting: As cited by Feldman and Pentland (2003, p106): The osten-
sive aspect of routines allows us to explain what we are doing
and provides a sense of when it is appropriate to ask for an
accounting (Scott & Lyman, 1968; Orbuch, 1997).
Referring: People use the ostensive aspect of routines to refer to patterns
of activity that would otherwise be incomprehensible (Feldman
& Pentland, 2003, p107).
13The other three describe the relation from the performative aspect to the
ostensive aspect;
Creation: Through repetition (of performances) and recognition, organi-
sational routines are created (Feldman & Pentland, 2003, p108).
Maintenance: Performing an organisational routine maintains the osten-
sive aspect of the routine by exercising the capability to enact
it (Feldman & Pentland, 2003, p108).
Modification: When people do new things, whether in response to external
changes or in response to reflexive self-monitoring, they alter
the potential repertoire of activities that creates the ostensive
aspect of the routine (Feldman & Pentland, 2003, p108).
As mentioned before organisational routines can be viewed as constraining
in case of changing circumstances. Within this view the only way to change
a routine is through planned change or exogenous change. Or in other
words, managers changing the routine top down by utilizing their power
position. In case of the view of Feldman and Pentland (2003) the planned
or exogenous change is still present when changing the ostensive aspect top
down. However it is complemented by the possibility of emergent or en-
dogenous change. As described participants have agency within the context
of the routine. In addition, participants could (ab)use their subjectivity
through which they could execute the routine differently than was intended
by the designers. The last source of change is in line with the creation and
modification relation types. Whenever a routine is executed organisational
knowledge or artefacts may be created or modified which could be used as a
reference for future executions. Thus, the (unexpected) output of a previous
iteration may become the input for a new iteration.
2.2 Work system framework
While the organisational routines give insight into the duality between de-
signers and performers accompanied by the influence that performers have
on the design, it only provides a general definition of how work is done
within an organisation. Therefore its usability for analysing organisations
is limited. In order to be able to analyse selected parts of organisations the
work system framework has been used. The work system framework offers
its users a way to look solely on single work systems, which is according to
Alter (2013) usable for analysis. He states that a work system is a natural
unit of analysis for thinking about systems in organisations. The definition
of a work system that is opted by Alter (2013, p75) states:
14“A work system is a system in which human participants and/or
machines perform work (processes and activities) using informa-
tion, technology, and other resources to produce specific product-
s/services for specific internal and/or external customers.”
Figure 2.3: Work system framework (Alter, 2013, p78)
As shown in figure 2.3 the work system framework consists of nine elements.
The arrows between elements indicate that those elements need to be in
alignment. Four of the elements compose the actual work system;
Participant: The participant element consists of those who perform
work within the work system. When a service is provided
to customers, the customers may also be seen as partici-
pants.
Information: The information element consists of the information that
is used, created, captured, transmitted, stored, retrieved,
manipulated, updated, displayed or deleted by processes
and activities. Looking exclusively at computerized in-
formation would be a to restrictive view, therefore infor-
mation that is not computerized should not be forgotten.
An example of this type of information is the content of
conversations between participants.
Technologies: The technologies element consists of both tools that are
used by participants as by automated agents within pro-
cesses and activities.
15Processes & Activities: Processes and activities are mentioned together
to emphasize that the work of participants may not be
performed by clearly specified steps.
Both the products/services element as the customers element are partially
inside and outside the work system.
Products/Services: Products/services consist of information, physical things,
and/or actions produced for the benefit and use of its cus-
tomer(s).
Customers: Customers are those who receive the outcome of a work
system (product/service) for purposes other than per-
forming within the same work system.
Three of the elements are outside the work system, but are relevant due to
their influence on the efficiency and effectiveness of the work system.
Environment: The environment of a work system consists of the play-
ing field in which it operates. Consisting of organisa-
tional, cultural, competitive, technical, regulatory, and
demographic aspects. The organisational aspect is men-
tioned in more detail, stating its inclusion of stakeholders,
policies and procedures, and organisational history and
politics.
Infrastructure: The infrastructure element includes the relevant human,
informational, and technical resources that are provided
by the organisation, but used within the work system.
Which entails less influence by the work system since the
infrastructure is managed outside of it and is shared with
other work systems.
Strategies: The strategies that are necessary to be acknowledged in
a work system framework are the enterprise strategy, the
department level strategy and the work system strategy.
2.3 Experienced Bottlenecks and Solutions
Experiences of participants can be measured in different ways. However
not every manner is appropriate or even useful. Within this paper the ex-
perience of participants is centred around experienced bottlenecks. Which
provides participants to focus on a part of the entire process. Through this
focus participants can be challenged to go into greater detail about their ex-
periences, its causes and their intentions to solve or neglect the bottleneck.
16In most cases bottlenecks will be negative experiences that hinder or upset
the participants. In context of the work system framework each element and
its (mis)alignment can be a source for bottlenecks. Table 2.1 provides an
overview of examples of bottlenecks for most elements. However no exam-
ples were found for both the products/services element and the customers
element in a collection of atleast 18 articles which were full of workaround
examples.
Element Examples of related bottlenecks
Processes and Can be experienced to be cumbersome (Alter, 2014, p1042),
Activities inefficient (Alter, 2014; Ferneley & Sobreperez, 2006), or even
onerous (Ferneley & Sobreperez, 2006, p6). In addtition its
design can be incomplete (Alter, 2014, p1055) or too restric-
tive (Cherns, 1987).
Technologies Can have inadequate system functionalities (Alter, 2014;
Röder, Wiesche, Schermann, & Krcmar, 2015) or malfunc-
tions/failures (Alter, 2014; Huuskonen & Vakkari, 2013).
Information According to Röder et al. (2015, p492) information can be
absent, incorrect, unclear, unneeded. In addition information
can be unavailable (Alter, 2014, p1042).
Participants Can be pretending to comply (Alter, 2014, p1048), personal
opportunistic (Alter, 2015, p4), or have personal goals con-
flicting the organisational goals (Alter, 2014, p1042).
Infrastructure Includes bottlenecks relevant to technologies, information
and participants.
Strategies Misalignment of goals (Alter, 2014, p1043).
Environment Organisational blocks (Ferneley & Sobreperez, 2006, p385),
‘lack of accountability’, ‘drift’, and ‘loss of control’ (Röder,
Wiesche, Schermann, & Krcmar, 2014, p2)
Table 2.1: Examples of bottlenecks within the different work system ele-
ments
Experienced bottlenecks have different consequences for the execution of
work systems (e.g. inefficiency). Which in some cases can be instigated
through the experience and attitude of the participants themselves (e.g.
job dissatisfaction, stress). Furthermore, experienced bottlenecks influence
the (in)action of participants. Röder et al. (2015) confirm prior research
of Petrides, McClelland, and Nodine (2004) that assumes that costs and
benefits determine whether a workaround is executed. This confirmation is
also viable when looking at executing solutions or bringing up the existence
of a bottleneck. The weighing of the costs and benefits is related to the
degree bottlenecks are experienced. When bottlenecks are not considerable,
participants may not act at all. In which case the benefits of eradicating
the negative experience does not outweigh the cost of even reporting the
17issue. On the other hand, the experience of the bottlenecks may be great
enough to the participants to report the issue, create and provide suggestions
for solutions to the managers or even take matters in their own hands by
executing workarounds.
The definition of a workaround that is used within this paper is that of
(Alter, 2014). Through the inclusion of the word goal-driven workarounds
are distinguished from situations where participants deviate unintentionally,
due to lack of knowledge or lack of training. A workaround can both be used
temporary as enduring, which is indicated by the inclusion of both the words
improvisation and structural constraints.
“A workaround is a goal-driven adaption, improvisation, or other
change to one or more aspects of an existing work system in or-
der to overcome, bypass, or minimize the impact of obstacles,
exceptions, anomalies, mishaps, established practices, manage-
ment expectations, or structural constraints that are perceived as
preventing that work system or its participants from achieving a
desired level of efficiency, effectiveness, or other organisational
or personal goals.”
To differentiate between workarounds and solutions the definition of workarounds
is complemented by the notion that workarounds are bottom up changes by
participants. Even if it goes against the wishes of the designers. While
solutions are viewed as top down changes created by the designers. In the
context of organisational change workarounds are viewed as emergent change
and solutions as planned change.
18Chapter 3
Instrument
As stated in chapter 1 the instrument that has been used in the OMNIO-
project consists of a combination of process modelling and experience eval-
uation to identify experiences and views of the attendees. As a basis for the
instrument the CoMPArE modelling method (Oppl, 2016) was used. The
attendees were expected to be inexperienced (process) modellers. Which
gave an incentive for an emphasis on usability by novices. Two properties
of the CoMPArE modelling method helped to accomplish this emphasis.
Firstly, each team of attendees was appointed a trained facilitator to guide
them through the process. According to Oppl (2016) the guidance allows
the attendees to focus on the subject at hand instead of all the facets of
the modelling itself. Secondly a case-based elicitation was used. Which re-
sults in the creation of an instance of the working activities instead of a full
description of all possible workflows. Due to the focus on a singular linear
path there is no need for logical gates or operators in the modelling language.
Oppl (2016) argues that this reduces the number of language elements and
thus the complexity of modelling. With the usage of cases it is important
to note that there could occur two downfalls. Firstly, the created process
models could be viewed as the full description instead of an instance, for
example in this project by the ministry. Secondly the cases could affect the
modelling process in unforeseen ways. Due to interpretation and framing by
its creators (e.g. inclusion/exclusion of jargon of designers). Additionally,
due to the content of the cases themselves (e.g. too abstract or too con-
crete). To overcome these issues the cases have been written by a researcher
and domain expert in combination with a certain design of the content. The
content of the cases only consisted of the description of a situation, exclud-
ing the mentioning of process steps or jargon. The participants were asked
to model what would happen. Starting from the first contact of a customer.
When the process was expected to end was excluded, thus giving the par-
ticipants the ability to determine which process steps were still relevant to
include. The cases that were mainly used within the OMNIO-project are
19included in appendix A.
3.1 Identifying contacts and activities
The process modelling part of the instrument consists of three elements,
namely roles, activities, and contacts. Roles are parties that potentially
act within the process. Parties could consist of individuals, non-organised
groups (e.g. neighbours) or organized groups (e.g. work system, entire or-
ganisation). They are each represented by their own swimlane. The usage
of swimlanes has been inspired by CoMPArE. Within the OMNIO-project
the roles consisted of ‘Initiative Taker’, ‘Municipality’, ‘Others involved’,
‘External Advisor’ and ‘Other Authorities’. The second element, activities,
represented the process steps that a role performs during the case without
contact with other represented roles. The third element, contacts, repre-
sented process steps consisting of communication or the transfer of informa-
tion and/or artefacts between multiple roles. These contacts also incorporate
the communication channels that are used by the roles. Five communication
channels were used within this project. Firstly a channel named ‘Telephone’
was used to represent all vocal communication between actors that were not
face-to-face. Secondly the channel ‘Direct’ was used to represent all face-to-
face communication (e.g. appointments, contact at the front desk). Thirdly
the channel ‘Message’ was used to represent all non-vocal communication
(e.g. letter, email, texting). Fourthly the channel ‘OLO’ (Environmental
Counter Online) was used to represent the project specific governmental
web system that’s in usage by the government. The last channel that was
used was ‘OOrg’ (Other Governmental Websites) representing all govern-
mental websites that were not OLO. In other projects OLO and OOrg could
be merged and called ‘Websites’ to represent all one-sided digital contact
between roles (e.g. searching information, downloading/handing in forms).
20(a) Swimlanes representing the roles (b) Contact between bordering roles
(c) Contact between non bordering
roles
Figure 3.1: Examples of the used modelling technique
Figure 3.1 shows an example of how the different elements are used. The
swimlanes, representing the predefined roles, are the starting point of the
method, as shown in figure 3.1a. Activities are placed within the swimlanes
while the contacts are placed on the edges of the sending role, drawing
an arrow to the receiving role. Which is shown in figure 3.1b. In case of
non bordering roles the actual receiving role is mentioned, as can be seen
in figure 3.1c. The order in which the activities and contacts take place
are represented by their position. The process step which is the starting
point of the process is placed the highest. While following process steps are
subsequently placed underneath. The modelling phase is concluded when
the last process step is identified and the attendees are in agreement over
the completeness of the created model.
3.2 Identifying bottlenecks and solutions
Following the modelling phase the experienced bottlenecks are identified
in the second phase. Together with solutions that have been thought of
and workarounds that are used. Asking questions point blank might have
resulted in incomplete or erroneous answers, since the daily routines may
have become tacit knowledge. Through discussing and modelling the atten-
21dees have thought about their work thoroughly and gained a clearer picture
of its strengths and flaws. Which is followed by the first step of this phase
consisting of the inquiry of estimated durations between the contacts and the
duration of the total process. The facilitators were instructed to get atleast
the estimates between following contacts and of the entire process from start
to finish. By discussing these estimates the attendees might consider some
durations to be peculiar or problematic.
The second step consists of the actual inquiry of the bottlenecks. The
inquiry of the bottlenecks is done by walking through the created model.
Whenever a bottleneck is recognized by the attendees, the facilitator marks
it on the physical model and indexes it by using the index template. The in-
dex template consists of both questions and guiding remarks. The questions
are based on the five W’s method of Hart (1996). Which makes sure most
of the basic need to know information is gathered. Below the he translated
template (original in Dutch) is shown together with the relevant part of the
method of Hart:
• Timestamp (indicator on the audio recording device making it possible
to quickly find the right moment in the recording);
• Indexing number of the bottleneck.
• Bottleneck description (a few sentences at most). (What)
• What triggers the occurrence of the bottleneck? (When, Why)
• Why is it a bottleneck? What is its underlying cause? (Why)
• How is the bottleneck experienced? (How)
• Is there a solution (workaround) for the bottleneck, and is this solution
in fact used? (What)
• Describe the solution. (What)
• In which situations is the solution (not) acted out? (When)
• Is the experience resulting from the bottleneck improved by the solu-
tion? (What)
• Where in the process does the bottleneck occur? (Where)
• Which role in particular is experiencing the bottleneck? (Who)
The first part of the template consists of questions about the experienced
bottleneck itself. After describing the bottleneck, the attendees were asked
in which situations the bottleneck occur, why they perceived it as a bottle-
neck, and what they experienced when the bottleneck occurs. The follow-
ing questions were about potential solutions or already used workarounds.
22Started by asking whether there is a solution for the bottleneck and whether
it is already used. In case a solution is mentioned the attendees are asked
to describe the solution in greater detail, in which situations the solution is
used, and whether the solution improves their experience. The last couple of
questions were focused on the relation between the relevant role(s), process
step(s) and bottleneck. The attendees were asked to determine which role(s)
experience the bottleneck and whether the source of the bottleneck can be
pinpointed to a single process step.
3.3 Execution of the instrument
The instrument was used in a workshop setting. Which were organised six
times in different regions of the Netherlands. Each workshop consisted of
five teams of attendees executing the instrument three times on one day,
once for each process. The attendees during these workshops consisted of
27 public administration bodies (30 invited). Of which 19 were municipali-
ties, 4 were environmental services (omgevingsdiensten) and 4 were regional
water management boards and the national water management board (Rijk-
swaterstaat). To ensure the representativeness of the invited organizations
two selection criteria were used. Firstly the geographical distribution of the
organizations was taken into account, through which most of the regions
of The Netherlands would be covered. Secondly the organizations were dis-
tributed based on the size of their sphere of influence (number of represented
residents). The participating organisations were asked to provide a team of
three civil servants. Each team needed to have domain knowledge on each
of the three processes. Therefore the organizations were asked to select the
civil servants on their knowledge about either inquiry, permit applications,
or enforcement. If multiple options arose, civil servants with enthusiasm
to participate were preferred. In total 68 civil servants participated in the
workshops.
The output created by the civil servants consisted of the modelled pro-
cesses including estimates, as shown in figure 3.2, along with the experienced
bottlenecks. The bottleneck indexes were filled out by the facilitators. Con-
sisting of paraphrases and/or short summaries for each question/statement
of the used index template. In addition each session was audio recorded,
which were to be used as backup.
23Figure 3.2: A finished swim-lane diagram, an action pic, and full harvest(83
scrolls from 6 workshops) Hoppenbrouwers et al. (2018)
3.4 Reflection of the instrument
As stated before an aim of this paper is to provide insight in the instru-
ment. This is done by explaining the instrument and showing what kind of
results can be expected. In addition a way to provide insight is to reflect on
the usage of the instrument. Which is done by looking whether the goals
the researchers had were met, whether expectations came true or not, in
which ways the instrument could be improved, and in which situations the
instrument could be useful.
The goal of the instrument was to identify experiences and views of the
people who perform the work. Since most performers have little to none
modelling experience a sub goal consisted of making sure that both phases
of the instrument were user friendly. The main goal was achieved mostly
according to our expectations. Most invited teams showed up and were able
to complete all three modelling sessions. Only one team could not complete
all three modelling sessions due to lack of domain knowledge of the third
process. In addition the researchers were worried beforehand whether there
24would be a shortage of time. However all teams were done on time and most
were done a lot earlier than expected. Besides successfully creating models
the sessions also provided quite the collection of experienced bottlenecks
in combination with suggested solutions and/or workarounds. The ease
with which attendees talked about their work without holding back was
quite astounding, even though the researchers were expecting that talking
about there work would open them up. An example of the level that some
attendees dared to go consists of a team stating one of their own managers
to be a bottleneck that would only be solved by him retiring in a couple of
years. One of the things that could have gone better was the consistency
between the trained facilitators when considering the way they filled out the
index templates. Some would cite the attendees, while others paraphrased
them or wrote summaries of their answers. While this made analysis harder
sometimes, the quality did not suffer since the facilitators would repeat
the citation, paraphrase or summary to the attendees during the inquiry
and would ask whether they agreed or it should be changed. The result of
the sub goal exceeded the researchers expectations. It was expected that
the usage of a trained facilitator and the simplification of the modelling
language through the use of a case would result in a situation where the
attendees could follow every step that would be taken and consider the
created model theirs. But in many cases the attendees would go a step
further. After an initial instruction and the first modelling session most
groups had familiarised themselves with the instrument. Which resulted
in several teams helping the facilitator. The help ranged from adjusting
answers during the modelling phase to fit the format, writing and/or placing
post-its, placing estimates, and placing markers for the bottlenecks.
When looking at the improvement of the results provided by the instru-
ment it is possible to distinguish two ways to push forward. The first way
consists of increasing the number of teams that attend. Since this could
lead to a better picture of the situation. This picture would be better due
to more views put into it, but also by being able to put views together in
order to enrich the data. A huge problem however with this approach will
be the costs that will scale with the increase of attending teams. More at-
tending teams means either bigger or more locations that need to be rented.
In addition when more teams attend more facilitators need to be trained
and hired. The other way is to push for an increase of quality. Which is
further discussed in chapter 7.
25Chapter 4
Analysis
After the execution of each workshop all generated data was collected, digi-
tised and prepared for analysis. When the last workshop was completed the
analysis was started for the report for the ministry and for this paper. This
chapter firstly introduces the digitisation and preparation steps. Followed
by a description of the analysis and related choices sorted by the research
questions.
4.1 Digitisation
While a full description and its related design choices of the digitisation
of the process models could be considered overkill for the answering of the
research questions, it does simplify the reuse of the instrument. Thus com-
plying with the aim to give insight in the analysis side of the instrument.
The process models were digitised in order to make analysis easier. Since
the process models were made on paper with post-its, which could easily be
misplaced, the digitisation ensured a safer way to save the data. In addition
the researchers could access the data anywhere and simultaneously.
Each step of the digitisation is explained through the use of a simple
process model (see figure 4.1a). Firstly all eight process steps are described
separately. Starting with their names, followed by the involved role(s). In
case of an activity only one role can be involved, while at least two roles
need to be involved in case of a contact. In addition the used channels were
only described in case of a contact. Whenever a process step contained a
bottleneck, the unique code of the bottleneck in question was added to the
description. The unique code comprised the date of the workshop, the team
number of the modellers, the process that was modelled and the number of
the bottleneck.
26(a) Abstracted example of a process (b) Names of process steps of the ex-
model ample of 4.1a
(c) Example of the numbering of the
process steps of 4.1a
Figure 4.1: Example of a created process model and its numbering
Secondly the order of the process steps was described. While only instances
of the work system were modelled and thus logical gates or operators were
not needed in the modelling language, the process model itself was not
simply sequential. Due to the usage of swim lanes, each representing a
different role, multiple process steps could occur in parallel. The example
of figure 4.1a shows a case in which activities 4 and 5 are instigated and
completed in parallel, since they both start after the municipality has send
their request for advice and both end before the external advisor sends its
advice report back to the municipality. Therefore the representation of the
order of the process steps needs to be able to take AND-split and AND-
merge operators into account. Figure 4.1c depicts the need for a AND-split
when process step 3 is followed by both 4 and 5. In addition it depicts the
need for a AND-merge when process steps 6 and 5 are both followed by 7.
The placement of the AND-merge is in this example depended on the context
of the process model. Since the decision taken in process step 7 needs both
the advice report and the output of the internal discussion. The format that
27was used within this project consisted of providing each process step with a
number and the number of the previous process step. The number that each
process step was provided was based on the chronological order, in case of
parallel process steps the most left one was counted first.
Thirdly the estimated duration between process steps and of the whole
process were digitised. Due to the instruction of the facilitators (atleast the
estimates between following contacts and the entire process) there was room
for the facilitator and the participants to take initiative and make more es-
timates or in a more free form. For example also providing estimates across
multiple contacts, making estimates of activities that belonged together, or
even of a single process step. In some cases this resulted in overlapping esti-
mates. Besides the addition of non-required estimates the used instruction
resulted in a variety of ways in which the estimates were expressed. Firstly
the time unit of the estimates was not fixed. Therefore it was possible for
the participants to state that the estimate between some process steps con-
sisted of x amount of days and other estimates x amount of hours, weeks,
or even months. Secondly participants sometimes expressed the estimates
with words like ‘at least x’, ‘maximum of x’ ‘between x and y’. Due to
potential overlapping estimates, the intermingling of time units, and the use
of ‘mathematical’ expressions it was chosen to use a simple and broad way
of digitising. The used form consisted of the usage of three columns. The
first consisted of the starting process step. The second mentioned the end-
ing process step. In case of an estimate of a single process step the second
column was kept empty. The third column consisted of original estimation,
thus not translating the statement in a single time unit or the removal of an
expression.
Lastly the bottlenecks were added. Which were already digital due to
the inclusion in the procedure of the filling of the indexes by the facilitators.
They only needed to be matched with their relevant process model through
their unique code. Some bottlenecks were not directly matched since they
were statements over the overall process. Due to the choice of only analysing
bottlenecks that were directly matched with a process step(s), some bottle-
necks were not taken into account while others were mentioned in regard
with multiple process steps and thus accounted for multiple times. There-
fore results may differ from those of the report send to the Dutch Ministry
of Infrastructure and the Environment. This choice was made due to the
research design of previous iterations, in which the potential influence of the
type of process step(contacts or activities) played a bigger role.
4.2 Analysis first research question
As described in chapter 1 the first research question has an emphasis on the
experienced bottlenecks. In order to be able to answer this question several
28steps have been taken. Firstly a set of bottlenecks have been transcribed
which was followed by the creation of a codebook, and the clustering and
classification of the bottlenecks. Below each step has been described.
4.2.1 Clustering bottlenecks
Before the clustering took place it was chosen to use the raw data as a basis
for the clustering, since the indexes consisted of paraphrases and/or short
summaries. The raw data that was used consisted of the audio recordings.
Of which a subset of the mentioned bottlenecks was transcribed. Each
transcription of a bottleneck consisted of the full dialogue and discussion
of the questions posed by the facilitator. In order to separate bottlenecks
the timestamps of the indexes were used as a guideline, but was deviated
from based on the actual content (Sometimes facilitators were unable to
note down the exact time). The subset of transcriptions consisted of 50
bottlenecks, which was about 25 percent of the total amount of bottlenecks.
In order to make the transcriptions as representative as possible the selection
of the bottlenecks was made based on the correspondence of two ratio’s.
Firstly the ratio between the three processes (‘inquiry and information’,
‘application’, ‘inspection and enforcement’) was used. Secondly the ratio
between the six workshops was used. These ratio’s ensured that bottlenecks
of each process were equally represented and each participating region of
the Netherlands was represented. Since public administration bodies would
participate at the nearest workshop. In addition as many as possible of the
participating teams were selected within the two previous ratio’s.
The creation of the clustering based on the transcriptions consisted of
five steps. With each step the codes of which the clustering consisted were
refined. The first step consisted of creating an initial codebook based on the
first 25 transcriptions. The second step was performed together with a re-
searcher from the OMNIO-project1 . Which consisted of adding codes to the
codebook based on his observations of the bottlenecks that were mentioned
in the questionnaires. These questionnaires, part of the OMNIO-project,
were held during the workshop day and contained questions about the expe-
rience on the overall processes. The third step consisted of both researchers
using the codebook to analyse the remaining 25 transcriptions. Due to
different perspectives and approaches the interrater reliability was question-
able. In order to increase the interrater reliability rating the fourth step
consisted of adjusting the used codebook. The adjustment consisted of both
adding, splitting, merging and changing (focussing or widening) the codes
and by creating an unison of the coding approach. The fifth step consisted
of applying the adjusted codebook on all the bottlenecks mentioned in the
questionnaires. During the comparison of the results both researchers felt
1
Many thanks to Marcel van Heerdt
29that they were on the same page and had created an approach that was
repeatable. In addition the project leader of the OMNIO-project deemed
the reliability sufficient for its purpose within the project. Appendix B de-
picts the finalised codebook that was used in order to cluster all (remaining)
bottleneck indexes.
4.2.2 Classifying bottlenecks
In addition to the clustering of the bottlenecks, the bottlenecks were grouped
based on an adjusted version of the Work system framework of Alter (2013).
Which was done in order for the results to be no longer bound to the context
of the OMNIO-project. Hence using the framework as a tool to compare
experienced bottlenecks between projects/contexts or a changing context
over time. The adjustment of the framework of Alter (2013) consisted of
two changes, which were decided during the creation of the codebook.
The first change was the exclusion of the ‘infrastructure’ element. As
stated before this element includes the relevant human, informational, and
technical resources that are provided by the organisation, but used within
the work system. The decision to exclude the infrastructure element was
made due to the lack of distinction between the work system of the par-
ticipants and their entire organisation during the workshops. Which was
caused by the roles that were chosen for the modelling sessions. Another
reason for the exclusion of the infrastructure element was the fact that is
entailed practically three of the main elements of the work system. The
human resources could be compared with the participants element, the in-
formational resources with the information element, the technical resources
with the technologies element. When the infrastructure element would be
used in its entirety it potentially would result in most bottlenecks being
classified as part of this element. Therefore providing less information than
desirable. Even if the element was to be used it would have to be designed
to be split up into three subelemtents along the lines of the three men-
tioned resources (e.g. ‘infrastructure human’, ‘infrastructure informational’,
and ‘infrastructure technical’). In hindsight it would have been better to
include these subelements for a different distinction. Instead of the distinc-
tion between the work system itself and its organisation, it would have been
informational if these subelements were used for the distinction between the
bottlenecks caused by the organisation and the roles ‘external advisers’ and
‘other authorities’. Especially within the context of governmental projects
this distinction could be informational as administrative bodies potentially
have a bigger influence on other administrative bodies than other types of
organisations have on each other.
The second change/decision was a minor one. It was the reposition-
ing of the ‘knowledge of the participant’, which could both be part of the
‘information’ and ‘participant’ element. Making a distinction is hard since
30You can also read