Commodity ValueGuide - Bullion to outrun industrial metals as trade war escalates - Sharekhan, Commodity
←
→
Page content transcription
If your browser does not render page correctly, please read the page content below
Bullion to outrun industrial
              metals as trade war escalates

            Commodity ValueGuide
            June 2019

Regular Features
• Monthly Trend
• Forthcoming Economic Events       For private circulation only

www.sharekhancommodity.com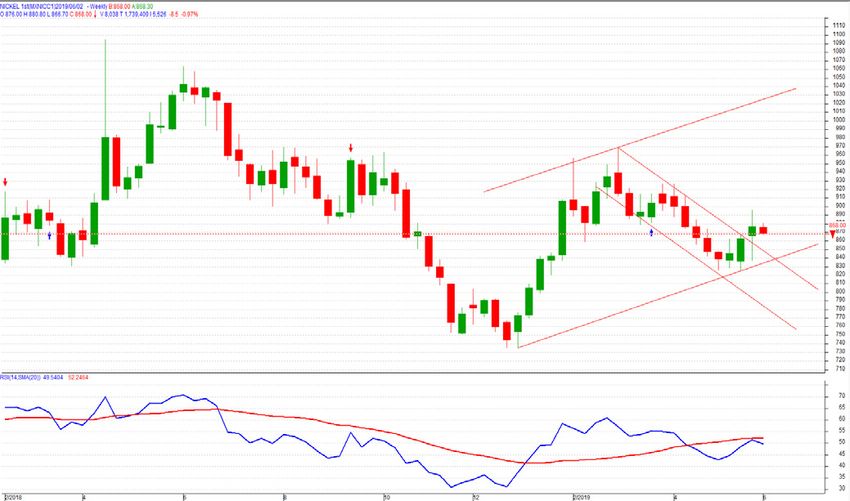
Call : 3970 8090 (prefix local code) | DialnTrade: 1-800-22-7004 (Toll Free) | Email:support@skcomtrade.com
                                          Log on: www.sharekhancommodity.com
Sharekhan Comtrade Pvt. Ltd. SEBI Regn. Nos.: MCX-55400 : INZ000041331 ; NCDEX-1227 : INZ000041331 ; For any complaints email at
igc@skcomtrade.com ; Registered Office: Lodha iThink Techno Campus, 10th Floor, Beta Building, Off JVLR, Opp. Kanjurmarg Railway
Station, Kanjurmarg (E), Mumbai - 400042. Maharashtra. Tel No.: 022 – 6115 0000; Fax No. : 022 – 6748 1899. Disclainer: Client should
read the Risk Disclosure Document issued by SEBI & relevant exchanges and Do’s & Don’ts by MCX & NCDEX and the T & C on
www.sharekhancommodity.com before investing.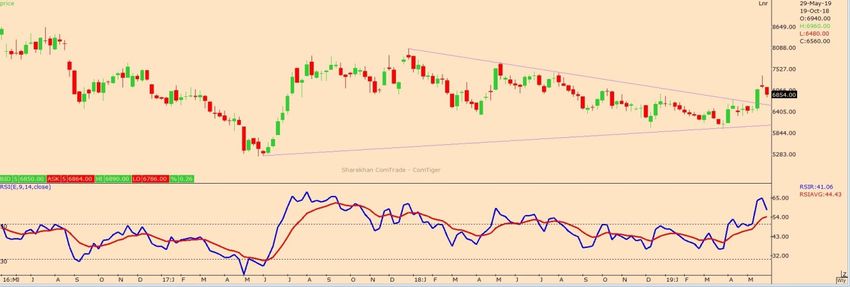
CONTENTS

From the Editor’s Desk
Bullions seen outperforming industrials as trade war escalates
Breakdown of the US-China trade talks coupled with Mr Trump threatening tariffs on Mexico and removing India’s export
benefits weighed on the risk assets and gold duly rallied amid the meltdown in the wider markets. The 10-year US
treasuries continued their monstrous rally as the yields fell sharply....                                        04
MONTHLY VIEW
Commodities: Gold rallies sharply on safe demand                                   Events watch- Major economic events                                                     09
                                                 05
as risk assets fall                                                                Agri Ministry forecasts 2018-19 food grain output
                                                                                                                                                                            12
WTI Crude oil                                    06                                at 283.37 million tonne
Natural gas                                                             06         Cotton seed oilcake                                                                      13

Gold                                                                    06         Turmeric                                                                                 13

Silver                                                                  07         Barley                                                                                   13

Zinc                                                                    07
Copper                                                                  08         TREND & VIEW
Lead                                                                    08         Gold: Positive bias                                                                      14

Nickel                                                                  08         Nickel: Trending positive                                                                14

Aluminium                                                               08         Turmeric: Change in trend                                                                14

                           Sharekhan Comtrade Pvt. Ltd.
                           Registered Office: Lodha iThink Techno Campus, 10th Floor, Beta Building, Off JVLR, Opp. Kanjurmarg Railway Station, Kanjurmarg (E), Mumbai - 400042.
                           Maharashtra. Tel No. : 022 – 6115 0000
                           SEBI Registration Nos. : INZ000041331; MCX-55400; NCDEX-1227. CIN No. U65100MH2015PTC269036. For any complaints email at igc@skcomtrade.com
                           Business Activity: Sharekhan Comtrade Private Limited is into the business of Commodity Broking.

  Disclaimer: This report/analysis/call/score card by whatever name called (hereinafter collectively referred as
  Research”) has been prepared/ made pursuant to Research made by the Research Analysts is neither a solicitation
  nor a recommendation to buy/sell any commodity(ies). It does not take into account the particular investment
  objectives, financial situations, or needs of individual recipients and other issues (prohibitions to investments due to
  law / jurisdiction issues etc.) which may exist for certain persons. Recipients should rely on their own investigations
  and take their own professional advice before investment. Sharekhan Comtrade Private Limited and its associates,
  subsidiaries and associated companies, their directors and employees and/or its associates (hereinafter referred as
  Sharekhan) will not treat recipients as customers/ clients by virtue of their receiving this report. This Research may
  have been prepared/ made based on the analysis of data available publicly and/or other sources believed to be
  reliable. Sharekhan, does not, accepts any liability arising from the use of this information. The user assumes the
  entire risk of any use made of this research. Price and value of the securities referred to in this Research call may go
  up or down. Past performance is not a guide for future performance. Research based on technical analysis centers
  on studying charts of price movement and trading volume, as opposed to focusing on fundamentals and as such,
  may not match with Research based on fundamentals. Opinions expressed are our current opinions as of the date
  appearing on this Research only. We do not undertake to advise you as to any change of our views expressed in this
  Research. Research reports / recommendations may differ between Sharekhan’s RAs and/or Sharekhan’s associate
  companies on account of differences in research methodology, personal judgment and difference in time horizons
  for which recommendations are made. User should keep this risk in mind and not hold Sharekhan, its employees and
  associates responsible for any losses, damages of any type what so ever.
  Sharekhan and its associates or employees may: (a) from time to time, have long or short positions in, and buy or sell
  the investments in / securities of company (ies) mentioned herein or (b) be engaged in any other transaction involving
  such investments / securities and earn brokerage or other compensation or act as a market maker in the financial
  instruments of the company (ies) discussed herein or act as advisor or lender / borrower to such company (ies) these
  and other activities of Sharekhan and its associates or employees may be construed as potential conflict of interest
  with respect to any recommendation and related information and opinions. Without limiting any of the foregoing, in
  no event shall Sharekhan and its associates or employees or any third party involved in, or related to, computing or
  compiling the information have any liability for any damages of any kind.
  The analyst certifies that the analyst has not dealt or traded directly or indirectly in securities of the company (ies)
  and that all of the views expressed in this document accurately reflect his or her personal views about the subject
  company(ies)/Commodity(ies) and do not necessarily reflect those of Sharekhan. The analyst further certifies that
  neither he nor his relatives has any direct or indirect financial interest nor have actual or beneficial ownership of 1%
  or more in the securities of the company (ies) or Commodity(ies) nor have any material conflict of interest nor has
  served as officer, director or employee or engaged in market making activity of the company. Further, the analyst
  has also not been a part of the team which has managed or co-managed the public offerings of the company and
  no part of the analyst’s compensation was, is or will be, directly or indirectly related to specific recommendations or
  views expressed in this research document.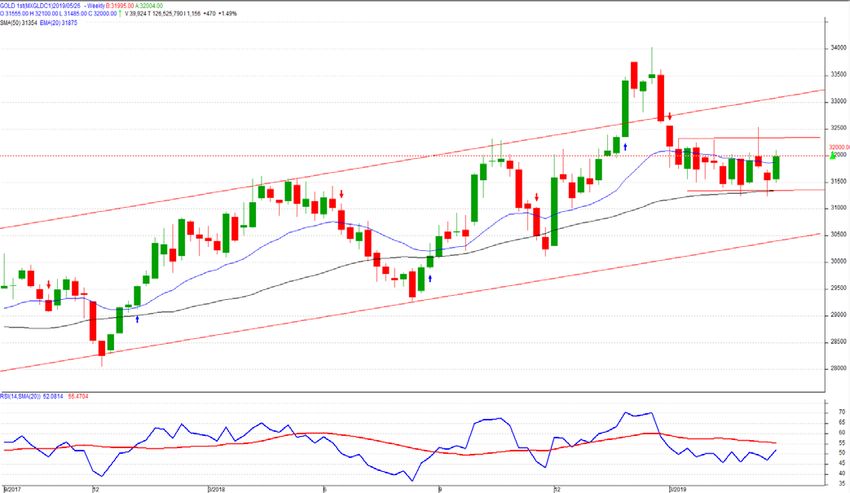
From the Editor’s Desk
From the Editor’s Desk Bullions seen outperforming industrials as trade war escalates
Breakdown of the US-China trade talks coupled with Mr Trump threatening tariffs on Mexico
and removing India’s export benefits weighed on the risk assets and gold duly rallied amid
the meltdown in the wider markets. The 10-year US treasuries continued their monstrous rally
as the yields fell sharply. The talks of 10 year yields falling to 2% are gaining currency as the
bond traders see 3 rate cuts by the end of 2020. The US Federal Reserve Chairman Mr Powell
stated that the Fed is closely watching the trade war situation, thus affirming the dovish tilt in
the outlook. In this scenario, the global bonds are rallying sharply.
Gold, initially lagging the bond rally, ultimately flared up as the risk assets finally started
breaking down sharply. Industrial commodities followed risk assets lower as zinc and crude oil
tumbled. Silver has been lagging gold on account of the former being the industrial commodity
too.
The risk assets and industrial commodities are trying to stage a rebound on the rate cut bets.
Crude oil has suffered the worst among industrials as the US supply glut continues to outweigh
Iran and Venezuela supply concerns.
While rate cut possibility is beneficial for the industrial commodities, it is supportive for
precious metals too. Thus, in this situation, we see precious metals outperforming the industrial
commodities. More so, as the US data have started trailing the forecast, which means that
trade issues have started affecting the last major strong economy too.
The Ministry of Agriculture released their Third Advance Estimates for 2018-19 wherein it
pegged output of food grains at 283.37 million tonne. This was marginally lower compared to
the previous year’s record output of 285.01 million tonne. Output of rice was forecast at record
115.63 million tonne while output of wheat is pegged at record 101.2 million tonne.
Output of coarse cereals is estimated at record 43.33 million tonne while output of pulses is
estimated lower at 23.22 million tonne. Output of oilseeds is estimated marginally lower at
31.421 million tonne while cotton output may fall to 273.93 lakh bales. Sugarcane output is
estimated at record 400.369 million tonne. The onset of monsoon is also delayed and is now
expected to touch Kerala around June 8, 2019.
In May, cotton seed oilcake stood out as the biggest gainer in the agricultural commodities
basket posting 9.57% returns on account of lower output and robust demand from the feed
industry. Turmeric and chana were the second and third biggest gainers with 6.87% and 5.42%
returns respectively last month. Turmeric gained on good export demand whiles chana gained
on concerns over output. RM Seed gained 4.33% while refined soy oil gained 3.63%. Barley
was the biggest loser with 3.87% losses due on declining demand at higher levels. In the guar
complex, guar gum lost 3.62% while guar seed declined by 2.87% in May on expectations of
higher crop next year while CPO declined by 2.97% on weak overseas markets.
Going forward, we expect most agri commodities to trade on a positive note. The delay in
the onset of monsoon may lead to delay in the sowing of kharif crops. There may also be
crop shifting due to delayed rains. Though the weather forecasters have predicted normal to
near-normal monsoon even with weak El-Nino, we may witness below normal sowing if we
receive below normal rains. Arrivals of Rabi crops are also in full swing, and will gradually start
to decline. However, if the monsoon progresses well after the onset, we may witness good
sowing, which may cap sharp gains and may also pressurize prices. Prices may also take cues
from the movement in the rupee.
June 2019 4 Commodity ValueGuideCommodity FUNDAMENTALS Monthly View
Commodities: Gold rallies sharply on safe demand as risk assets fall
Macro-economy
Bonds rally globally on rate cut bets Commodity prices in May 2019 (in $)
Risk assets under pressure as trade war escalates Commodity High Low Close Monthly
change (%)
10-year US treasury yields fall sharply as 2% seems
Aluminium 1871 1765 1794.5 -0.14%
inevitable
Copper 6461 5804 5830 -9.12%
Crude oil falls on US supply gut Lead 1967 1733 1805 -6.23%
ECB’s Draghi: Protectionism and global headwinds Nickel 12495 11725 12017 -1.51%
Zinc 2845 2504 2524 -10.67%
weigh on the economy
Gold 1311.9 1273 1305.8 1.56%
ECB: interest rates to stay at current levels through first Silver 15.04 14.26 14.567 -2.78%
half of 2020 Crude oil 65 53 53.5 -16.41%
US trade deficit smaller in April; trade gap with China Natural gas 2.7 2.44 2.45 -4.85%
increases Source- Bloomberg
Trump: China’s trade tariff decisions to come in the next
two weeks
Bank of Japan stimulus bets climb
Monthly change in DOE crude and fuel stocks (May 2019)
Trump: “Not enough progress in talks with Mexico”
Crude oil Distillate Gasoline Cushing stocks
US ISM non-manufacturing datum better than forecast Change in (kbls) 5900 -900 4200 2403
US ISM manufacturing fell to 52.1 in May from 52.80 in 31/5/2019 476500 124800 230900 49053
April Change in (%) 1.25% -0.72% 1.85% 5.15%
Refinery utilisation rate was 89.2 % on 26/04/2019
US ISM manufacturing: Weakest expansion since 30/4/2019 470600 125700 226700 46650
October 2016 Source- Bloomberg
US factory gauge falls to the lowest level in Trump’s
era
Euro-zone manufacturing PMI at 47.70 in May; fourth
Monthly change in SHFE stocks May 2019
consecutive month of contraction Copper Lead Zinc Nickel Aluminium
Euro-zone services PMI increased to 52.90 in May from Change (in tonne) -95673 -6220 -50453 -984 -227637
52.80 in April 31/5/2019 1,65,739 30,682 59,351 9,938 5,07,353
Change (in %) -36.60% -16.86% -45.95% -9.01% -30.97%
China Caixin manufacturing PMI unchanged at 50.80 in
30/4/2019 2,61,412 36,902 1,09,804 10,922 7,34,990
May; market consensus 50.20 Source- Bloomberg
2019 turning to be the worst year for the world trade on
trade wars
IMF pares down China’s growth rate by 10 bps to 6.2%
Monthly change in LME stocks (May 2019)
in 2019 and 6% in 2020 on trade concerns
Copper Lead Zinc Nickel Aluminium
China issues travel advisory on the US for its citizens Change (in tonne) -17175 -4750 19475 -14664 80375
through 2019 31/5/2019 212000 69700 100800 158604 1155025
Change (in %) -7.49% -6.38% 23.95% -8.46% 7.48%
Euro-zone concerned with Italy’s budget deficit
30/4/2019 229175 74450 81325 173268 1074650
Gold rallies on safe haven demand Source- Bloomberg
The US ADP data showed employers added merely
27K jobs in May
June 2019 5 Commodity ValueGuideMonthly View Commodity FUNDAMENTALS
Energy: Fear of recession halts crude rally Middle East tensions and the ongoing OPEC-led crude
WTI fell 17% in May output cut deal; prices remained lull during the week. U.S.
production keeps putting downward pressure on price. WTI
Biggest monthly fall for the year
support remains at $50 and resistance remains at $57/b. At
Oil retreats from a 4 year high MCX Crude is expected to trade in the range of Rs.3400 –
WTI Brent spread thinnest for the year Rs.3800/- per barrel for the month.
Domestic US Crude reserves swell 8.4%
OPEC production dips further : Survey Natural Gas- CMP - Rs. 162 (MCX June Contract)
OPEC compliance @ 145% in March Natural gas prices fell around 5% on rising inventories in
Sanctions hit Iran production and exports the US. The prices are hovering around a 3-year low. The
OECD warns of slowdown , US inventories have risen for the 10th straight week as the
shale basin production surged.
US production jumps to 12.3 mbpd
Overall inventories are still around 10% lower from 5-year
Natural gas prices drop to 3-year low on bulging
average and last year’s level for this period of the year,
stockpiles
which is a bullish sign for the counter in medium term.
Natural gas prices falling globally
Weather is not proving to be of much support to the counter
as strong demand for power generation is still missing.
WTI Crude oil- CMP - $53 Higher LNG and pipeline exports and inventory situation
The Nymex crude oil settled lowest in six months to end are positive for the counter in long term, though we see
May month at $53.5 per barrel. WTI crude posted a loss of further downside in near-term.
8.7% for the week and ended the month over 16% lower- The counter is expected to trade between Rs 140 and Rs
than the first monthly loss of the year. 170 in near-term with a downward bias.
The early survey for May month production from Reuters
shows, OPEC’s oil production dropped to a 2015 low of
Bullion- Gold out of shackles as recessionary fear on rise
30.17 million bpd in May, as a major 200,000-bpd increase
in Saudi Arabia’s production was unable to offset an even Gold settle positive during May,
larger production decline in Iran after the U.S. removed Gold premiums surges in China
all sanction waivers for Iranian buyers. Iran’s oil supply Gold demand fades in India
dropped by 400,000 bpd month on month, while Venezuela US T –bill yields fell
saw another 50,000-bpd decline amid the U.S. sanctions
Indian gold demand up 5%,
and continuously plummeting oil production in a severe
economic crisis. OPEC alliance Russia’s output fell to 11.11 Central banks gold reserves jumps
million barrels per day (bpd) in May, down from 11.23 million PBOC added gold
bpd in April. The Organization for Economic Co-operation Dollar Index hits 23 months high
and Development expects world GDP growth to slow from
Nyrstar halts silver production at world’s third largest
3.5% last year to 3.2% this year, before picking up slightly
silver refinery following a damage to the blast furnace
to 3.4% next year. Trade tensions are the principal factor
threatening the global economy. Silver plays catch up with gold rally though it continues
to lag
We expect prices of crude oil to remain under pressure
amid a slowdown of global economy due to US-China
inflicted trade wars hampering rest of the world. While Gold- CMP - $1325 (spot)
Saudi Arabia starts to pump higher oil, US production has Gold at Comex turned rose 2% during May to settle at to
jumped significantly in last 6 months. The fears of a global settle at $1,311.0 an ounce, after 3 months of consecutive
recession are now mounting as Trump plans to throw every loses. Gold prices rose on last trading session of May
nation under its tariff radar and puts the global growth to their highest in more than two months as heightened
outlook into question. The disappointing manufacturing Sino-US trade tensions and Washington’s threat of tariffs
data from China shows contraction, while US indicates a on Mexico stoked worries of a global recession and drove
possible slowdown in the largest energy market. Despite investors to seek refuge in safe-haven bullion.
June 2019 6 Commodity ValueGuideCommodity FUNDAMENTALS Monthly View
Gold demand stayed strong in China during May as the China’s unwrought copper fell 25% M-o-M
premiums over official buying prices stayed in range LME Zinc premiums surges to $161/ton
of $10-14 per ounce. Weak Yuan and lower gold import
Shanghai copper inventories fell 36%
volumes also pushed premiums higher. Net gold imports
via the main conduit Hong Kong rose 20.5% in April from Shanghai zinc inventories fell 46%
a month ago but were down about 17% on year in the first US Auto sales drops 2.3% April
four months.
Gold has been struggling to make headway this year China’s latest stimulus package is feeding through to a
even as global tensions picked up, losing out as investors flagging manufacturing sector.
preferred the haven of US Treasuries, with yields on 10- The LME’s index of six major industrial metals index plunged
year notes at a 20-month low. The two years note yield 5 percent in May and recorded a 10 percent decline in 3
plunged 13.6 basis points to 1.937% to mark its biggest daily months. Zinc and copper remain the major contributor for
drop in a year. Falling yields were the reasons for investors the metal index fall. The trade war is getting international.
to switch to gold as an alternative investment demand at Lead tanked the most on global auto demand concerns,
times of economic stress. while zinc was offset by outperforming all the metals amid
Another supportive factor for gold is the potential for an US tight supply and sharp declining inventories. The ongoing
rate cut. The Federal Reserve is prepared to ease if it sees trade negotiation talks between US-China is driving the
mounting risks to the expansion, in our view; gold appears metal prices on optimism
to be consolidating around the $1,265 level. A close above
$1325 would is a bullish signal while a close below $1300
Zinc - CMP - Rs. 204 (MCX June)
would be bearish, at MCX gold prices to follow international
gold prices and it looks to trade in the broader range of Global zinc prices remain the biggest loser among metals
31000-32800. during May, dropping to a six-month low in Shanghai and
four- month lows in London, as the global outlook for
manufacturing deteriorates.
Silver- CMP - $14.90 (spot)
LME Zinc fell $300 or 10% during May months to settle at 4
Silver has been trading mostly like an industrial commodity, months lows of $2524 a ton in London. As the manufacturing
thus it is not surprising that the white metal fell nearly 3% and infra structure activities hit a rough patch in China after
in May, while gold rallied nearly 2%. Gold-silver ratio has US-China broke out of the trade negotiations in May.
become completely skewed in favour of gold on safe and
Global zinc market returned to a deficit of 40000 tons in
gold ETF inflows dynamics. The ratio stands over 90 – a
March from a small surplus in February. Global refined zinc
ratio not seen since 1923.
output was 1.088m tons in March, compared with usage of
US silver exports to India have rocketed to record highs 1.132m tons. But actual production in China fell 4.4% in the
in the past six months. Metals Focus Consultancy sees a first four months of the year while global production slipped
stronger silver demand in India in 2019. by about 3% in the first two months. Chinese Refined zinc
The metal can see a violent rally on short covering as the imports came in at 77,584 tonnes, the highest monthly
net speculative short position is at its highest level since import number since December.
November. The availability of metals in physical markets remained tight,
We see silver trading between $14.50 and $15.50 and which drove the LME premiums over cash to $161per tone,
suggest buying on dips as the metal is slowly gaining its highest level since 1997. The warehouses continues
investors’ attention on escalating trade wars. to remain tight as the Zinc prices were by the physical
premiums, which surged to $134 per ton highest since 1997
Base metals- Trade wars escalation dents metals demand at LME, indicating near term tightness.
Zinc plunged 10%, Headline stocks of zinc in LME-registered warehouses
rose 24% or 19400 tons, while the inventories fell 45% at
Chinese Refined zinc imports surges
LME. Mine production from Australia and India is expected
China refined copper imports drop to rise in the second half of 2019. Chinese smelters are
Refined copper output jumps 10%,, expected to churn greater amount of refined metals for the
same period.
June 2019 7 Commodity ValueGuideMonthly View Commodity FUNDAMENTALS
We believe any correction should be considered a buying We expect lead prices to remain sideways as the climate
opportunity .Zinc is likely to trade between R s 195 to Rs for lead metal remained subdued amind escalation of US-
210 per Kg at MCX, China trade wars. Lead prices at MCX are likely to trade
between Rs 145 and Rs 160.
Copper- CMP - Rs. 405 (June) Nyrstar has halted lead production at Port Pirie smelter in
Australia.
Benchmark copper prices on the London Metal Exchange,
trading at around $5,850 a tonne, have tumbled nearly 9%
this month. Nickel- CMP - Rs. 848 (MCX June Contract)
However, disruptions in top producer Chile, political and Both nickel and aluminium escaped the vicious selloff in
power problems in Zambia and restrictions on scrap imports the base metals segment in May. The alloying metal fell
into China are expected to weigh on copper supplies in the only 1.50%.
second half of 2019. The metal continues to get some support from the demand
World copper mine production fell 1.8% through the first two from the electric vehicle sector, but increasing nickel pig
months of the year and expected to continue for the year. iron production in Indonesia and China is still putting a lid
Output from Zambia, Peru and Chile is expected to fell this on the prices. The metal continues to be in deficit which is
year. In Chile, state-run miner Codelco could be facing a expected to continue into the next year as well.
strike at its giant Chuquicamata mine, one of Peru’s biggest Rising SHFE inventory is yet another negative factor the
mines, Las Bambas churns out about 400,000 tonnes of metal prices. LME inventories continue to fall, cancelled
copper a year is facing labour union issues. tonnage is sharply coming down though.
We expect copper to perform fairly well in the second Norilsk Nickel stated that the company is yet to feel the
half of the year. The recent trout of metal is fuelled by the heat of global trade war.
escalating trade tension between US-China and US against
The metal is expected to trade between Rs 800 and Rs
the rest of the world. Chinese central bank is pumping
880 in the near-term.
enormously into system to revive the economy. We could
see copper prices making base around $5600 and should
rally to $6100 at LME and MCX could see range of Rs Aluminium- CMP - Rs. 143(MCX June Contract)
390/425 kg. Aluminium bucked the downtrend in the base metals space
in May as it closed slightly higher. The inventories at SHFE
warehouses have started coming down sharply, which is a
Lead- CMP - Rs. 153 (MCX June)
positive for the prices of the metal. The SHFE aluminium
The benchmark LME lead prices fell 6% in May to settle
inventories fell over 30% in May, though LME inventories
at $1794 a ton, the metal is down 16% in 3 months and 11
were up around 8%.
percent for 2019.
Restrained production in China is positive for the metal in
Lead remained the biggest loser among metals year till
long term.
date down 11% in 2019. The metal which has its usage in
As per the World Bureau of metals statistics (WBMS), the
the auto batteries is hit hard by the trade wars. The auto
primary aluminium market was in a deficit of 2k Tonne in
sales in China sank 17.7% in April from a year earlier, the
January-March 2019 period as compared with a deficit of
10th straight month of decline amid trade tension with
969K tonne for the whole of 2018. The global aluminium
Washington and an economic slowdown. While in US, U.S.
production was up 3.3% in January to March 2019 period.
auto sales are expected to be about 16.9 million units in
Chinese apparent demand was nearly 7.6% higher in the
2019, a 2.5% fall from 2018,
same period over 2018.
Refined lead was in surplus as production was 1.074m tons
The metal is expected to trade largely between $1700 and
in March vs usage of 1.064m tons
$1850 in near-term. On the MCX, we expect the range of
Rs 137 to Rs 150 in near-term.
June 2019 8 Commodity ValueGuideCommodity FUNDAMENTALS Monthly View
Global economic calendar June 2019
Date Region Event Survey Actual Prior Impact
3-6-19 China Caixin Manufacturing 50 50.2 50.2 The number is better than the government's estimate that
PMI showed that manufacturing is still in contraction. Expansion
as indicated by the number is positive for the industrial
commodities, though trade wars limit the upside.
3-6-19 US ISM-Manufacturing 52.1 52.8 The data trailed the forecast; hence it is negative for the
PMI industrial commodities.
3-6-19 UK Manufacturing PMI 53.2 53.1 55.1 Data topping the forecast is somewhat positive for the UK
Pound.
5-6-19 China Caixin Services PMI 52.7 54.4 Service sector slowed down in May in China but still holds
above contraction level
5-6-19 US ADP Non-Farm 27k 275K Disappointing datum indicates dismal non-farm payroll report,
Employment Change and is negative for the US Dollar and positive for gold.
5-6-19 US ISM Non- 56.9 55.5 This is a major data as the services constitute nearly two-
Manufacturing PMI third of the US economy. The data trailed the forecast, hence
the overall impact is Dollar bearish. Gold likely to benefit
eventually.
6-6-19 US ECB Press ECB's Draghi ruled out further easing, sees trade issues
Conference affecting the economy, inflation seen picking up towards the
end of the year.
7-6-19 US Non-Farm 196K 181K Going by the ADP data, NFP report is likely to be a dampener
Employment Change for the US Dollar and positive for bullion prices.
7-6-19 US Average Hourly 0.20% 0.40% The market participants will be looking both at the non-farm
Earnings m-o-m payroll figure as well as the earnings data. A robust data
would be positive for the US dollar and negative for the bullion
counters. Industrial commodities can initially fall on stronger
dollar.
7-6-19 US Unemployment Rate 3.80% 3.80% The market participants would be looking forward to all the
details and figures in the NFP report. Lower rate will be positive
for the US Dollar and negative for the bullion counters.
10-6-19 UK GDP m/m Disappointing GDP number will put pressure on UK Pound and
industrials. The country is facing leadership issues amid Brexit
chaos.
10-6-19 UK Manufacturing Bearish data would be negative for the industrial commodities
Production m/m and the UK Pound.
June 2019 9 Commodity ValueGuideMonthly View Commodity FUNDAMENTALS
Date Region Event Survey Actual Prior Impact
11-6-19 US PPI m-o-m 0.20% 0.00% If the data turns out to be better-than-forecast, it will be deemed
positive for the US dollar as it will decrease the possibility of
an immediate rate cut in the US. In that case, commodities can
fall. As such the US Fed sees slower inflation rise, and has
indicated rate cuts due to negative impact of trade concerns.
12-6-19 US CPI m/m Commodities can fall on better than expected number. As such,
the US Fed sees slower inflation rise, and has indicated rate
cuts due to negative impact of trade concerns.
13-6-19 China Trade Balance Increasing US trade deficit will be deemed somewhat negative
for the base metals and other commodities as it would stoke
the fear of escalating trade tensions.
14-6-19 China Industrial Production Slowing down China's economy is a great concern for the
y/y industrial commodities. Disappointing numbers will be bearish
for the industrials. Jan number was disappointing.
14-6-19 China Fixed Asset Data topping the forecast would be positive for the base metals
Investment ytd/y and energy counters; however Jan figure was disappointing.
14-6-19 US Retail Sales m/m A ket economic indicator. A positive surprise will boost the US
Dollar. Bullions will fall.
14-6-19 US Prelim UoM It is a leading indicator of consumer spending; a higher reading
Consumer Sentiment is considered positive for the economy as a rise in the consumer
confidence is directly correlated with the consumer spending
to a great extent. A robust figure will be negative for the bullion
counters.
18-6-19 Ger German ZEW Better-than-expected data will be positive for the euro. Of
Economic Sentiment late, European economic indicators have turned somewhat
promising.
19-6-19 US " A dovish Fed will be negative for the US Dollar, and gold will
FOMC Economic rally. The Fed is increasingly becoming concerned with the
Projections/ global trade wars affecting the US economy.
Statement "
20-6-19 US Philly Fed A key indicator of manufacturing health. Data topping the
Manufacturing Index forecast would be positive for the US Dollar and negative for
the bullions.
21-6-19 Eur Flash Manufacturing The manufacturing activity continues to be in contraction, thus
PMI number trailing the forecast will be bearish for the Euro.
25-6-19 US CB Consumer Higher consumer confidence bodes well for the US economy,
Confidence so the US Dollar will rise and bullions will fall.
26-6-19 US Durable Goods -1.80% 0.30% Better than expected number will be positive for the US Dollar
Orders m/m and the industrial commodities. Bullions will fall.
June 2019 10 Commodity ValueGuideCommodity FUNDAMENTALS Monthly View
Date Region Event Survey Actual Prior Impact
27-6-19 US Final GDP q/q The US economy is still doing well, though inventories
contributed the major part of the growth in the last data. A
negative surprise will increase the chances of a rate cut, which
will be positive for precious metals and negative for the US
Dollar.
28-6-19 US Core PCE Price Index A key gauge of inflation. Data better than forecast would be
m/m negative for the bullions and other commodities as well.
28-6-19 US Personal Spending A key indicator of the economy. Data trailing the forecast would
m/m be negative for the US Dollar and positive for the bullions.
28-6-19 US Core PCE Price Index Preferred gauge of the US Fed. A higher inflation reading will
m/m be negative for the bullion counters.
30-6-19 China Manufacturing PMI It's the broadest measure of economic activity and the primary
gauge of the economy's health. Beleaguered China's economy
might see improvements on tax cuts and other stimulus taken
of late. A positive surprise will boost the industrials.
June 2019 11 Commodity ValueGuideMonthly View Commodity FUNDAMENTALS
Agri Ministry forecasts 2018-19 food grain output at 283.37 million tonne
Key points-
Third Advance Estimates projects record rice, wheat output
for 2018-19
Price performance
South west monsoon advances further into Arabian Sea
Commodity Exchange Expiry 31-May 19 30-Apr 19 Change %
SEBI allows portfolio managers to participate in exchange
Barley NCDEX June 1814 1887 (3.87)
traded commodity derivatives
Castor NCDEX June 5702 5684 0.32
SEBI allows mutual funds to invest in exchange traded
Chana NCDEX June 4611 4374 5.42
commodity derivatives
Cotton MCX June 22010 22660 (2.87)
Government raises 2018-19 total spices output to 86.12 lakh
Cocud NCDEX June 2753.5 2513 9.57
tonne
CPO MCX June 519.3 535.2 (2.97)
IMD maintains its normal monsoon forecast at 96% of LPA
Dhaniya NCDEX June 7355 7281 1.02
China puts purchases of US soybean on hold as trade war Guargum NCDEX June 8504 8823 (3.62)
intensifies Guarseed NCDEX June 4265.5 4391.5 (2.87)
Castor oil exports take a hit due to US-China trade war Jeera NCDEX June 17410 17035 2.20
SEA urges government to allow bulk export of mustard oil Maize NCDEX June 1889 1849 2.16
Centre asks tariff commission to come up with actual cost of Mentha Oil MCX June 1291.6 1269.7 1.72
production of sugar for 2018-19 Ref Soy Oil NCDEX June 755.3 728.85 3.63
Government aims to curb unauthorized import of edible oils RM Seed NCDEX June 3949 3785 4.33
coming via Nepal Soybean NCDEX June 3698 3715 (0.46)
Government may raise pulses import quota for processors on Turmeric NCDEX June 6968 6520 6.87
lower supplies Wheat NCDEX June 1965 1923 2.18
Government aims to add 220 more mandis in eNAM in FY20 Source- NCDEX, Sharekhan Comtrade Research
Government mulls National Mission to boost vegetable oil
output
Government wheat stocks as on May 1 at 331.60 lakh tonne, Monthly performance (change in %)
down 6.2% y-o-y 12.00
Government likely to miss wheat procurement target as 10.00
9.57
slowing purchases in MP and UP 8.00 6.87
US boosts tariffs on $200 billion in goods from China to 25% 6.00 5.42
4.33
Farmers may switch to soybean from maize and cotton due to 4.00
3.63
2.20 2.18 2.16
uncertainty over monsoon 2.00
1.72
1.02
0.32
ICEX launches black pepper contract 0.00
Late wheat harvesting delays cotton sowing in north India (2.00)
(0.46)
India vegetable oil imports between November to April up 3% (4.00) (2.87)(2.87)(2.97)
(3.62)(3.87)
to 75.42 lakh tonne (6.00)
Castor
Maize
Soybean
Cotton
CPO
Guargum
Chana
Wheat
Barley
Turmeric
Dhaniya
Ref Soy Oil
Guarseed
Cocud
Mentha Oil
RM Seed
Jeera
Global sugar deficit likely to be 2.34 million tonnes in 2019-20
Sugar exports jump to 21 lakh tonne this year
Basmati paddy prices down in the absence of clarity on
payment to Iran export Source- NCDEX, Sharekhan Comtrade Research
Gujarat halves groundnut output in 2018-19 due to deficit
rains
World food prices rise 1.5% in April: FAO
Oilmeal exports fall 25% in April
Cotton Association of India cuts output estimate to 315 lakh
bales
FCI to sell 10 million tonne of wheat to bulk consumers in
current fiscal
India’s FY 19 basmati rice exports hit all-time high of 44.15
lakh tonne
June 2019 12 Commodity ValueGuideCommodity FUNDAMENTALS Monthly View
Cotton seed oilcake Turmeric prices gained on good demand from stockists.
Good demand in the domestic and overseas markets also
Cotton seed oilcake June futures were the biggest
supported prices. There was good demand for Indian
gainers in the agri commodity basket on NCDEX in April.
turmeric from the overseas markets in the spot. However,
Prices opened at Rs. 2,532/quintal and touched a low of
expectations of good output this year capped sharp gains.
Rs. 2,513.50/quintal in the beginning of the month. Prices
gained sharply during the month and touched a new We expect turmeric to trade mixed to positive this month.
all-time high of Rs. 2,807/quintal towards the end of the Good demand from the domestic and overseas markets
month. Prices closed 9.57% higher on a monthly basis at may continue to support prices. However, good arrivals
Rs 2,753.50/quintal compared to previous month’s close of of the new season crop may cap the upside and also
Rs. 2,513/quintal. pressurize prices at higher levels.
Cotton seed oil cake prices traded on a bullish note last Currently the May futures are trading around Rs. 6,968/
month. Prices gained sharply on account of robust demand quintal. Prices may find strong support around Rs 6,680-
amid tight supplies. Lower cotton output this year lead to 6,460/quintal while resistance may be seen around Rs
lower cotton seed availability for crushing, leading to lower 7,100-7,360/quintal.
cotton seed oilcake production. Demand also picked up
due to lower cattle feed availability and poor monsoon last Barley
year. However, declining global cotton prices capped sharp
Barley June futures were the biggest losers in the agri
gains.
commodity basket on NCDEX in May. Prices opened
We expect cotton seed oilcake to continue to trade higher. the month at Rs 1,900/quintal and touched a high of Rs.
Lower supplies and good demand from the feed industry 1,935/quintal in the first half of the month. Prices declined
may continue to support prices. Expectations of delay in the significantly during the month and touched a low of Rs.
onset of monsoon may also support prices. However, prices 1,810/quintal towards the end of the month. Prices closed
are at all time highs, and thus, traders may liquidate their 3.87% lower month-on-month at Rs 1,814/quintal compared
stocks to generate liquidity ahead of the commencement to previous month’s close of Rs 1,887/quintal.
of kharif sowing.
Barley prices were trading on a positive note over the past
Currently the June futures are trading around Rs. 2,753.50/ couple of months on account of good demand from the
quintal. Prices may find strong support around Rs 2,650- breweries ahead of the summer season. Prices topped out
2,480/quintal while resistance may be seen around Rs in the early part of May as demand peaked and thereafter
2,880-3,000/quintal. we witnessed a fall in the prices. easing demand at higher
levels, higher output expectations and higher supplies at
Turmeric higher prices put pressure on the prices.
Turmeric June futures were the second biggest gainers in We expect barley to trade mixed to negative. Declining
the agri commodity basket on NCDEX in May. Prices opened demand from the breweries may pressurize prices.
at Rs. 6,544/quintal and touched a low of Rs. 6,440/quintal Expectations of higher output may also keep prices under
in the beginning of the month. Prices gained significantly pressure. However, any revival in demand may support
during the month and touched a high of Rs. 7,360/quintal in prices at lower levels.
the second half of the month. Thereafter, prices corrected Currently the May futures are trading around Rs. 1,814/
from higher levels on profit booking. Prices closed 6.87% quintal. Prices may find strong support around Rs 1,740-
higher on a monthly basis at Rs 6,968/quintal compared to 1,675/quintal while resistance may be seen around Rs
the previous month’s close of Rs. 6,520/quintal. 1,885-1,935/quintal.
June 2019 13 Commodity ValueGuideTrend & View Commodity TECHNICALS
Gold: Positive bias
MCX Gold prices, which dropped from their high from Rs.
34,000 found support near Rs. 31,500 levels. Since the
past ten weeks, a sideways action has been seen which
can also be termed as a consolidation. This occurs usually
to digest the previous fall.
As far as prices persist at Rs. 31500-32500, no trending
move is expected. Any move above Rs. 32300 will open
positive possibilities as prices are moving in a higher highs
and higher lows formation. However, a failure to protect the
level of Rs. 31500 will infuse selling pressure.
The weekly relative strength indicator (RSI) is changing
direction from negative to positive and has also entered
the positive terrain above Rs. 50. Source- Telequote
View CMP Commodity Reversal Target
Up Rs. 32,100 Gold Rs. 31,500 Rs. 33,000
Nickel: Trending positive
MCX Nickel has given a bullish break in a falling channel
breakout, thus opening positive possibilities. Moreover, the
counter is also trading above its upward sloping trendline,
giving an indication that the trend is positive.
As far as prices are trading above Rs. 830 levels, the bias is
positive as it can move near till Rs. 930 levels. The weekly
RSI is positively poised as it is near the center line (50).
Source- Telequote
View CMP Commodity Reversal Target
up Rs. 869 Nickel Rs. 830 Rs. 930 - Rs. 950
Turmeric: Change in trend
The above chart shows the price movement of the NCDEX
turmeric weekly contract. Price were making a lower highs
and lower lows pattern. After a sideways consolidation
since the past few weeks, the agro commodity had given
a upward trend line breakout which indicates change in
trend from bearish to bullish.
In the current scenario, prices had broken the previous
week’s low and are hovering near trend line support at
Rs. 6,550 level. Any move above Rs. 7060 can open
possibilities for fresh a upside move till Rs. 7,850 level.
The RSI is above the center line indicates strength in the
counter.
View CMP Commodity Reversal Target
Up Rs. 6,950 Turmeric Rs. 6,400 Rs. 7,850
Source- Telequote
June 2019 14 Commodity ValueGuideCall : 3970 8090 (prefix local code) | DialnTrade: 1-800-22-7004 (Toll Free) | Email:support@skcomtrade.com
Log on: www.sharekhancommodity.com
Sharekhan Comtrade Pvt. Ltd. SEBI Regn. Nos.: MCX-55400 : INZ000041331 ; NCDEX-1227 : INZ000041331 ; For any complaints email at
igc@skcomtrade.com ; Registered Office: Lodha iThink Techno Campus, 10th Floor, Beta Building, Off JVLR, Opp. Kanjurmarg Railway
Station, Kanjurmarg (E), Mumbai - 400042. Maharashtra. Tel No.: 022 – 6115 0000; Fax No. : 022 – 6748 1899. Disclainer: Client should
read the Risk Disclosure Document issued by SEBI & relevant exchanges and Do’s & Don’ts by MCX & NCDEX and the T & C on
www.sharekhancommodity.com before investing.You can also read