Community Health Needs Assessment 2019-2021 - Signature ...
←
→
Page content transcription
If your browser does not render page correctly, please read the page content below
Community Health
Needs Assessment
2019-2021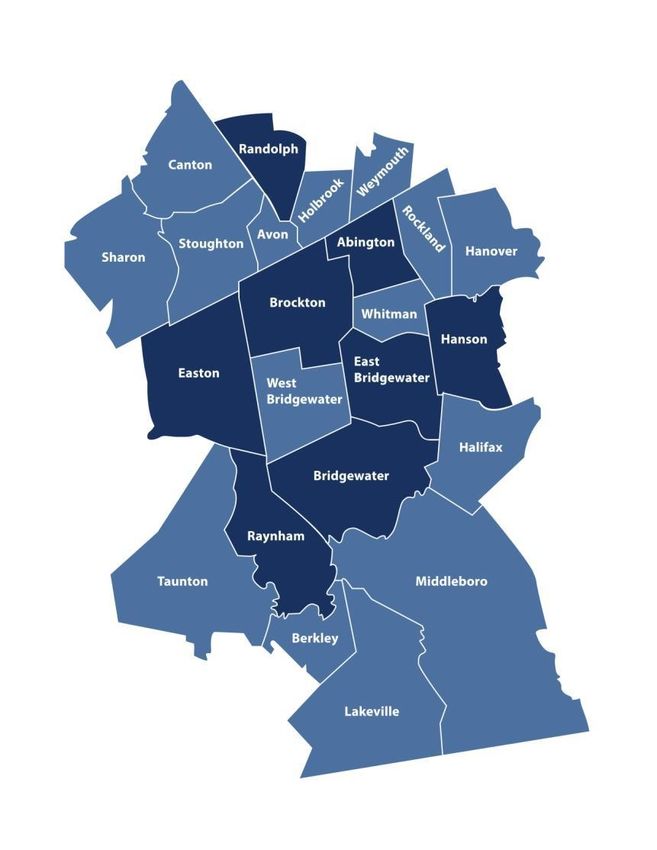
Signature Healthcare
2019 Community Health
Needs Assessment
Acknowledgements
This assessment has been made possible by community members and organizations in the Signature Healthcare
service area. We would like to thank those who shared their thoughts, valuable ideas, time, and expertise. Thank
you to the following organizations for their assistance:

    ●   Brockton Board of Health
    ●   Cape Verdean Adult Day Health Center
    ●   East Bridgewater Council on Aging
    ●   East Bridgewater Police Department
    ●   Haitian Community Partners
    ●   Holbrook Cares
    ●   Massachusetts Department of Public Health
    ●   Massasoit Community College
    ●   Town of Stoughton/OASIS
    ●   Town of Avon/Avon ACES

These organizations represent a wide array of community members that include significant diversity in areas such
as age, gender, race, ethnicity, socio-economic status, disability, etc. The input of these organizations is crucial to
addressing and eliminating health disparities.

We would also like to acknowledge the input of local community members from Brockton, Bridgewater, East
Bridgewater, West Bridgewater, Holbrook, and Stoughton. Insights provided by the community have been critical
in guiding the process and outcomes of this Community Health Needs Assessment.

2
Table of Contents
          Section                           Page

          Introduction                      4

          Methods                           8

          Executive Summary                 9

          Community Input                   10

          Demographics                      12

          Social Determinants of Health

          Built Environment                 14

          Social Environment                15

          Housing and Homelessness          16

          Violence                          18

          Education                         19

          Employment                        20

          Health Outcomes

          Behavioral Health                 21

          Maternal and Child Health         27

          Sexually Transmitted Infections   29

          Chronic Illnesses                 30

          Appendix                          33

3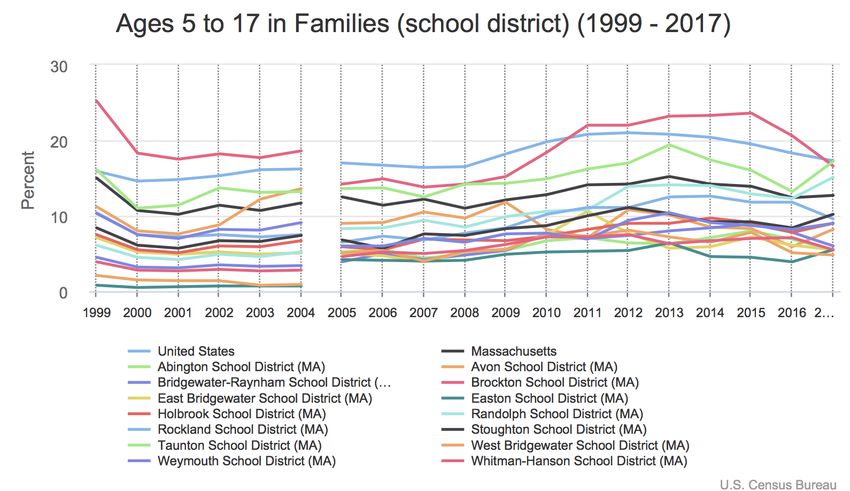
Introduction
Service Area

Map of Signature Healthcare’s service area

4
Organizational Priorities
Our 2016 Community Health Needs Assessment identified Nutrition, Diabetes and Substance Use
amongst all populations as major health concerns in the communities we serve. Signature Healthcare
focused its efforts to combat these concerns by offering tools and education to individuals in need. Our
target population was community wide and our priorities included educational tools, classes, screenings
and educational seminars.
Through community outreach with local businesses, community groups and events, hospital staff
members were able to educate the community on nutrition, diabetes and substance use disorder in a
variety of ways. Signature Healthcare provided educational tools on diabetes, healthy recipes, free
exercise classes and opportunities for questions and answers with clinical staff. Each year, hospital staff
participate in more than 25 community events that promote education on the topics of Diabetes,
Nutrition and Substance Use Disorder. As a result of these efforts we have been able to reach thousands
of individuals to assist them with their healthcare needs and educate them on the best path to personal
wellness.
Signature Healthcare has contributed to the health needs of the community by providing:
Free Screenings – 1200
Free Medical Educational and Awareness Events – 103
The graph below represents the total number of individuals reached from 2017-2019 to date.
16000
14000
12000
10000 2017
8000
2018
6000
4000 2019
2000
0
# of people reached
Nutrition & Diabetes
As part of the 2016 CHNA, we discovered individuals living in the community viewed exercising as
unsafe and expensive, had trouble affording healthy food, and faced challenges preparing meals
properly.
Based on these findings, Signature Healthcare continued its wellness program. Elements include free
exercise classes, free health screenings, healthy cooking demonstrations and free healthy recipes.
5
Signature Healthcare offers free Yoga and Zumba classes to the community and employees every
Tuesday and Wednesday evening from 5-6pm to combat cost and safety concerns cited as reasons for a
sedentary community. These classes, attended by 20-30 people weekly, are well received. The program
is in its 9th year and continues to thrive. Massasoit Community College hosts the classes, providing
additional space and affording the opportunity for college faculty, staff and students to attend.

Signature Healthcare continues to work with “Blessings in a Backpack”. Many of the children in
Brockton Public Schools are on the free and reduced breakfast and lunch program and Blessings
ensures these same students have healthy food for the weekends as well. Signature Healthcare works
with our food services provider to put together meals for 60 students at the Kennedy School. Each
weekend, these children are provided nutritious foods to take home such as soups, fresh fruit and healthy
grains. Signature Healthcare will be working with Blessings in a Backpack again for the 2019-2020
school year to assist in expanding this program to other children in our community.

On many occasions since 2016, Signature Healthcare staff members offered nutrition information and
hands on activities to the community. One major event is the “Health & Wellness Expo”. This event has
many components including: free screenings for vascular and metabolic disease, a healthy cooking
demonstration, healthy recipes, and an area where Signature Healthcare and community partners
highlight nutrition and diabetes services. There is also an exercise area with Kickboxing and Zumba for
adults and an obstacle course for children provided by the Easton Children’s Museum. This event is a
great success each year with more than 250 attendees and more than 100 of those being screened.

Signature Healthcare continues to be part of a larger, community-wide “Brockton Knocks Down
Diabetes” initiative; kicking off with the Health & Wellness Expo., providing clinicians where needed,
assisting with coordination and staffing for various events, and offering classes throughout the week.
BKDD is a weeklong initiative to provide education and awareness around diabetes. Numerous local
partners participate in this event including the Old Colony YMCA, Harbor One, Brockton VNA and the
American Diabetes Association. This group worked diligently on creating programming the community
would find beneficial. Activities planned include educational presentations as well as fitness classes.

We continue to support a local grassroots program, “Kids Road Races”. This 30 + year old program is
led by Brockton resident Dave Gorman and his wife with two 8-week sessions, one in the fall and one in
the spring. Children come each week and run a 2-mile road race at DW Field Park. This program
promotes childhood physical health and provides them with a sense of accomplishment and pride.

Substance Use Disorder

Data in our past few Community Health Needs Assessments shows an increase in Substance Use
Disorders. From 2012-2015, overdose deaths continued to increase. In 2012, the State reported 668
deaths. In 2015, the reported deaths jumped to 1,379. As part of our 2016 Community Health Needs
Assessment, one key informant stated “The opioid epidemic is frightening. There was always a stigma
around drug addicts and now it’s everywhere. It does not matter your social or economic status, it hits
everybody. We need to identify those issues and needs while we have students with us to hopefully
prevent things happening when they leave the district.”

6

Signature Healthcare works with staff from High Point, the Brockton Area Prevention Collaborative and
the Plymouth County Drug Abuse Task Force. The Plymouth County Drug Abuse Task Force published
a paper in 2017 titled “Would you Prescribe Your Patient Heroin?--Plymouth County’s Response to the
Opioid Crisis.” Dan Muse, MD and Lisa Harrington, RN from Signature Healthcare’s Emergency
Department both authored sections of this paper. Dr. Muse provided the introduction and focused on
prescribing practices and recommendations. Lisa focused her efforts on reasons for collecting data, level
of data reporting and components of data to be collected.

Signature Healthcare hosted “Lunch and Learns” to share information on this research with our
employees. Attendees received a background on the opioid epidemic, recommendations on how
healthcare professionals can do their part in reversing the crisis, and community-based resources to
address substance use prevention. Dan Muse, Emergency Department Physician from Signature
Healthcare and Hillary Dubios, High Point Treatment Center, presented and answered questions. These
presentations were held at both Signature Healthcare Brockton Hospital and our Signature Medical
Group location at 110 Liberty St. in Brockton.

In June 2018, Signature Healthcare hosted “Hidden in Plain Sight”, a hands-on presentation designed to
prepare parents on the signs and hidden sights of substance use. This was an interactive event centered
on a teenager’s mock bedroom, allowing attendees the opportunity to explore and see if they could
identify drug paraphernalia and hiding places along with other signs indicating drug or alcohol abuse by
a teen. As part of the program, a prevention specialist from Brockton Area Opioid Prevention
Collaborative attended to guide attendees through the bedroom and explain various substance use trends,
signs and symptoms in an effort to bring awareness and local resource options.

Signature Healthcare Emergency Department physicians work with local police and fire departments to
provide training and medical guidance. Police Departments from Norfolk, Plymouth and Bristol
Counties were trained on the proper use of Nasal Narcan. The ED physicians also work on projects with
the Norfolk, Plymouth and Middlesex County District Attorney’s offices to provide lectures to students,
parents, teachers, and other healthcare professionals on concussions, sports injuries and substance use.
Dr. Muse serves as the EMS Medical Director for 14 local fire departments and is very active in other
matters related to substance use, including the Brockton Mayor’s Opioid Coalition, Independence
academy and Plymouth County’s Substance Use Coalition.

Within the Signature Healthcare Emergency Department, overdose patients received Nasal Narcan, a list
of detox facilities, and counseling. The ED physicians are also limiting the number of narcotics they
prescribe to patients. They will not fill lost prescriptions and are advancing the use of the state’s
Prescription Monitoring Program.

Signature Healthcare created a Pain and Opioid Management Committee who developed a charter to
guide our purpose and ensure we are meeting the regulatory requirements of the Joint Commission as
they relate to pain and opioid management. We started by ensuring appropriate pain and opioid
management policies were developed to meet the needs of our patient population. At the same time, we
monitored the effectiveness of patient pain assessment and pain management throughout the
organization. Part of our effort includes raising awareness of available resources for consultation and
referral for patients with complex pain management needs among both staff and our licensed

7

independent practitioners. The committee works to ensure educational resources and programs are
available to improve pain assessment, pain management, and safe use of opioid medications throughout
the organization in an ongoing basis.

Methods
To conduct their 2019 Community Health Needs Assessment, Signature Healthcare worked with the
Stoughton Youth Commission. This year, Stoughton Youth Commission hired an evaluator to conduct
the assessment with the goals of identifying (1) unmet health needs, (2) vulnerable populations, and (3)
gaps in existing community health services. This needs assessment used a multi-pronged approach
which included analyzing existing data as well as holding focus groups and key informant interviews.
The following process was followed in gathering primary and secondary data.

    ● Quantitative data gathering (September 2018 – January 2019)
      The process began with quantitative data gathering around demographics, social determinants of
                     health, other health risk and protective factors, and health outcomes. The primary
                     data sources used for this were Massachusetts Department of Public Health,
                     Massachusetts Department of Education, American Communities Survey, and the
                     United States Census. This data was used to guide the qualitative data collection
                     process by identifying critical voices who needed representation within the
                     community health needs assessment.
    ● Qualitative data collection (February 2019 – June 2019)
      Qualitative data was collected through a series of key informant interviews and focus groups. To
             ensure the community voice was at the heart of this needs assessment, community
             members and key informants were asked to make suggestions for what other voices they
             would like represented in addition to their own. This led to a secondary set of qualitative
             data collection.
    ● Report generation and presentations (July 2019 – September 2019)
      The report was generated collaboratively by the Stoughton Youth commission and Signature
             Healthcare and presented to relevant stakeholders.

8
Executive Summary
The 2019 Signature Healthcare Community Health Needs Assessment solicited the input of the
community, with a particular focus on those facing inequities, to provide actionable context and
relevance to the quantitative data that was analyzed. The prioritization of health needs was completed
with the following procedures.
     (1) Community-identified health needs were ranked by frequency of mention.
     (2) When available, data concerning racial and ethnic inequities was considered.
     (3) Data points that were farthest from state and national benchmarks were prioritized.
It should be noted that the intersectionality of these health concerns is significant. Each area will be
discussed in detail, along with their intersectionality, later in the report.

Mental Illness

Mental illness was identified in each focus group and in each key informant interview. It was the second
most common health concern listed on the written surveys, behind obesity and chronic conditions. In
the City of Brockton, 16.6% of residents experience frequent mental distress (as defined by 15 or more
poor mental health days in the past 30). While data is not available by race/ethnicity, the most diverse
census tracts have the highest rates, some reaching as high as 23% of the adult population. Key
informants noted both the cultural stigma as well as an insufficient quantity of healthcare resources as
contributing factors to the increase in mental illness.

Obesity-Related Illness

Obesity and chronic disease resulting from obesity were the number one noted item in written surveys of
focus group participants. Participants reported social isolation, built environment, and transportation as
contributing factors to these health concerns. According to the US Centers for Disease Control and
Prevention, chronic diseases affect minority groups more severely due to a number of contributing
factors such as the social determinants of health. Due to the significant inequities in these determinants
from a young age, such as high school graduation, poverty, and teen births, it can be assumed these
contribute to the rates of chronic illnesses such as diabetes and heart disease later in life. This data,
coupled with only 26% of adults in Brockton completing preventive services, suggests that obesity-
related illness will be a top priority for many years to come.

Substance Use

The third-most identified concern reported by community informants was substance use. The rapidly
evolving landscape of substance use makes it challenging to stay on top of. With the increase use of
electronic vapor products in young people, adult substance use and associated conditions should be
closely monitored. Changes in marijuana laws and increasing availability is also likely to change the
landscape of substance use in Massachusetts. Additionally, the widely available data on opioid use,
overdose, and mortality can be used to create community-wide impact.

9
Community Input
Focus groups and key informant interviews were conducted in partnerships with local community
leaders. The focus groups were determined by first examining quantitative demographic data to
determine the largest demographic groups in Signature Healthcare’s service area, along with groups that
are growing most rapidly.

Focus groups were conducted in Brockton, West Bridgewater, East Bridgewater, and Holbrook. Over 85
residents participated in the focus groups and ranged in age from 18 – 92. Representatives identified
their race/ethnicity and demographics represented were largely reflective of the communities in
Signature Healthcare’s service area. The five focus groups had a mean size of 17. Identified
race/ethnicities of participants included White, African American, Haitian, Cape Verdean, Portuguese,
and Indian. Participants primary language included English, Haitian Creole, Portuguese, Cape Verdean
Creole, French, and Spanish.

          Top Health Concerns Among Focus Group Participants
                        Environmental   Other    Aging
                          Concerns       5%       6%
                             5%

                                                                Mental Health
                                                                   22%
             Substance Use
                 22%

                                                               Cancer
                                                                10%

                Obesity/Diabetes/H
                   eart Disease
                       30%

Focus group participants were asked to identify additional stakeholders who should provide input. This
led to interviews with police, hospital staff, a councilwoman, culturally focused non-profits, and a local
substance use prevention expert. Their input is included in the following tables.

The groups had very different perceptions of the top health concerns, referenced in the two charts below.
Each chart details either health concerns or risk factors, and includes which focus groups were most
concerned about each topic.

10
Risk Factor Primary Concerned Groups
Environmental Concerns (Pollutants) Holbrook residents, Senior participants
Bullying Parents, suburban/rural communities
Built Environment (Sidewalks, Snow
Young participants, Urban participants
Removal, Dangerous Intersections)
Senior participants, Suburban/Rural
Social Isolation
participants
Access to Healthcare Foreign-Born populations, Senior participants
Socio-Economic Concerns All
Health Concern Primary Concerned Groups
Substance Use (Opioids, Electronic Vapor
Parents, suburban/rural communities, seniors
Products, Alcohol, Marijuana)
Mental Illness (Anxiety, Depression) Parents, suburban/rural communities
Cancer Holbrook Residents, Senior Participants
Populations with special needs (Autism
Parents
Spectrum Disorder)
Obesity Urban participants
11Demographics
Race/Ethnicity
Race and ethnicity demographics have remained fairly stable in the Signature Healthcare Service area
over the course of the past three years. Three municipalities experienced significant demographic shifts.
● Avon saw an increase in minority racial and ethnic groups from 16% to 25.8% since 2016. This
shift can be attributed to a 76% increase in the Asian population and a 91% increase in the
population who identify as two or more races. The population of Avon has remained level
throughout this time.
● Weymouth increased minority racial and ethnic groups from 6% to 14% since 2016. The largest
increases were in the African American/Black population, Asian population, and Hispanic
population.
● East Bridgewater’s minority population increased from 5.7% to 9.3% since 2016. This shift is
most significantly seen in the African-American/Black population and Asian population, both of
which have more than doubled.
In addition to race and ethnicity, there are three communities that have a foreign-born population higher
than the state rate of 16.16%. These municipalities are Randolph (31.6%), Brockton (27.9%), and
Stoughton (19.7%)
Disability
Disabilities affect health both directly and indirectly through social determinants of health. The
Massachusetts Department of Public Health defines social determinants of health as the “social,
economic, behavioral, and physical factors that we experience where we work, live, and play.”
Disabilities can, but do not necessarily, alter transportation needs, employment opportunities, social
networks, and economic earning potential. The disability rate among those 16 years old and over in
Massachusetts is 6.7%. The municipalities that exceed this rate are West Bridgewater (10.8%), Brockton
(9.9%), Randolph (9.8%), Rockland (9.5%), Avon (9.1%), Stoughton (7.8%), Abington (7.7%), and
Holbrook (7.5%).
12Disabilty Rates by Town
9.9% 10.8%
9.1% 9.8% 9.5%
7.7% 7.5% 7.8% 7.6% 6.7%
6.1% 6.6%
3.8% 4.1% 4.7%
Source: American Communities Survey
Veteran Population
In Massachusetts, 6.7% of the adult population are veterans, 6.9% of which are women. The
Massachusetts veteran population is much older that the overall United States population. In
Massachusetts 57.4% of the veteran population is 65 and older. That rate is only 47% in the United
States as a whole. The largest population of Massachusetts veterans served in the Vietnam Era.
The United States Department of Veterans Affairs identifies major health conditions confronting
veterans to include musculoskeletal injuries and pain, mental health issues, traumatic brain injury, and
noise and vibration exposure. Many of these conditions are very specific to those with military
experiences. It is critical to monitor the veteran population to ensure they are able to access quality care
tailored to their specific health needs. Below is a chart of the veteran population by municipality.
Veteran Population
7.8%
6.7% 6.4% 6.9% 6.7%
6.1% 6.0% 6.3%
5.4% 5.9% 5.3% 5.5%
4.8%
3.9% 4.3% 4.3% 4.3%
Source: American Communities Survey
13Built Environment
The built environment, according to the United State Centers for Disease Control and Prevention,
“includes all of the physical parts of where we live and work (e.g., homes, buildings, streets, open
spaces, and infrastructure).” The built environment varies drastically throughout Signature Healthcare’s
service area, which includes urban, suburban, and rural landscapes. As such, the needs of the community
differ significantly. In the rural communities, senior populations were particularly concerned about
unsafe driving and walking conditions.
“You have to use ‘Dial-a-Bat’ which
is challenging if you are senior and
the wait is prohibitive”
Focus Group Participant
Driving and walking conditions were also of large concern in urban focus groups, with participants
indicating that poor snow removal leads to unsafe walking conditions and more sedentary lifestyles.
Nine municipalities in Signature Healthcare’s service area contain environmental justice populations.
The US Environmental Protection Agency defines an environmental justice community as, “Minority,
low-income, tribal, or indigenous populations or geographic locations in the United States that
potentially experience disproportionate environmental harms and risks.” To qualify as an environmental
justice community, census block groups must have one of the following: (1) an annual median
household income equal or less than 65% of the statewide median; (2) 25% or more of the residents
identify as a race other than white; or (3) 25% or more of households have no one over the age of 14
who speak English only or very well. In Randolph, 100% of residents live in an environmental justice
community, followed by Brockton (96.8%), Stoughton (24.7%), Taunton (23.6%), Holbrook (15.2%),
Rockland (11.3%), Easton (7.3%), Weymouth (7.2%), Whitman (4.9%).
Additional data from City Health Dashboard shows that Brockton scores better than the average for the
500 largest cities nationwide on one of the main measures of pollution with an average particulate matter
(PM) 2.5 concentration of 6.9 compared to 9.2. PM 2.5 are fine inhalable particles emitted from
construction sites, unpaved roads, fields, smokestacks or fires. According to the EPA, PM 2.5 can enter
deep into the lungs and possibly even the bloodstream, posing a significant health risk.
In Brockton, 35.7% of Brockton’s houses have an elevated potential lead risk compared to 18.5% in the
average of the 500 largest cities. This leads to an average poverty-adjusted risk of housing-based lead
exposure score of 9 out of 10 (versus an average of 5.5). Using the same database, Brockton was similar
to the average of the 500 largest cities on walkability, park access, and access to healthy foods.
14Social Environment
Focus groups and key informants identified a number of concerns regarding the social environment of
their communities. Issues that came up frequently included both the duplication of services, and entities
that work in silos. While parents often had praises about the experience their children had with specific
school staff or programs, school systems as a whole seemed to generate frustration:
“It feels like the community and the
parents are unwelcome at school.”
-Focus Group Participant
Significant praise was delivered in regard to the collaboration and coordination that has occurred as a
result of the opioid epidemic, but focus group participants still expressed more was desired around other
health concerns such as pollutants, cancers, and mental health.
“I feel like overall; our town is reacting
and never active proactively.”
-Focus Group Participant
Additionally, focus group participants identified inequities due to race, ethnicity, gender, and income
contributing to a challenging social environment.
According to Washington University, racially segregated neighborhoods lead to higher exposure to
pollution, violent crime, more poverty, and higher rates of death from chronic diseases such as cancer
and heart disease. While Brockton at large is significantly diverse, with a diversity score of 80.7 out of
100, compared to the 500 largest cities at 64.1, some census tracts have a much lower rate of racial and
ethnic diversity. One example in Brockton would be the southwest corner census tract with a diversity
score of 58.2.
Across the 500 largest cities in the United states, the average income inequality score is -5.5 Being close
to zero would indicate little to no income inequality. Brockton, on average, has a score of -13.2, with the
center census tract at a score of -66.2. This exemplifies the massive inequities that face the city of
Brockton.
15Housing and Homelessness
According to George Washington University, renters are more likely to have health hazards in their
home such as uncomfortable temperatures, mold, cockroaches, inadequate septic systems, and water
leakage. In Massachusetts, 37.6% of households are occupied by renters.
Percent of Households Occuppied by Renters
46%
36% 38%
32% 34%
32%
29% 29%
26%
24%
18% 19%
16%
13%
8%
Source: American Communities Survey
The South Shore Health Compass states, “Spending a high percentage of household income on rent can
create financial hardship, especially for lower-income renters. With a limited income, paying a high rent
may not leave enough money for other expenses, such as food, transportation and medical. Moreover,
high rent reduces the proportion of income a household can allocate to savings each month.”
“The homeless population often comes to the
emergency department with social needs
beyond what the hospital is able to provide.”
-Key Informant
16In Signature Healthcare’s service area, ten of the thirteen communities have the majority of residents
that are housing burdened. These municipalities are Holbrook (73.4%), Avon (59.5%), Hanson (58.9%),
Stoughton (56.5%), Brockton (55.1%), Randolph (54.7%), Taunton (54.5%), Weymouth (50.9%),
Bridgewater (50.6%), and Whitman (50.1%).
Percent of Households Spending 30% or More on Rent/Utilities
73%
60% 59%
55% 55% 57% 55%
51% 51% 50%
47% 47% 47%
39% 37%
Source: American Communities Survey
Additionally, key informants from both the Brockton Health Department and Signature Healthcare
identified needs for those transitioning between inpatient treatment for behavioral health and
independent living.
“These people have nowhere to go and
we need to give them somewhere.”
-Key Informant
17Violence
According to the Massachusetts Department of Public Health, Brockton ranks number one in the state of
Massachusetts for nonfatal assault-related firearm injuries with an average rate of 194.2 per 100,000. On
this same metric, Randolph ranks fifth in the state with a rate of 108.8 per 100,000. From 2012-2016,
Brockton had 21 firearm homicides, putting it 5th in the state.
Total Firearm Injuries 2004-2014
Taunton, 68
Stoughton, 13
Randolph, 80
Brockton, 528
Source: Massachusetts Department of Public Health
While 2017 data indicates that Brockton has a higher rate of violent crime (967.2 per 100,000) than the
average of the 500 largest cities (513.5 per 100,00), this rate has decreased from 1085.3 per 100,000 in
2016.
18Education
According to the United States Centers for Disease Control and Prevention, higher levels of education
decreases the likelihood of obesity and risky behaviors such as smoking, and increases the likelihood of
preventive behaviors such as meeting physical activity recommendations or having mammograms or
colorectal screenings, and overall increases life expectancy.
The population aged 25+ without a high school degree or equivalent in the state is 9.5%. Avon (13.3%),
Brockton (18.7%), Randolph (14.4%), Taunton (16%) are above this rate. In addition, Hanson,
Holbrook, Rockland, Taunton, and West Bridgewater fall below the state rate of having more than a
high school diploma.
2017 Graduation Rates by Town
95% 92% 92% 96% 98% 92% 97%
89% 89% 86%
78% 81% 77%
Source: Massachusetts Department of Education
It is important to note significant racial and ethnic disparities exist in educational attainment both locally
and nationally. In Brockton, the graduation rates for 2017 are:
Racial/Ethnic Graduation
Group Rate
Asian 91.7%
Black 77.3%
Hispanic 74.3%
White 83.2%
Total 77.8%
Students with limited English proficiency are much less likely to graduate. In Brockton, for example,
students with limited English proficiency only have a 61.8% chance of graduating high school.
19Employment Poverty When looking at the entire service area of Signature Healthcare, the percentage of the population at both 100% of the Federal Poverty Level and at 200% of the Federal Poverty Level are identical with the percentage for the state of Massachusetts. The distribution of this poverty is not equal between municipalities in the service area. Avon (8.5%), Bridgewater (9.5%), Brockton (16.8%), Randolph (11.3%), Stoughton (8.3%), and Taunton (13.8%) all have a higher percent of their total population living below the state and service area average of 6.9%. Additionally, Brockton (35.8%), Rockland (44.3%), and Taunton (30.0%) have higher than the state and service area rate (23%) of the population living under 200% of the Federal Poverty Level. When examining poverty in children, school district data shows that while a decline was seen across the area in the 1990s, the poverty rates became much more unstable after the financial crisis in 2008. In 2017, Brockton fell below the state rates for children in poverty for the first time since 2011. All other municipalities in the service area have not exceeded the state rate at any point after 2000. While typically near or below the state rate for children in poverty, Randolph jumped above in 2017. Both Taunton and Brockton historically had rates above the state rate. 20
Behavioral Health
 High School Age Substance Use

 According to the US Centers for Disease Control and Prevention, “the earlier teens start using
 substances, the greater their chances of continuing to use substances and developing substance use
 problems later in life.” They also note that substance use in teens “contributes to the development of
 adult health problems such as heart disease, high blood pressure, and sleep disorders.”

 In focus groups, parents identified progress made in prevention of youth substance use, including a
 positive sense of community, education made available for parents, and safe recreational activities
 provided for youth. Parents did identify electronic vapor products as an emerging concern:

                                “One concern I have is
                                that we have no
                                understanding of the
                                long-term health data.”
                                       -Focus Group Participant

 Several local municipalities have published data on youth risk and protective factors, which provide
 critical insights for preventing substance use disorders. Key findings include:

 Marijuana Use

Municipality                      Lifetime Use Rate                  30 Day Use Rate
Massachusetts                     37.9%                              24.1%
Avon                              25.7%                              12.2%
Easton                            34.9%                              21.0%
Stoughton                         32.9%                              18.6%

 21
Cigarette Use Municipality Lifetime Use Rate 30 Day Use Rate Massachusetts 19.6% 6.4% Avon 9.1% 5.0% Easton 10.5% 4.1% Stoughton 5.9% 1.4% Alcohol Consumption Municipality Lifetime Use Rate 30 Day Use Rate Massachusetts 56.2% 31.4% Avon 45.4% 13.7% Easton 49.1% 17.7% Stoughton 47.3% 20.4% Electronic Vapor Product Use Municipality Lifetime Use Rate 30 Day Use Rate Massachusetts 41.1% 20.1% Easton 44.1% 32.3% Stoughton 42.5% 23.4% Prescription Drugs Use Municipality Lifetime Use Rate 30 Day Use Rate Massachusetts 10.6% 4.1% Avon 5.8% 4.9% Easton 2.9% 1.4% Stoughton 3.8% 0.5% 22
Adult Substance Use

The rate of age-adjusted emergency department visits for substance use varies significantly by
municipality. There appears to be no correlation between size or demographics of local municipalities
and their burden of substance use.

              Substance Abuse Treatment by Town (Top 5 Municipalities)
 40
 35
 30
 25
 20
 15
 10
  5
  0
             2013                  2014              2015                   2016                  2017

                       Brockton        Rockland     Stoughton          Taunton        Weymouth

            Substance Abuse Treatment by Town (Bottom 10 Municipalities)
 40
 35
 30
 25
 20
 15
 10
  5
  0
             2013                  2014              2015                   2016                  2017

                    Abington              Avon              Bridgewater            East Bridgewater
                    Easton                Hanson            Holbrook               Randolph
                    West Bridgewater      Whitman

Source: Massachusetts Department of Public Health

23
For the first time in the past five years, heroin has not increased in likelihood of being the primary drug
during admission for substance abuse treatment. Heroin peaked in 2016 with 53.6% of all admissions
identifying it as their primary drug. At admission, 50.7% of patients identify heroin as the primary drug,
34% alcohol, 6.1% other opioids (including methadone, opiates, oxycodone, etc.), 3.9% crack/cocaine,
and 3.1% marijuana. The rest of patients identified other (including other sedatives/hypnotics or
stimulants) as their primary drug.
Substance Use ED Visits Age-Adjusted per 100,000
(2012-2015)
261 281
249 231 229 223 226
183 176
154
123 120
92 81
Source: Massachusetts Department of Public Health
At Brockton Hospital’s Emergency Department, data on opioid overdoses can be used to gather insights
about how the epidemic is manifesting.
The 2018 data reveals that 95% of overdose patients arrive via EMS, with the remaining 5% arriving via
car. Most patients are treated with Narcan before arriving at the hospital, 94% of which receive it
nasally. Narcan is most frequently delivered by EMS (61%), followed by a bystander (21%), Police
(12%), and the hospital (7%).
There is a disparity between the municipalities in which these patients reside and the municipalities in
which they overdose. While 71% of residents overdosed on their own municipality, 29% overdosed in a
different municipality. Brockton disproportionately sees overdoses from other municipalities, including
some that are quite distant such as Seekonk, Fall River, and Lowell.
The chart below identifies the percent of the total overdoses treated by Signature Healthcare in 2018.
The second column indicates the breakdown of which towns the overdose occurred in. The third column
indicates the breakdown of people who live in each community of their service. It is important to note
that not all those that overdose in Signature Healthcare’s service area will present at the Brockton
Hospital emergency department. Individuals may present at another emergency department or not seek
medical care at all.
24City/Town of City/Town of
City/Town Overdose Residence
Abington 4% 2%
Avon 0% 0%
Bridgewater 8% 7%
Brockton 66% 53%
East Bridgewater 6% 4%
Easton 0% 0%
Hanson 2% 3%
Holbrook 3% 3%
Randolph 1% 2%
Rockland 3% 3%
Stoughton 0% 1%
Taunton 0% 1%
Weymouth 0% 2%
Whitman 6% 6%
West Bridgewater 1% 1%
Other 1% 12%
Source: Signature Healthcare
Signatu
Mental Health
Anxiety and depression were identified in all focus groups and several key informant interviews,
particularly when discussing youth.
“Mental health is a really big concern,
especially for young children. Kids are
struggling with social skills not being
taught in schools and they are
frequently exposed to secondary trauma
via news and social media.”
-Focus Group Participant
Alternatively, seniors identified social isolation as a major concern for their community. This was
particularly prominent in focus groups and key informant interviews with immigrant populations. One
25focus group participant highlighted that living here, she has everything she needs to safely live alone
even as an older adult, but that also can be isolating.
“When you stay at home alone, you
relive the trauma you experienced back in
Cape Verde and you start to feel
abandoned.”
-Focus Group Participant
According to the Massachusetts Department of Public Health, Abington, Brockton, Holbrook, Randolph,
Rockland, Stoughton, and Taunton all rank in the worst quintile for poor mental health. This is defined
by the percent of residents that indicate they had 15 or more poor mental health days in the past month.
Hanson, Weymouth, and Whitman were in the fourth quintile. Easton was the only municipality in the
top quintile.
The data around poor mental health is indicative of mental health hospitalizations in Massachusetts with
similar municipalities experiencing the highest rates of hospitalizations.
Mental Health Hospitalizations in MA (Rate per 100,000)
(FY 2010)
1225
829 836 880 780 870
687 643 657 722
590 565
454
Source: Massachusetts Department of Public Health
26Maternal and Child Health
Total Births by Town (2016)
Abington, 213 Avon, 56
Weymouth, 688 Bridgewater, 224
Whitman, 159
West Bridgewater, 76
Brockton, 1,446
Taunton, 664
Stoughton, 317 East Bridgewater, 129
Rockland, 191 Easton, 174
Randolph, 397 Holbrook, 123 Hanson, 87
Source: Massachusetts Department of Public Health
Births by Local Hospital
Percent
Percent with
Early
Hospital City/Town Low Adequate
Term
Birthweight Prenatal
Care
Brockton Hospital Brockton 5.3% 81.5% 22.3%
Good Samaritan
Brockton 5.8% 64% 23.4%
Medical Center
Morton Hospital Taunton 4.3% 64.6% 25.9%
27South Shore Hospital Weymouth 5.8% 90% 22.5% Statewide 7.5% 82.1% 22.8% Low Birthweight/Preterm Births Low birthweight babies are born weighing less than 5 pounds 8 ounces. Low birthweight babies are prone to acute issues such as respiratory distress, bleeding in the brain, jaundice, and other illnesses. Later in life, babies born at a low birth weight are more likely to have diabetes, high blood pressure, obesity, metabolic syndrome, and intellectual and developmental disabilities. The Massachusetts rate of low birth weight is 7%. Seven municipalities in Signature Healthcare’s service area exceed this rate. Holbrook (15%), Brockton (11%), Randolph (10%), West Bridgewater (9%), Whitman (9%), and Stoughton (8%), all have higher rates than the state average. For preterm births, West Bridgewater (16%), Hanson (13%), Holbrook (13%), Randolph (12%), Avon (11%), Brockton (11%), and Stoughton (10%) all exceed the state rate of 9%. Teen Births In 2016, the state experienced 1,931 teen births. Brockton experienced 82 and Taunton experienced 23. In Brockton, 52% of teen births were to Black Non-Hispanic mothers, 28% to Hispanic mothers, and 17% to white mothers. Over the past 10 years, teen births in Brockton and Taunton, as well as at the state level have reduced by 50%. The average percent of births that are low birth weight is 7.5%, but teen births statewide have a rate of 9.7%. Brockton rate of low birth weight babies born to teen mothers is 12.3%. In Taunton, 21.7% of teen births are preterm and in Brockton, 7.3% are preterm, with a state rate of 9.4%. 28
Sexually Transmitted Infections
HIV/AIDS

Rates of people living with HIV infection has been steadily increasing in Massachusetts by about 3%
each year. This is due to both improvements in antiretroviral treatments that have increased health and
longevity in those with the disease as well as ongoing transmission, mainly in vulnerable populations
including men who have sex with men, black and Hispanic/Latino individuals, and those who inject
drugs. Brockton had the second highest average annual rate of HIV infection incidence in Massachusetts
during 2014 to 2016 according to the Massachusetts Department of Public Health.

Other Sexually Transmitted Infections

Brockton has seen an increase in several types of sexually transmitted infections in addition to HIV.
   ● Syphilis rates increased by 333% from 2013 to 2016.
   ● Chlamydia cases increased from 755 per 100,000 people to 922 from 2013 to 2016, which is the
       third highest in the state.
   ● Gonorrhea rates are second highest in the state and three times the state average, increasing from
       141 per 100,000 people to 236 from 2015 to 2016.

29
Chronic Illnesses In Brockton, data from the 500 Cities Project provides insight around health access, health behaviors, and health outcomes. Health care access, while far better than national averages, is still concerning in Brockton. Minority populations including Black (4.6%), Hispanic (5.5%), and other (5.2%) have higher rates of being uninsured than white (3.3%) and Asian (3.1%). Even with higher insurance rates, Brockton ranks far lower than national averages on residents completing core preventive services, such as vaccinations and cancer screenings. Only 26% of Brockton residents have all preventive screenings completed, with that number in one census tract being 16.6%. As of 2016, 32% of adults in Brockton are obese. This decreased from 36% in 2014. The highest census tract currently has an obesity rate of 41%. Cancer In the latest data produced by the Massachusetts Department of Health (January 2019), cancer incidence (for all types) decreased (3.1% for males and 0.7% for females), which is statistically significant. Specific cancers for males including bronchus & lung, esophageal, Hodgkin’s lymphoma, melanoma, and testicular cancer all decreased in incidences as well. Statistically significant increases were seen in males in kidney & renal pelvis cancer and Non-Hodgkin’s lymphoma. Mortality rates for males with kidney & renal pelvis cancer increased by 6.7%. Black non-Hispanic males had significantly higher rates of multiple myeloma and prostate cancer when compared to all other race/ethnic groups. Additionally, Black non-Hispanic, Asian non-Hispanic, and Hispanic males had significantly higher rates of liver/intrahepatic bile duct cancer. White non-Hispanic males had significantly higher rates of brain, nervous system, esophagus, leukemia, oral cavity, pharynx, and urinary bladder cancers compared to all other race/ethnic groups. Black non-Hispanic males had the highest total cancer mortality rate. For females, the incidence of multiple myeloma and urinary bladder cancer decreased, while pancreatic cancer increased. Breast cancer remains the most commonly diagnosed cancer for each racial/ethnic group. Black non-Hispanic females had significantly higher rates of multiple myeloma. Additionally, Black non-Hispanic and Hispanic females had significantly higher rates of cervical cancer. 30
Below is a table that indicates statistically significant increases for males (blue) and females (green) for
each type of cancer.

                                                    Bridgewater

                                                                             Bridgewater

                                                                                                                                                                    Bridgewater
                                                                                                                                                                                  Weymouth
                                                                                                                                              Stoughton
                                                                                                                        Randolph

                                                                                                                                   Rockland
                                  Abington

                                                                                                             Holbrook
                                                                  Brockton

                                                                                                                                                                                             Whitman
                                                                                                                                                          Taunton
                                                                                                    Hanson
                                                                                           Easton
                                             Avon

                                                                                                                                                                        West
                                                                                 East
Bladder, Urinary
Brain and Other Nervous
System
Breast
Cervix Uteri
Colon/Rectum
Esophagus
Hodgkin Lymphoma
Kidney & Renal Pelvis
Larynx
Leukemia
Liver and Intrahepatic Bile
Ducts
Lung and Bronchus
Melanoma of Skin
Multiple Myeloma
Non-Hodgkin Lymphoma
Oral Cavity & Pharynx
Ovary
Pancreas
Prostate
Stomach
Testis
Thyroid
Uteri Corpus and Uterus, NOS
All Sites/Types
Source: Massachusetts Department of Public Health

31
Diabetes The crude prevalence of diabetes has been increasing in Massachusetts by an average of 3% per year, with pre-diabetes increasing an average of 4% per year. In 2017, 9.5% of adults reported being diagnosed with diabetes. In Brockton specifically, that rate was 12.6% in the last available data from 2016. This is not homogeneous throughout the city, however. The more suburban north and west sides see rates around 10%, while the tract in the center of the City sees a rate of 20.2%. These tracts also see a difference in life expectancy by about ten years according to the Robert Wood Johnson Foundation. Heart Disease In the City of Brockton, 36% of adults report having high blood pressure, compared to 29.4% in the average of the 500 largest cities. In one census tract, this number is 47%. A bright spot, Brockton has lower than average rates of death due to cardiovascular disease than these 500 cities (193.7 per 100,000 versus 209.4). Additional demographic data for this metric indicates that while the rates are slightly less for the Hispanic and White populations in Brockton, the rates of death are magnitudes less for the Asian and Black populations. The Asian population death rate from cardiovascular disease is 47% less than that of the Asian population average and the death rate in the Black population is half that of the average for the Black population in the 500 cities. 32
Appendix
ABINGTON                                                              TOTAL    PERCENT
TOTAL                                                                 16,275
POPULATION
DEMOGRAPHICS      Asian (alone)                                       386      2.43%
                  Black or African American (alone)                   446      2.81%
                  Native American or Alaska Natives (alone)           0        0.00%
                  Native Hawaiian or Other Pacific Islander (alone)   0        0.00%
                  White (alone)                                       14,959   94.15%
                  Other race (alone)                                  160      1.01%
                  Two or more races                                   324      2.04%

                  Foreign Born Population                             1,406    8.85%
                  Veteran Population                                  991      6.09%
                  Disabled Population (Population aged 16+)           1041     9.09%

ECONOMIC          Population Below 100% FPL                           586      3.6%
                  Population Below 200% FPL                           2,205    13.56%
                  Housing Burdened                                             38.6%

EDUCATION         Population 25+                                      11,297
                  Population 25+ with Less Than High School Degree    592      5.24%
                  Population 25+ with High School Degree/Equivalent   3,045    26.95%
                  High School Graduation (2017)                                95.00%
                  High School Drop Out (2017)                                  3.00%

SUBSTANCE USE     Overdose Deaths (2017)                              3

BIRTHS            Total Births (2016)                                 213
                  Low Birthweight (2016)                              12       5.73%

CHRONIC DISEASE   Diabetes (2014)                                              9.70%
                  Obese (2014)                                                 22.40%

33
AVON TOTAL PERCENT
TOTAL 4,468
POPULATION
DEMOGRAPHICS Asian (alone) 390 9.56%
Black or African American (alone) 555 13.61%
Native American or Alaska Natives (alone) 0 0.00%
Native Hawaiian or Other Pacific Islander (alone) 0 0.00%
White (alone) 3,317 81.34%
Other race (alone) 116 2.84%
Two or more races 4,078 2.21%
Foreign Born Population 693 16.99%
Veteran Population 239 5.35%
Disabled Population (Population aged 16+) 345 9.09%
ECONOMIC Population Below 100% FPL 380 8.50%
Population Below 200% FPL 738 16.52%
Housing Burdened 59.5%
EDUCATION Population 25+ 3,387
Population 25+ with Less Than High School Degree 450 13.29%
Population 25+ with High School Degree/Equivalent 1,185 34.99%
High School Graduation (2017) 92.20%
High School Drop Out (2017) 5.90%
SUBSTANCE USE Overdose Deaths (2017) 2
BIRTHS Total Births (2016) 56
CHRONIC DISEASE Diabetes (2014) 9.00%
Obese (2014) 22.30%
34BRIDGEWATER TOTAL PERCENT
TOTAL 27,434
POPULATION
DEMOGRAPHICS Asian (alone) 541 2.01%
Black or African American (alone) 2,214 8.23%
Native American or Alaska Natives (alone) 33 0.12%
Native Hawaiian or Other Pacific Islander (alone) 14 0.05%
White (alone) 23,449 87.19%
Other race (alone) 501 1.86%
Two or more races 682 2.54%
Foreign Born Population 1,661 6.18%
Veteran Population 1,608 5.86%
Disabled Population (Population aged 16+) 880 3.76%
ECONOMIC Population Below 100% FPL 2,606 9.50%
Population Below 200% FPL 4,037 14.72%
Housing Burdened 50.6%
EDUCATION Population 25+ 15,030
Population 25+ with Less Than High School Degree 661 4.40%
Population 25+ with High School Degree/Equivalent 4,402 29.29%
High School Graduation 91.50%
(Bridgewater-Raynham 2017)
High School Drop Out 4.30%
(Bridgewater-Raynham 2017)
SUBSTANCE USE Overdose Deaths (2017) 7
BIRTHS Total Births (2016) 224
Low Birthweight (2016) 5 2.23%
CHRONIC DISEASE Diabetes (2014) 6.30%
Obese (2014) 20.90%
35BROCKTON TOTAL PERCENT
TOTAL 95,162
POPULATION
DEMOGRAPHICS Asian (alone) 1,876 2.01%
Black or African American (alone) 38,997 41.80%
Native American or Alaska Natives (alone) 381 0.41%
Native Hawaiian or Other Pacific Islander (alone) 38 0.04%
White (alone) 40,136 43.03%
Other race (alone) 10,317 11.06%
Two or more races 3,416 3.66%
Foreign Born Population 26,569 28.48%
Veteran Population 3,694 3.88%
Disabled Population (Population aged 16+) 7,297 9.93%
ECONOMIC Population Below 100% FPL 15,987 16.80%
Population Below 200% FPL 34,109 35.84%
Housing Burdened 55.1%
EDUCATION Population 25+ 60,744
Population 25+ with Less Than High School Degree 11,364 18.71%
Population 25+ with High School Degree/Equivalent 20,478 33.71%
High School Graduation (2017) 77.70%
High School Drop Out (2017) 8.60%
SUBSTANCE USE Overdose Deaths (2017) 29
BIRTHS Total Births (2016) 1446
Low Birthweight (2016) 153 10.58%
CHRONIC DISEASE Diabetes (2014) 11.60%
Obese (2014) 33.10%
36EAST TOTAL PERCENT
BRIDGWATER
TOTAL 14,301
POPULATION
DEMOGRAPHICS Asian (alone) 291 2.08%
Black or African American (alone) 519 3.70%
Native American or Alaska Natives (alone) 0 0.00%
Native Hawaiian or Other Pacific Islander (alone) 0 0.00%
White (alone) 12,972 92.59%
Other race (alone) 286 2.04%
Two or more races 233 1.66%
Foreign Born Population 714 5.10%
Veteran Population 619 4.33%
Disabled Population (Population aged 16+) 681 6.08%
ECONOMIC Population Below 100% FPL 944 6.60%
Population Below 200% FPL 2,200 15.38%
Housing Burdened 46.8%
EDUCATION Population 25+ 9,536
Population 25+ with Less Than High School Degree 385 4.04%
Population 25+ with High School Degree/Equivalent 2,076 21.77%
High School Graduation (2017) 96.20%
High School Drop Out (2017) 2.20%
SUBSTANCE USE Overdose Deaths (2017) 4
BIRTHS Total Births (2016) 129
Low Birthweight (2016) 8 6.20%
CHRONIC DISEASE Diabetes (2014) 7.70%
Obese (2014) 21.40%
37EASTON TOTAL PERCENT
TOTAL 24,001
POPULATION
DEMOGRAPHICS Asian (alone) 521 2.22%
Black or African American (alone) 941 4.01%
Native American or Alaska Natives (alone) 0 0.00%
Native Hawaiian or Other Pacific Islander (alone) 0 0.00%
White (alone) 21,956 93.51%
Other race (alone) 261 1.11%
Two or more races 322 1.37%
Foreign Born Population 1,775 7.56%
Veteran Population 1,139 4.75%
Disabled Population (Population aged 16+) 789 4.05%
ECONOMIC Population Below 100% FPL 1,128 4.70%
Population Below 200% FPL 2,431 10.13%
Housing Burdened 46.5%
EDUCATION Population 25+ 15,291
Population 25+ with Less Than High School Degree 598 3.91%
Population 25+ with High School Degree/Equivalent 3,111 20.35%
High School Graduation (2017) 98.30%
High School Drop Out (2017) 0.00%
SUBSTANCE USE Overdose Deaths (2017) 7
BIRTHS Total Births (2016) 174
Low Birthweight (2016) 10 5.75%
CHRONIC DISEASE Diabetes (2014) 8.10%
Obese (2014) 19.60%
38HANSON TOTAL PERCENT
TOTAL 10,560
POPULATION
DEMOGRAPHICS Asian (alone) 151 1.45%
Black or African American (alone) 54 0.52%
Native American or Alaska Natives (alone) 11 0.11%
Native Hawaiian or Other Pacific Islander (alone) 0 0.00%
White (alone) 10,087 96.91%
Other race (alone) 16 0.15%
Two or more races 241 2.32%
Foreign Born Population 278 2.67%
Veteran Population 678 6.42%
Disabled Population (Population aged 16+) 661 7.50%
ECONOMIC Population Below 100% FPL 359 3.40%
Population Below 200% FPL 1,053 9.97%
Housing Burdened 58.9%
EDUCATION Population 25+ 7,399
Population 25+ with Less Than High School Degree 435 5.88%
Population 25+ with High School Degree/Equivalent 2,182 29.49%
High School Graduation (Whitman-Hanson 2017) 95.60%
High School Drop Out (Whitman-Hanson 2017) 0.70%
SUBSTANCE USE Overdose Deaths (2017) 1
BIRTHS Total Births (2016) 87
Low Birthweight (2016) 5 5.75%
CHRONIC DISEASE Diabetes (2014) 7.40%
Obese (2014) 24.20%
39HOLBROOK TOTAL PERCENT
TOTAL 11,029
POPULATION
DEMOGRAPHICS Asian (alone) 596 5.71%
Black or African American (alone) 1,191 11.42%
Native American or Alaska Natives (alone) 0 0.00%
Native Hawaiian or Other Pacific Islander (alone) 0 0.00%
White (alone) 8,980 86.07%
Other race (alone) 146 1.40%
Two or more races 116 1.11%
Foreign Born Population 1,763 16.90%
Veteran Population 863 7.82%
Disabled Population (Population aged 16+) 925 9.80%
ECONOMIC Population Below 100% FPL 739 6.70%
Population Below 200% FPL 1,564 14.18%
Housing Burdened 73.4%
EDUCATION Population 25+ 8,234
Population 25+ with Less Than High School Degree 376 4.57%
Population 25+ with High School Degree/Equivalent 2,566 31.56%
High School Graduation (2017) 81.40%
High School Drop Out (2017) 11.40%
SUBSTANCE USE Overdose Deaths (2017) 3
BIRTHS Total Births (2016) 123
Low Birthweight (2016) 18 14.63%
CHRONIC DISEASE Diabetes (2014) 8.40%
Obese (2014) 25.90%
40RANDOLPH TOTAL PERCENT
TOTAL 33,704
POPULATION
DEMOGRAPHICS Asian (alone) 4,169 14.12%
Black or African American (alone) 13,216 44.75%
Native American or Alaska Natives (alone) 30 0.10%
Native Hawaiian or Other Pacific Islander (alone) 23 0.08%
White (alone) 13,728 46.48%
Other race (alone) 1409 4.77%
Two or more races 1,129 3.82%
Foreign Born Population 10,659 36.09%
Veteran Population 1,436 4.26%
Disabled Population (Population aged 16+) 2,681 9.54%
ECONOMIC Population Below 100% FPL 3,809 11.30%
Population Below 200% FPL 2,205 6.54%
Housing Burdened
EDUCATION Population 25+ 23.780
Population 25+ with Less Than High School Degree 3,429 14.42%
Population 25+ with High School Degree/Equivalent 6,883 28.94%
High School Graduation (2017) 76.70%
High School Drop Out (2017) 4.40%
SUBSTANCE USE Overdose Deaths (2017) 6
BIRTHS Total Births (2016) 397
Low Birthweight (2016) 38 9.57%
CHRONIC DISEASE Diabetes (2014) 9.20%
Obese (2014) 30.70%
41RAYNHAM TOTAL PERCENT
TOTAL 13,845
POPULATION
DEMOGRAPHICS Asian (alone) 492 3.60%
Black or African American (alone) 634 4.60%
Native American or Alaska Natives (alone) 0 0.00%
Native Hawaiian or Other Pacific Islander (alone) 0 0.00%
White (alone) 12,018 86.80%
Other race (alone) 30 0.20%
Two or more races 671 4.80%
Foreign Born Population 1,006 7.30%
Veteran Population 899 8.40%
Disabled Population (Population aged 16+) 608 5.49%
ECONOMIC Population Below 100% FPL 869 6.40%
Population Below 200% FPL 1,796 12.97%
Housing Burdened 29.72%
EDUCATION Population 25+ 9,684
Population 25+ with Less Than High School Degree 110 1.1%
Population 25+ with High School Degree/Equivalent 455 4.7%
High School Graduation 91.50%
(Bridgewater-Raynham 2017)
High School Drop Out 4.30%
(Bridgewater-Raynham 2017)
SUBSTANCE USE Overdose Deaths (2017) 4
BIRTHS Total Births (2016) 147
Low Birthweight (2016) 8 5.44%
CHRONIC DISEASE Diabetes (2014) 6.10%
Obese (2014) 20.50%
42ROCKLAND TOTAL PERCENT
TOTAL 17,849
POPULATION
DEMOGRAPHICS Asian (alone) 92 0.52%
Black or African American (alone) 611 3.44%
Native American or Alaska Natives (alone) 0 0.00%
Native Hawaiian or Other Pacific Islander (alone) 0 0.00%
White (alone) 16,640 93.71%
Other race (alone) 124 0.70%
Two or more races 382 2.15%
Foreign Born Population 927 5.22%
Veteran Population 938 5.26%
Disabled Population (Population aged 16+) 1,144 7.76%
ECONOMIC Population Below 100% FPL 1,124 6.30%
Population Below 200% FPL 7,905 44.29%
Housing Burdened 37.3%
EDUCATION Population 25+ 12,765
Population 25+ with Less Than High School Degree 545 4.27%
Population 25+ with High School Degree/Equivalent 4,458 34.92%
High School Graduation (2017) 89.10%
High School Drop Out (2017) 5.10%
SUBSTANCE USE Overdose Deaths (2017) 15
BIRTHS Total Births (2016) 191
Low Birthweight (2016) 9 4.71%
CHRONIC DISEASE Diabetes (2014) 5.80%
Obese (2014) 18.90%
43You can also read