Community Health Needs Assessment - Ocean Beach Hospital & Medical Clinics
←
→
Page content transcription
If your browser does not render page correctly, please read the page content below
Ocean Beach Hospital & Medical
Clinics
Community Health
Needs Assessment
2022 – 2024
Contents
 About Ocean Beach Hospital & Medical Clinics ........................................................................... 1
    Our Mission .................................................................................................................................... 1
    Our Community ............................................................................................................................ 1
    Our Services.................................................................................................................................. 2
 Methodology ....................................................................................................................................... 3
    Our Process................................................................................................................................... 3
    Data Collection ............................................................................................................................. 6
    Prioritization of Community Needs......................................................................................... 6
    Limitations .................................................................................................................................... 6
 Community Health Priorities........................................................................................................... 7
    Access to Primary Care, Care Coordination, and Chronic Disease .................................. 8
    Access to Specialty Care .......................................................................................................... 10
    Mental Health and Substance Abuse ...................................................................................... 11
    Other Identified Needs ..............................................................................................................12
 CHNA Implementation Plan ............................................................................................................13
    Access to Primary Care, Care Coordination, and Chronic Disease .................................13
    Access to Specialty Care ...........................................................................................................14
    Mental Health and Substance Abuse ......................................................................................14
 References and Acknowledgments ...............................................................................................15
    Primary Data Sources ................................................................................................................15
    Secondary Data Sources ...........................................................................................................15
    Consulting Expertise ..................................................................................................................15
 Evaluation of Previous Community Health Improvement Plan (2019 - 2021) ..................... 16
    Previous CHNA Priorities ......................................................................................................... 16
    Impact Evaluation ...................................................................................................................... 16
 Community Profile ........................................................................................................................... 18
    Demographic Indicators .......................................................................................................... 18
    Socioeconomic Indicators ........................................................................................................21
    Health and Wellness Indicators.............................................................................................. 26
    Accessibility of Care Indicators .............................................................................................. 38
 Existing Healthcare and Community Resources ....................................................................... 42
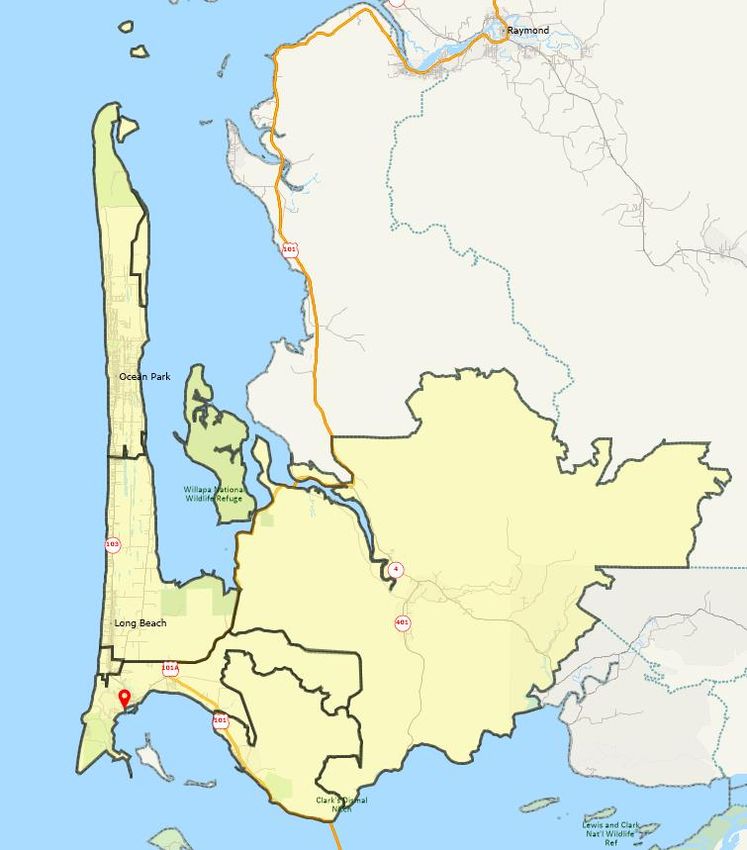
About Ocean Beach Hospital & Medical
Clinics
Our Mission
Founded in 1934, Ocean Beach Hospital & Medical Clinics (“OBHMC”) is a community-
owned and operated public health district, consisting of a 25-bed Critical Access Hospital
(“CAH”) and clinic system. At OBHMC, our mission is to provide access to both routine and
critical health care services for the people who live, work, and play in our community. Our
purpose is to ease the pain and improve the health of the people who are in our care.
Our Community
OBHMC is located in Ilwaco, Washington.
OBHMC’s primary service area includes the
following zip codes: 98614 (Chinook), 98624
(Ilwaco), 98631 (Long Beach), 98638 (Naselle),
98640 (Ocean Park), 98641 (Oysterville), and
98644 (Seaview). The primary service area was
determined from the zip codes that reflect a
majority of OBHMC’s patient discharges and
clinic visits. The majority of cities and
communities in the service area can be found in
Pacific County.
Service Area
98614 (Chinook) 98640 (Ocean Park)
98624 (Ilwaco) 98641 (Oysterville)
98631 (Long Beach) 98644 (Seaview)
98638 (Naselle)
Ocean Beach Hospital & Medical Clinics
PSA
1
In 2020, our hospital and clinics served:

        24,009                                                            6,000
                                 385                    315
      outpatient                                                        emergency
                              surgeries             discharges
         visits                                                         room visits

Our Services
OBHMC provides an extensive array of
inpatient and outpatient services, including               Primary
emergency medicine, lab, imaging, physical                  Care
therapy, surgery, pulmonary rehabilitation,
cardiac rehabilitation, echocardiography, and                          Specialty
swing bed services. The staff consist of a mix of                        Care
the following specialties: family practice,               Patient-
internal medicine, physical and occupational              centered
therapy, surgery, women’s health, and                       care
cardiology.
                                                                        Surgical
                                                                        Services
As a CAH, OBHMC serves as the sole provider
of a predominately rural community with
                                                           Hospital
limited access to healthcare services. People              Services
who live in rural communities face a higher
degree of socio-economic and health
disparities compared to their urban counterparts. Every three years, OBHMC assesses the
health status of the community to identify unmet health needs in the primary service area
based on population trends, health indicators, socio-economic factors, and leading causes
of death.

To learn more about Ocean Beach Hospital & Medical Clinics, visit
www.oceanbeachhospital.com.

                                                                                        2
Methodology
Our Process
The following explains the process followed to conduct the need assessment:

       Review                               Gather and
                         Define our                           Prioritize         Implement
       past need                            analyze
                         community                            needs              strategy
       assessment                           data

       • Assess impact   • Review patient   • From primary    • Develop          • Identify
         of previous       origin             and secondary     prioritization     strategies
         CHNA            • Assign             data sources      criteria         • Identify
                           geographic       • Summarize       • Select             collaboration
                           boundaries         key health        priorities         opportunities
                                              needs                              • Develop
                                                                                   implmentation
                                                                                   plan

This process was overseen by the Community Health Needs Assessment (“CHNA”) Advisory
Committee, which consists of hospital leadership. Committee members were selected
based on their knowledge of and role within the community, as well as the relevant skills
and qualifications to execute the steps of the CHNA process.

The committee consists of the following members:

                    LARRY COHEN, CHIEF EXECUTIVE OFFICER
                    Larry Cohen was named Chief Executive Officer of OBHMC in the fall of
                    2016. He worked for the organization in other capacities for
                    approximately two years prior, having served as an independent
                    consultant, Chief Operating Officer, and then interim CEO.

                    Cohen has more than 40 years of experience in healthcare
                    management. He served as a System Director for growth and business
                    development at PeaceHealth, where he was a principal in the
                    CHI/Franciscan merger project and the Cascade Valley Hospital
                    merger project, among other strategic collaborations. Cohen also
                    developed PeaceHealth’s telemedicine/telestroke service.

                                                                                                   3
BRENDA SHARKEY, CHIEF NURSING OFFICER
As OBHMC’s Chief of Nursing, Brenda Sharkey is responsible for the
nursing services provided in the hospital’s inpatient, swing bed,
surgery, and emergency departments. Sharkey also oversees the
clinics, all physical therapy, and cardiac/pulmonology rehabilitation
services. Sharkey possesses a Black Belt in Lean Management.

BETH HASH, CONTROLLER AND BUSINESS OFFICE MANAGER
Beth Hash joined OBHMC in 2013. She has more than 25 years of
experience in healthcare revenue cycle, financial, and business
management. She has worked in larger facilities across the country,
but found her passion working with small rural or critical access
hospitals. Hash believes strongly in community and is an advocate for
affordable and quality healthcare on the Long Beach Peninsula.

DEBORAH PERSIAN, CLINIC MANAGER
Deborah Persian is the Clinic Manager for OBHMC. She manages and
supervises the operational and administrative functions, activities, and
projects of our primary care and specialty clinic(s). Persian has over 25
years of medical management including consulting, hospital, and clinic
experience. She has an extensive background in financial and clinical
operations in hospital, primary, pediatric, and specialty clinics.
Persian’s focus has always been to ensure excellent patient care and
make a difference in the lives of the patients we serve.

JULIE OAKES, COMPLIANCE OFFICER/RISK MANAGER
Julie Oakes, RN, has had a long and distinguished career in service to
South Pacific County and OBHMC. She currently manages OBHMC’s
insurance package, compliance with OBHMC’s policies, procedures and
license requirements, and manages OBHMC’s health care access team
that performs patient registration functions and answers/directs
phone calls that come into the hospital. Oakes also supports OBHMC’s
responses and follow-ups to care/service concerns that are brought
forward and/or entered into OBHMC’s Action Cue system.

STACEY BROWN, HUMAN RESOURCES MANAGER
Stacey Brown, SHRM-SCP, is a strong HR professional with extensive
experience in workforce leave administration, conflict management,
training and development, coaching and encouragement, fostering a
diverse workforce while monitoring inclusion efforts, collective bar-
gaining and working with Union officials, program implementation,

                                                                            4
project management, HR strategy, and staff development and has a
                  deep understanding of all things HR. Her 13 years of HR experience
                  have primarily been in the healthcare field.

The process used to complete this needs assessment is in full compliance with section
501(r)(3) of the Internal Revenue Code. This needs assessment was approved by the Public
Hospital District No. 3 of Pacific County’s Board of Commissioners.

                                                                                       5
Data Collection
Information was collected from primary            ▶   Vulnerable populations who
and secondary data sources to identify                experience disparities
unmet needs within the community.                 ▶   Suggestions or ideas to address
Information was summarized into key                   the community’s needs
themes, which served as the basis of the          ▶   Potential resources/
community’s unmet health needs.                       infrastructure to support health,
                                                      social, behavioral, or
PRIMARY DATA                                          environmental needs
Primary data represents information that          ▶   Areas for collaboration to address
was collected first-hand from                         health needs
stakeholders within OBHMC’s
community. This data was collected to          SECONDARY DATA
validate secondary data findings as they       Secondary data was collected from
pertain to the service area, identify issues   statistical data sources available from
that were not represented in the               local, regional, state, and national
secondary data, and understand what            organizations. The secondary data
specific subgroups of the community may        provides a profile of the social, economic,
face additional challenges or disparities.     and health characteristics of the
                                               community.
Interviews were conducted with people
who best represented the broad interests,      Sources of data include:
experiences, and needs of the                     ▶ ESRI Business Information
community, particularly persons who                  Solutions (American Community
represent the medically underserved and              Survey and U.S. Census)
vulnerable populations within the                 ▶ County Health Rankings
community. A complete list of the                 ▶ Washington State Department of
interview participants can be found in the           Health
Acknowledgments.                                  ▶ Health Resources & Services
                                                     Administration (“HRSA”)
The interviews were designed to solicit           ▶ Medicare.gov
information pertaining to the following           ▶ U.S. Department of Health &
topics:                                              Human Services (Substance Abuse
    ▶ Significant health care issues or              and Mental Health Services
        needs                                        Administration)
    ▶ Social, behavioral, and                     ▶ Definitive Healthcare
        environmental factors that
        contribute to health needs
    ▶ Barriers to care within the
        community

                                                                                         6
Prioritization of Community Needs
Once the primary and secondary data were gathered, the data was analyzed to identify key
themes that represented the unmet health needs within the community. The Advisory
Committee prioritized the community needs based on the following criteria:
Scope
• How many individuals are touched by this issue?
Significance
• How significantly does the issue impact those touched by it?
Impact
• How much of an impact can OBHMC have on addressing this issue?
Each committee member individually rated the identified needs along these criteria, and
then convened as a group to identify which needs would be prioritized by OBHMC over the
next three years.
Limitations
OBHMC, in collaboration with Wipfli, has engaged in an extensive process to develop a
health needs assessment that is rooted in the most detailed information available at the
time of the writing of this report.
However, OBHMC recognizes that the responses reflected in the interviews represents the
opinions of the respondents and may not reflect the actual needs of the community. While
every effort was made to recruit a set of diverse and representative perspectives, this
needs assessment is limited as there is no way to guarantee that the perspectives and
opinions of these participants are fully representative of those in the service area.
Additionally, county-level data is featured in this report when more local data pertaining to
the hospital’s service area was not available. The extent to which local needs vary from
county, state, or national trends cannot be ascertained with any degree of certainty.
OBHMC’s emphasis on recruiting a set of diverse stakeholders and using local or regional
data when available to determine the social, economic, and health needs of the community
demonstrates OBHMC’s commitment to understanding and meeting the needs of their
service area.
6Community Health Priorities
The 2022 community health priorities, in no particular order, are:
Access to
primary care, Mental
Access to
care health and
specialty
coordination substance
care
and chronic abuse
disease
Additional context regarding the selection of these health needs as priorities for OBHMC is
provided below:
ACCESS TO PRIMARY CARE, CARE COORDINATION AND CHRONIC DISEASE
Better access to primary care providers and services as well as chronic disease and
wellness services. Improved coordination between different community organizations.
ACCESS TO SPECIALTY CARE
Better access to specialty providers and specialty services.
MENTAL HEALTH AND SUBSTANCE ABUSE
Better access to mental health providers and treatment for substance abuse and addiction.
7Access to Primary Care, Care Coordination, and
Chronic Disease
The Issue The Impact The Needs
Lack of primary Patients are unable Better access to
care providers and to access primary primary care
urgent care care and providers and
services preventive services services as well as
Lack of Patients have a chronic disease
coordination of difficult time and wellness
services between navigating and services
organizations accessing services Improved
Lack of chronic that they need coordination
disease and between different
wellness services community
organizations
Lack of primary care and urgent care services, lack of coordination of services between
different organizations in the community, and lack of chronic disease and wellness
services are significant health issues in the community based on information from
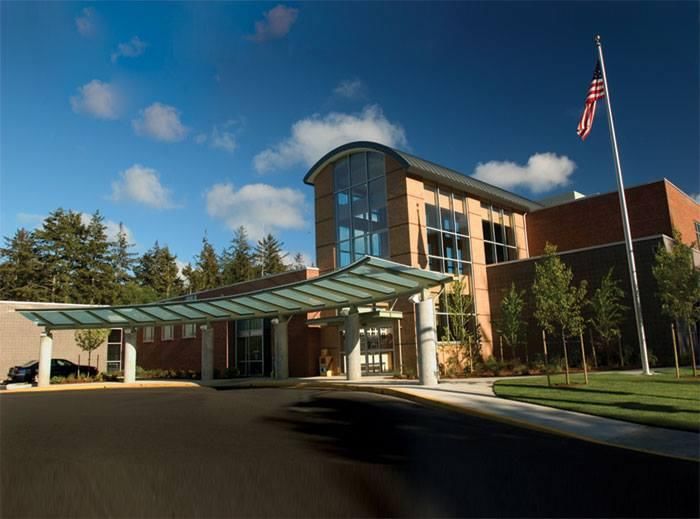
community stakeholders and secondary data sources. According to County Health
Rankings, Pacific County faces a severe shortage of primary care providers relative to
state and national benchmarks. The Health Resources & Services Administration
reports that low-income individuals specifically lack access to providers, with Pacific
County needing an additional 2.8 providers to compensate for current shortages.
Insufficient provider coverage and lack of accessible care options, such as same-
day/walk-in/urgent care services, create inaccessibility to primary care services,
which may cause people to utilize the emergency department for non-emergent care
or have to drive out of state to access the nearest urgent care clinic.
OBHMC also experiences challenges with recruiting, and retaining competent, highly
qualified providers, which contributes to access challenges. Due to the rural nature of
the community, some providers practice in Ilwaco long enough to pay off their student
loans before moving to a larger city or town. Providers also find it challenging to find
appropriate housing for them and their families, which negatively impacts retention.
High provider turnover indicates that patients lack the opportunity to build a long-term
relationship with their providers, impacting the quality and continuum of care received
by the patient.
8Stakeholders also reported a need for care coordination services which, according to
the Agency for Healthcare Research and Quality, consists of services to share
information and organize care activities among all people concerned with a patient’s
care in order to achieve better health outcomes. Stakeholders reported a need for care
coordination not only within the healthcare system, but also between the healthcare
system and other public assistance organizations to ensure that people are able to
access the services that they need. The populations most in need of care coordination
services are the elderly and low-income individuals. Stakeholders also reported that
people lack awareness of what services the hospital offers, which indicates a need to
improve marketing or advertising of services to the community.
Stakeholders also reported a lack of chronic disease and wellness services, particularly
for medically complex patients with multiple comorbid diseases. According to County
Health Rankings, adults in Pacific County exhibit a higher rate of chronic disease and
preventable hospital stays compared to state and national benchmarks, while also
exhibiting lower rates of preventative health screening and vaccinations. Preventive
wellness, access to healthy foods, and living a healthier lifestyle helps to alleviate the
prevalence of chronic disease. Currently, 38.0% of adults in Pacific County are obese
and 26.0% are physically inactive, both of which are significant risk factors for chronic
disease. Additionally, people in Pacific County report a higher degree of food
insecurity, or lack of access or affordability of healthy food options, compared to state
and national benchmarks, which also makes it more challenging for people in Ilwaco to
live a healthy lifestyle.
9Access to Specialty Care
The Issue The Impact The Needs
Lack of specialty Inaccessibility of Better access to
providers and specialty services specialty providers
specialty services in especially for the and specialty
the community aging population services
Patients must
travel outside the
county or state to
access services,
which can be a
challenge for some
demographics
Community stakeholders identified the lack of access to specialty services as a major issue
in the community. Stakeholders report that few specialists are accessible in Ilwaco, which
often requires members of the community to travel outside of the county or even the state
of Washington to access these services. Stakeholders specifically reported a need for the
key specialties needed to support an aging population, such as cardiology, orthopedics,
oncology and cancer care, and urology. Some stakeholders cited challenges with
recruiting specialty providers, even on an outreach or visiting basis, given the small size of
the community and the geographic proximity from major healthcare hubs such as Seattle
or Portland. Patients who lack access to specialists may forego care due to access,
transportation, or financial barriers, which results in poorer health outcomes.
Lack of specialty services in Ilwaco places a disproportionate burden on people without
reliable access to transportation or people who are unable to travel for services, such as
low-income families and the elderly. Insured and uninsured patients alike may also
experience challenges finding specialty providers either at an affordable cost or within
their insurance network, particularly for Medicaid patients given the limitations in
coverage for out-of-state services.
10Mental Health and Substance Abuse
The Issue The Impact The Needs
Lack of mental Patients may go Better access to
health and untreated, mental health and
substance abuse resulting in poorer substance abuse
providers mental health and providers and
Lack of substance quality of life services
abuse treatment Patients must
travel outside the
county or state
which can be a
challenge for some
demographics
Mental health and substance abuse are significant health issues in the community.
According to County Health Rankings, adults in Pacific County exhibit higher rates of poor
mental health, alcohol and drug abuse, suicide, and drug overdose deaths compared to
state and national benchmarks. Per the Washington State Department of Health, adults in
the Cascade Pacific Action Alliance (“CPAA”), a geographic designation that consists of a
seven-county region including Pacific County, report higher rates of chronically poor
mental health, depression, and drug use compared to state benchmarks. These statistics
indicate a need for accessible mental health and substance abuse providers and treatment
options in Ilwaco which, according to community stakeholders, is currently lacking.
Community stakeholders generally report that the behavioral health system is underfunded
in Pacific County, with only one organization in the county currently offering mental health
and substance abuse treatment, which results in a significant gap in care. Thus, there is a
need to develop stronger referral partnerships with mental health and substance abuse
organizations, and to train providers to offer mental health evaluations, medication
management, and medication-assisted treatment (“MAT”) in the primary care setting, in
order to facilitate better access to these services.
11Other Identified Needs
The following health needs were identified throughout the community health needs
assessment process but were not selected by the CHNA Advisory Committee as the
committee felt that OBHMC has neither the expertise nor the resources to lead efforts in
these areas. OBHMC will continue to engage in and support community partnerships with
other organizations in the community with expertise in these areas.
HOME HEALTH, LONG TERM CARE, AND AGING AND/ELDERLY CARE
AFFORDABLE HOUSING
12CHNA Implementation Plan
With collaboration from Wipfli and the Advisory Committee, OBHMC developed an
implementation plan to address the health needs that were prioritized through this needs
assessment. The plan addresses the following for each prioritized health need:
Strategic Objectives
•How will OBHMC strategically address this issue?
Tactics
•How will OBHMC tactically address this issue?
OBHMC will explore the following strategic objectives and tactics to address the prioritized
health needs:
Access to Primary Care, Care Coordination, and
Chronic Disease
Strategic Objectives
•Align care coordination with primary care and chronic disease support services
Tactics
•Improve clinic work flow to increase patient access to care
•Explore and encourage provider interests in specialized areas of practice, such
as chronic disease support, diabetes management, etc.
•Integrate care coordination with primary care
•Expand Ilwaco clinic footprint to accommodate additional providers/specialties
(triple the square footage to include more workspace). Create a healing garden
between the old and new buildings for a more holistic approach to wellness
•Leverage ACO workplans to facilitate care coordination initiatives
•Increase chronic disease group class frequency to pre Covid-19 pandemic
numbers
13Access to Specialty Care
Strategic Objectives
•Expand accessibility of specialty services closer to home
Tactics
•Develop partnerships with other healthcare organizations to contract with
outreach specialists
•Conduct a physician need assessment to determine the unmet need for
providers, by specialty
•Explore the financial and operational feasibility of offering an outreach specialty
program
•Utilize vacant office space for visiting specialists
•Develop strategies to support telemedicine implementation and utilization
Mental Health and Substance Abuse
Strategic Objectives
•Expand accessibility of mental health services and resources to our core patient
base
Tactics
•Integrate licensed clinical social worker into the primary care setting
•Implement provider training on how to recognize the early signs of mental health
and substance abuse issues
•Develop informational tools for both providers and patients regarding services,
resources, and treatment options available for mental health and substance
abuse issues
•Work with the education department to provide classes and support groups
•Investigate the development of a program that supports patients going through
alcohol withdrawal
14References and Acknowledgments
Primary Data Sources
This report was made possible through the contribution of the following organizations,
who participated in the community input process of this needs assessment:
• Area Agency on Aging
• Lead to Results Consulting
• City of Long Beach, WA
• Pacific County
• Pacific County Public Health
• Adrift Hospitality
• Washington State Department of Social and Health Services
• Ocean Beach Hospital & Medical Clinics
• Peninsula Poverty Response
Secondary Data Sources
Secondary data was collected from the following sources:
• ESRI Business Information Solutions (American Community Survey and U.S. Census)
• County Health Rankings
• Washington State Department of Health
• Health Resources & Services Administration (“HRSA”)
• Medicare.gov
• U.S. Department of Health & Human Services (Substance Abuse and Mental Health
Services Administration)
• Definitive Healthcare
Consulting Expertise
Wipfli LLP (Wipfli), a national certified public accounting and consulting firm, assisted
OBHMC with all stages of this assessment, including collection and analysis of primary and
secondary data, identification of community health needs, direction of the prioritization
process, and compilation of the needs assessment report.
15Evaluation of Previous Community
Health Improvement Plan (2019 - 2021)
Previous CHNA Priorities
OBHMC conducts a community health needs assessment every three years in compliance
with and as part of our ongoing efforts to address our community’s most significant health
needs. Our previous CHNA identified the following prioritization areas:
▶ Access to Primary Care, Availability of Providers, and Coordination of Care
▶ Chronic Disease Support Services
▶ Mental Health and Substance Abuse
▶ Cancer Care Coordination
▶ Poverty’s Impact on Health
Impact Evaluation
The following summarizes OBHMC’s effort in carrying out the previous CHNA’s
improvement plan for the identified priorities:
Access to Primary Care, Availability of Providers, and Coordination of Care
• OBHMC increased the number of primary care providers employed in our clinics to
reduce wait times for patients. OBHMC also extended our clinics’ operational hours
and opened a Saturday clinic to provide more convenient care options for patients.
• OBHMC also added a lab station in our Ocean Park clinic to offer more convenience
for patients.
Chronic Disease Support Services
• OBHMC created policies and procedures regarding chronic disease management to
improve communication and care coordination between chronic disease care staff
and providers. OBHMC has also educated providers regarding the types of chronic
disease support services available.
• The COVID-19 pandemic impacted OBHMC’s ability to host its free chronic disease
support workshops due to the COVID-19 pandemic. Classes have since resumed and
will continue to be offered to provide education that helps patients with chronic
disease better manage their conditions.
• OBHMC began hosting an annual Health Fair to provide educational classes, free
medical screenings, kid-friendly activities, and community health providers with
information on health and safety services that are available locally.
16Mental Health and Substance Abuse
• OBHMC created a new clinical social worker position to facilitate better access to
mental health and substance abuse services, including case management for these
patients.
• OBHMC also improved access to DCRs (Designated Crisis Responder) through
utilization of telehealth to decrease the amount of time it takes to get behavioral
health services to patients.
• OBHMC staff have also been trained in patient de-escalation for mental health crises,
as well as in suicide prevention to reduce adverse outcomes during an acute crisis.
Cancer Care Coordination
• OBHMC has explored opportunities to collaborate with other healthcare facilities to
improve accessibility to cancer care services in Ilwaco. However, much of these
opportunities have been put on hold due to workforce and resource shortages due to
the COVID-19 pandemic.
Poverty’s Impact on Health
• OBHMC’s clinical social worker implemented standard patient questioning regarding
whether patients can afford their medications, have access to transportation, and
other barriers to care patients may be experiencing.
17Community Profile
Demographic Indicators
COMMUNITY PROFILE AT-A-GLANCE
Growth projected
Number of people Percent of the Percent of the
for the 65+ age
living in the service population over population under
cohort over the
area the age of 65 the age of 19
next five years
12,331 632
37.9% 15.0%
people people
The service area population is
12,331 people. According to future
Population distribution by age
projections provided by ESRI for category
the service area, the population is Ages 0-19 Ages 20-44 Ages 45-64 Ages 65+
expected to increase slightly over
the next five years, by 3.6% or 448
people. Washington is anticipated 17.0% 17.2%
to grow at a significantly faster 32.7%
37.9%
rate of 6.6% over the next five
Percent of Total Population
years, while the USA population is 25.2% 25.0%
expected to grow by 3.6%.
27.5%
There will also be a shift in the age 28.1%
distribution of the population.
33.9% 33.3%
The 0-64 age group is projected
to decline by 3.6% or 184 people 22.3%
over the next five years, while the 19.0%
over 65 age group is projected to
23.9% 24.4%
increase by 3.6% or 632 people. 15.0% 17.5%
Currently, 37.9% of the population
is over the age of 65, which is
PSA Pacific Washington USA
higher than Pacific County, County
Washington, and the USA.
Source: ESRI Business Information Solutions, 2021
182021 Population
Primary Service Area Pacific County Washington United States
Number Percent Number Percent Number Percent Number Percent
Ages 0-19 1,845 15.0% 3,888 18% 1,862,476 23.9% 81,593,975 24.4%
Ages 20-44 2,344 19.0% 4,973 22% 2,641,963 33.9% 111,174,909 33.3%
Ages 45-64 3,470 28.1% 6,115 28% 1,968,990 25.2% 83,512,738 25.0%
Ages 65-74 2,903 23.5% 4,438 20% 810,586 10.4% 34,001,571 10.2%
Ages 75-84 1,376 11.2% 2,164 10% 369,309 4.7% 16,823,461 5.0%
Ages 85+ 393 3.2% 694 3% 148,722 1.9% 6,827,458 2.0%
Total 12,331 100.0% 22,272 100% 7,802,046 100.0% 333,934,112 99.9%
2026 Population
Primary Service Area Pacific County Washington United States
Number Percent Number Percent Number Percent Number Percent
Ages 0-19 1,973 15.4% 4,109 18% 1,958,805 23.6% 83,573,756 24.2%
Ages 20-44 2,282 17.9% 4,859 21% 2,800,502 33.7% 114,229,526 33.0%
Ages 45-64 3,220 25.2% 5,734 25% 1,969,656 23.7% 81,663,828 23.6%
Ages 65-74 3,063 24.0% 4,701 21% 913,222 11.0% 37,398,003 10.8%
Ages 75-84 1,793 14.0% 2,762 12% 505,875 6.1% 21,582,428 6.2%
Ages 85+ 448 3.5% 778 3% 167,310 2.0% 7,439,954 2.2%
Total 12,779 100.0% 22,943 100% 8,315,370 100.1% 345,887,495 100.0%
Source: ESRI Business Information Solutions
19RACE AND ETHNICITY
OBHMC’s service area is predominantly white, with 83.2% of the population made up of
white alone. This is followed by the Hispanic population at 7.1% of the population.
Pacific County maintains a slightly more diverse racial distribution than the PSA. The
racial distribution in both of these areas are less diverse than the state of Washington
and nationally.
Population distribution by race/ethnicity
Percent of Total Population
Hispanic
Biracial
Some Other Race
Pacific Islander
83.2% 76.5% Asian
63.3% 58.2% Alaska Native/Native American
Black
White
PSA Pacific County Washington USA
Source: ESRI Business Information Solutions, 2021
20Socioeconomic Indicators
COMMUNITY PROFILE AT-A-GLANCE
Percent of Pacific
Percent of Pacific Average cost of
Median income in County that
County with a high housing in the
the service area experiences food
school degree service area
insecurity
$43,184 93.0% $328,083 17.0%
INCOME AND POVERTY
Income data was analyzed for the service area and Pacific County
and compared to the state of Washington and the USA. 2021 data
reveals that the median household income, average household
income, and per capita income for the service area and Pacific
County are significantly lower than Washington and the USA. Over
the next five years, income levels are expected to rise in the service
area, Pacific County, Washington, and the USA in line with inflation,
indicating an overall healthy economy. Pacific County also exhibits
higher rates of income inequality compared to state and the 90th
percentile national benchmarks, indicating greater disparities
between poor and wealthy constituents.
Income inequality ratio
2021
Primary Pacific United
Service Area County
Washington
States 90th
3.7
Percentile
Median Household Income $43,184 $46,064 $78,111 $64,730
Average Household Income $63,921 $63,737 $106,220 $92,435
Per Capita Income $31,494 $29,214 $41,358 $35,106
Washington 4.4
2026
Primary Pacific United
Washington
Service Area County States
Median Household Income $46,334 $49,993 $88,474 $72,932 Pacific County 4.9
Average Household Income $70,937 $70,739 $120,805 $103,679
Per Capita Income $35,012 $32,494 $47,038 $39,378
Source: ESRI Business Information Solutions Source: County Health Rankings, 2021
Metric: Ratio of household income at the 80th
percentile to income at the 20th percentile.
21According to the 2019 American Community Survey, 17.5% of households in the primary
service area are below the federal poverty level, which is higher than Pacific County’s
level of 16.8% as well as Washington and the USA.
Households below poverty level
USA 12.9%
Washington 10.3%
Pacific County 16.8%
Primary Service Area 17.5%
Source: American Community Survey, 2019
EDUCATIONAL ATTAINMENT
Pacific County ranked higher in high school graduation rates than state
benchmarks; however, both ranked slightly lower than the national
benchmarks of 95.0%.
High school graduation rate
90th
95.0%
Percentile
Washington 89.0%
Pacific County 93.0%
Source: County Health Rankings, 2021
Metric: Percentage of ninth-grade cohort that graduates in four years.
22AFFORDABLE AND ACCESSIBLE HOUSING
14.0% of households in Pacific County experience at least one in four
housing problems such as overcrowding, high housing costs, lack of
kitchen facilities, or lack of plumbing facilities. This rate is slightly lower
than state benchmarks but 5.0% higher than the national benchmarks of
9.0%. According to the 2019 American Community Survey, there were
5,582 vacant housing units(1) in the primary service area, only 3.2% of
which were available to purchase or rent. There were no vacant units for
migrant workers. This indicates that there is an inaccessibility of
adequate housing in the service area and regionally.
According to the 2019 American Community Survey, 7.5% of the
households in the service area do not have internet access and per ESRI
Business Information Solutions, 2.4% of households in 2021 do not own a
cell phone. Also, according to County Health Rankings, 12.0% of
households in Pacific County spend 50% or more of their household
income on housing. This is slightly lower than the state benchmarks but
almost double the national benchmarks, indicating that housing is more
expensive and cost-prohibitive for people who live in Pacific County.
Percent of population who Vacant housing units by type
experience severe housing
problems
Other Vacant 6.8%
For Seasonal,
90th
9.0% Recreational, or 89.6%
Percentile
Occasional Use
For Sale Only 2.0%
Washington 17.0%
Rented, Not Occupied 0.4%
Pacific County 14.0%
For Rent 1.2%
Source: County Health Rankings, 2021 Source: American Community Survey, 2019
Metric: Percentage of households with at least 1 of 4 housing
problems: overcrowding, high housing costs, lack of kitchen
facilities, or lack of plumbing facilities.
According to the U.S. Census, a housing unit is vacant if no one is living in it at the time of interview. “Units occupied at the
(1)
time of interview entirely by persons who are staying two months or less and who have a more permanent residence elsewhere are
23
considered to be temporarily occupied and are classified as vacant”.Severe housing cost burden Households with no vehicle
Pacific County Washington Owners no vehicle Renter no vehicle
90th Percentile 18.4%
18.0% 14.9%
12.3%
14.0% 14.0% 14.0% 9.5%
12.0% 12.0%
4.8%
4.4% 3.1%
2.1%
9.0%
7.0% 7.0%
2019 2020 2021
Source: County Health Rankings, 2021
Metric: Percentage of households that spend 50% or more of Source: American Community Survey, 2019
their household income on housing
Households with no internet Phone access by household
access
Households that do not own any cell phones
Households have a landline
USA 5.3% Households have cell phone only
64.7% 64.5%
55.1%
51.6%
Washington 3.5%
47.9%
44.4%
Pacific County 6.7% 35.0% 35.1%
2.4% 2.7% 1.8% 2.0%
Primary Service Area 7.5%
Primary Pacific County Washington USA
Service Area
Source: American Community Survey, 2019 Source: ESRI Business Information Solutions, 2021
24FOOD SECURITY
17.0% of the population in Pacific County lacks adequate access to healthy
food which is 6.0% higher than state benchmarks and almost double the
national benchmarks. Additionally, 13.0% of the population in Pacific
County are low income and lack convenient access to a grocery store,
which is double the state benchmarks and more than six times higher than
the national benchmarks. According to the 2019 American Community
Survey, 17.5% of households in the service area received food stamps and
3.1% received public assistance income.
Percent of population who Limited access to health
experience food insecurity foods
90th
9.0% 90th Percentile 2.0%
Percentile
Washington 11.0% Washington 6.0%
Pacific County 17.0% Pacific County 13.0%
Source: County Health Rankings, 2021 Source: County Health Rankings, 2021
Metric: Percentage of population who lack adequate access to Metric: Percentage of population who are low-income and do
food. not live close to a grocery store.
Households receiving
assistance
Households Receiving Food Stamps/SNAP
Households with Public Assistance Income
19.4%
17.5%
11.7% 11.9%
3.1% 3.5% 2.4% 3.0%
Source: American Community Survey, 2019
25Health and Wellness Indicators
BIRTH OUTCOMES
Newborn birthweight is a strong predictor of newborn health and survival. Rates of low
birthweight in a community are often associated with poor maternal health. Low
birthweights can lead to higher rates of fetal mortality, stunted growth, impaired
cognitive developments, and chronic disease in later life. Low birthweight percentages
in Pacific County decreased slightly since 2019 to 7.0% in 2021. This is 1.0% above state
and national benchmarks.
Teen birth rates were also analyzed for Pacific County. While the rate has been steadily
decreasing over the past three years, teen birth rates in the Pacific County are
significantly higher than state benchmarks and almost double the national benchmarks.
Percent of total births with Number of teen births per
low birthweight 1,000 females
Pacific County Washington Pacific County Washington
90th Percentile 90th Percentile
8.0% 32
7.0% 7.0% 28
6.0% 6.0% 6.0%
20 23
18
6.0% 6.0% 6.0% 16
14 13 12
2019 2020 2021 2019 2020 2021
Source: County Health Rankings, 2021 Source: County Health Rankings, 2021
Metric: Percentage of live births with low birthweight (< Metric: Number of births per 1,000 female population ages
2,500 grams). 15-19.
26CAUSE OF DEATH
In 2019, the leading cause of death in Pacific County was diseases of heart, followed by
malignant neoplasms (cancer), and chronic lower respiratory disease.
Top 10 leading causes of death in pacific county
Other 79
Lung Bronchus Trachea 17
Cerebrovascular Disease 11
Chronic Lower Respiratory Disease 22
Accidents 18
Malignant Neoplasms 74
Diseases of Heart 110
Source: Washington State Department of Health, 2019
27GENERAL POPULATION HEALTH
The number of people who report poor or fair health in Pacific County is 5.0% higher
than Washington, and both Pacific County and Washington rates are higher than national
benchmarks. A similar measure is poor physical health days, which refer to the number
of days in which an individual does not feel well enough to perform daily physical tasks.
Rates in Pacific County have increased since 2019, where the current rate of 4.8 days is
greater than state and national benchmarks. Collectively, these results indicate that
people in Pacific County are generally feeling worse physically and consider themselves
to be less healthy than people in the state and nationally.
Percent of adults reporting Average number of physically
poor or fair health unhealthy days reported in
the past month
Pacific County Washington
90th Percentile Pacific County Washington
90th Percentile
18.0% 18.0% 20.0%
16.0% 4.4 4.3 4.8
14.0% 15.0% 3.9
3.7 3.7
14.0%
12.0% 12.0% 3.4
3 3.1
2019 2020 2021 2019 2020 2021
Source: County Health Rankings, 2021 Source: County Health Rankings, 2021
Metric: Percentage of adults reporting fair or poor health Metric: Average number of physically unhealthy days
(age-adjusted). reported in past 30 days (age-adjusted).
28MENTAL HEALTH
People in Pacific County report higher
Average number of mentally
rates of mentally unhealthy days compared
unhealthy days reported in
to state and national benchmarks. Rates
the past month
have been steady in Pacific County since
2019 but have recently plateaued at 4.7 Pacific County Washington
days in 2021, 0.7 and 0.9 days greater than 90th Percentile
state and national benchmarks, 4.5 4.5 4.7
respectively. Mental health remains a 3.8
4.1 4.0
challenge in many rural communities
3.8
across the country. 3.4
3.1
2019 2020 2021
Source: County Health Rankings, 2021
Metric: Average number of mentally unhealthy days reported
in past 30 days (age-adjusted).
According to the Washington State
14+ days of poor mental
Department of Health, in 2019, 15.5% of
health reported by adults in
adults in Cascade Pacific Action Alliance
the past month
(“CPAA”), a designation that consists of the
Cascade Pacific Action Alliance Washington seven-county region of Central Western
Washington which includes Cowlitz, Grays
15.5% Harbor, Lewis, Mason, Pacific, Thurston,
12.8%
and Wahkiakum counties, reported having
11.9% more than 14 days of poor mental health in
13.9%
12.7% 12.4% the past month. This is an increase of 2.7%
from 2018 and is 1.6% higher than the state
average. .
2017 2018 2019
Source: Washington State Department of Health, 2019
29The Washington State Department of
Percent of adults diagnosed
Health reported that in 2019, 26.6% of the
with depression
adults in the CPAA were diagnosed with
depression. Not only is this 2.1% higher Cascade Pacific Action Alliance Washington
than the state average but is also a 1.8% 26.6%
increase from the rate observed in 2018.
24.8%
24.2%
24.5%
24.0%
23.6%
2017 2018 2019
Source: Washington State Department of Health, 2019
According to County Health Rankings,
Suicide rate per 100,000 suicide rates in Pacific County are higher
population than the state benchmarks and almost
double the national benchmarks.
90th
11
Percentile
Washington 16
Pacific County 20
Source: County Health Rankings, 2021
Metric: Number of deaths due to suicide per 100,000
population (age-adjusted).
According to Medicare.gov, there is one psychiatrist within a 25-mile radius of Ilwaco
located in Astoria, OR and three clinical psychologists also within a 25-mile radius of
Ilwaco: one in Long Beach, WA and two in Astoria, OR. This indicates that mental health
providers are relatively inaccessible for people in the service area.
30SUBSTANCE USE
Excessive drinking can be driven by several factors such as the desire to forget about
problems, have fun, to test tolerance, or to rebel. The percentage of adults reporting
excessive drinking in Pacific County is 21.0%, slightly higher than state and national
benchmarks. Excessive drinking is also related to alcohol-impaired driving deaths, which
account for 50.0% of driving deaths in Pacific County which is significantly higher than
the state and national benchmarks.
Excessive drinking Alcohol-impaired
driving deaths
90th
15.0%
Percentile 90th
11.0%
Percentile
Washington 17.0%
Washington 33.0%
Pacific County 21.0% Pacific County 50.0%
Source: County Health Rankings, 2021 Source: County Health Rankings, 2021
Metric: Percentage of adults reporting binge or heavy drinking Metric: Percentage of driving deaths with alcohol
(age-adjusted). involvement.
31The CPAA reported that 20.1% of adults used marijuana in the past 30 days. This
percentage has increased since 2018 but is lower than the state average. Drug overdose
deaths in Pacific County are higher than the state and national benchmarks.
Adults that used marijuana Drug overdose deaths
past 30 days
Cascade Pacific Action Alliance Washington
90th
11
Percentile
20.1%
17.8%
16.2%
18.5%
16.6% 16.8% Washington 16
Pacific County 17
2017 2018 2019
Source: Washington State Department of Health, 2019 Source: County Health Rankings, 2021
Metric: Number of drug poisoning deaths per 100,000
population.
According to the U.S. Department of Health & Human Services’ Substance Abuse and
Mental Health Services Administration (“SAMHSA”), there are 28 substance use and mental
health facilities within a 50 mile radius of Ilwaco. Three offer inpatient services and are
located in Long Beach, WA, Seaside, OR and Aberdeen, WA, and the remaining offer
outpatient services only. Of the three inpatient facilities, only one located in Aberdeen, WA
accepts Medicare and Medicaid . The remaining facilities accept private pay and private
insurance (Map - SAMHSA Behavioral Health Treatment Services Locator).
32PREVENTATIVE WELLNESS
Mammography screening rates in Pacific County have remained relatively stagnant
between 2019 and 2020, but recently increased to 40.0% in 2021, indicating that
preventative health-seeking behaviors are increasing but are still significantly less than
national benchmarks. The percentage of Medicare enrollees to receive the flu
vaccination has also steadily increased in Pacific County since 2019. The current
percentage of 42.0% is lower than the rate observed in Washington and nationally.
Percent of female Medicare Percent of Medicare enrollees
enrollees who who receive who receive flu vaccinations
preventative mammography
Pacific County Washington
screenings
90th Percentile
Pacific County Washington 55.0%
52.0% 53.0%
90th Percentile
49.0% 50.0% 51.0% 46.0% 47.0%
44.0%
36.0% 40.0%
37.0%
40.0%
39.0% 42.0%
30.0% 38.0% 40.0%
2019 2020 2021 2019 2020 2021
Source: County Health Rankings, 2021 Source: County Health Rankings, 2021
Metric: Percentage of female Medicare enrollees ages 65-74 Metric: Percentage of fee-for-service (FFS) Medicare
that received an annual mammography screening. enrollees that had an annual flu vaccination.
According to the Washington State Department of Health, in 2019, 75.1% of the
population in CPAA reported having a personal physician which is slightly higher than
the state average of 74.4%. This number has decreased by 2.8% since 2017. Also, the
percentage of population that reported having a checkup in the past year was in line with
the state average and has increased by 6.1% since 2017.
33Percent of adults with a Percent of adults who
personal physician received a checkup in the
past year
Cascade Pacific Action Alliance Washington
Cascade Pacific Action Alliance Washington
71.4%
77.9% 70.6%
77.2%
70.6%
75.1% 70.3%
64.5%
74.5% 74.5% 74.4%
64.4%
2017 2018 2019 2017 2018 2019
Source: Washington State Department of Health, 2019 Source: Washington State Department of Health, 2019
According to the Washington State Department of Health, 47.1% of adults in CPAA
reported receiving the flu shot in the past year which is slightly higher than the state
average of 46.6%. While higher rates of people over the age of 65 reported receiving the
pneumonia vaccination, pneumonia vaccination rates still fall below state benchmarks.
Percent of adults who Percent of people ages 65+
received a flu shot in the past who received a pnemonia
year vaccination
Cascade Pacific Action Alliance Washington Cascade Pacific Action Alliance Washington
47.1%
40.1% 79.9%
35.7% 78.9%
46.6%
43.0% 77.1%
37.1% 76.6%
74.0% 73.6%
2017 2018 2019 2017 2018 2019
Source: Washington State Department of Health, 2019 Source: Washington State Department of Health, 2019
34ADULT OBESITY AND PHYSICAL ACTIVITY
A measure of general health of the population is the rate of adult obesity in the
community. Nationally, the 90th percentile benchmark rate has hovered at about 26.0%
of the population. In Pacific County, the percentage of adults who are obese has
significantly increased over the last two years from 31.0% to 38.0%. This rate is higher
than Washington, where the obesity rate has remained steady between 28.0% and 29.0%.
Similarly, the percentage of adults over 20 reporting no physical activity in Pacific
County has slightly increased to 26.0% for the past year, 7.0% higher than state and 10%
higher than the national benchmarks.
Percent of adults who are Percent of adults who are
obese physically inactive
Pacific County Washington Pacific County Washington
90th Percentile 90th Percentile
38.0%
31.0% 34.0% 25.0% 26.0%
29.0% 23.0%
28.0% 28.0%
19.0% 20.0% 19.0%
26.0% 26.0% 26.0%
16.0% 17.0% 16.0%
2019 2020 2021 2019 2020 2021
Source: County Health Rankings, 2021 Source: County Health Rankings, 2021
Metric: Percentage of the adult population (age 20 and older) Metric: Percentage of adults age 20 and over reporting no
that reports a body mass index (BMI) greater than or equal to leisure-time physical activity.
30 kg/m2.
Chronic Diseases
Another indication of health in the community is measuring the prevalence of chronic
illnesses in comparison to state benchmarks. According to the Washington State
Department of Health, in 2019 the percentage of the population in the CPAA that was
diagnosed with a chronic illness was higher than what was reported statewide.
According to the Centers for Disease Control and Prevention (“CDC”), chronic diseases
such as heart disease, cancer, and diabetes are the leading causes of death and disability
in the United States. Tobacco use, poor nutrition, lack of physical activity and excessive
alcohol use are some of the contributing causes of chronic diseases.
As seen below, the rate of chronic disease, including arthritis COPD, heart disease, and
diabetes, as well as arthritis and cancer in the CPAA is higher than the state.
35Percentage of adults with Percentage of adults with
arthritis asthma
Cascade Pacific Action Alliance Washington Cascade Pacific Action Alliance Washington
31.1% 30.6%
28.5% 11.7%
9.7% 9.7%
10.7%
10.0%
22.5% 22.7% 22.7% 9.4%
2017 2018 2019 2017 2018 2019
Source: Washington State Department of Health, 2019 Source: Washington State Department of Health, 2019
Percentage of adults with Percentage of adults with
COPD coronary heart disease
Cascade Pacific Action Alliance Washington Cascade Pacific Action Alliance Washington
8.7%
8.3%
7.8%
6.7% 6.7%
6.2%
5.4%
4.7% 4.8% 5.0% 5.0% 4.8%
2017 2018 2019 2017 2018 2019
Source: Washington State Department of Health, 2019 Source: Washington State Department of Health, 2019
36Percentage of adults with People 13+ living with HIV per
diabetes 100,000
Pacific County Washington Pacific County Washington
90th Percentile 90th Percentile
208 209 215
25%
21% 179 171 159
18%
15%
11% 12%
9% 10%
7%
49 41 50
2019 2020 2021 2019 2020 2021
Source: County Health Rankings, 2021 Source: County Health Ranking, 2021
Metric: Percentage of adults aged 20 and above with Metric: Number of people aged 13 years and older living with
diagnosed diabetes. a diagnosis of human immunodeficiency virus (HIV) infection
per 100,000 population.
Percentage of adults Percentage of adults smoking
diagnosed with cancer
Pacific County Washington
Cascade Pacific Action Alliance Washington 90th Percentile
19%
14.5% 14.0% 13.9% 15% 15%
16%
14% 14%
11.1% 11.1% 11.0% 14%
13%
12%
2017 2018 2019 2019 2020 2021
Source: Washington State Department of Health, 2019 Source: County Health Rankings, 2021
Metric: Percentage of adults who are current smokers.
37Accessibility of Care Indicators
INSURANCE
Individuals without health insurance often
Percent of population without
forego care due to high costs, which can
health insurance
lead to a higher prevalence of chronic
disease and poorer health outcomes. The Pacific County Washington
uninsured rate in Pacific County has 90th Percentile
increased over the last two years to 13.0%,
which is higher than Washington’s 13.0%
benchmark and almost double the national 11.0% 11.0%
benchmark of 7.0%. 9.0% 9.0%
8.0%
7.0%
6.0% 6.0%
2019 2020 2021
Source: County Health Rankings, 2021
Metric: Percentage of population under age 65 without
health insurance.
PREVENTABLE HOSPITAL STAYS
Hospitalization for conditions treatable in an
Rate of preventable hospital
outpatient setting suggests that patients
stays
might not be seeking necessary preventive
care, or that primary and preventative care Pacific County Washington
services are inaccessible to patients. The 90th Percentile
rate of preventable hospital stays for Pacific
3,402
County declined from 3,402 per 100,000 2,470 2,875
Medicare enrollees in 2019 to 2,875 per 2,914 2,969 2,853
100,000 in 2021.
2,765 2,761
2,565
2019 2020 2021
Source: County Health Rankings, 2021
Metric: Rate of hospital stays for ambulatory care-sensitive
conditions per 100,000 Medicare enrollees.
38You can also read