Community Safety, Violence Vulnerability and Exploitation Strategy 2018 2020
←
→
Page content transcription
If your browser does not render page correctly, please read the page content below
Community Safety,
Violence Vulnerability and
  Exploitation Strategy

       2018 – 2020
Contents
1. Foreword .................................................................................... 2
2. Introduction ............................................................................... 3
3. Strategic Analysis and Objectives ........................................ 10
  Key Findings from the Strategic Assessment .............................. 12
  Fear of Crime ............................................................................... 13
  Strategic Objectives ..................................................................... 16
4. High Volume Crime ................................................................. 18
  Burglary ....................................................................................... 18
  Non-Domestic Violence with Injury .............................................. 20
  Anti-social Behaviour ................................................................... 22
  Motor Vehicle Crime .................................................................... 27
5. High Harm Crime ..................................................................... 29
  Youth Violence Weapon Based Crime ........................................ 31
  Modern Slavery............................................................................ 43
  Domestic and Sexual Abuse........................................................ 50
6. Delivering the Strategy ........................................................... 62

                                                                                                   1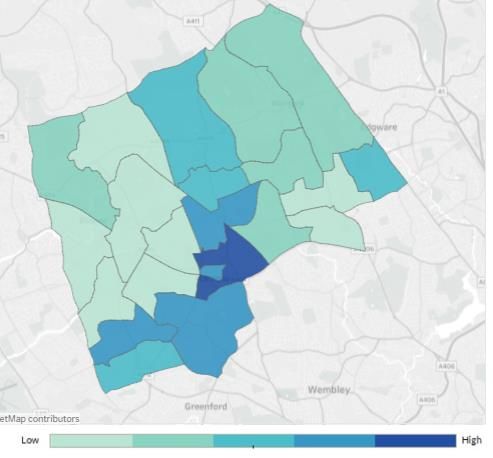
1. Foreword

This will be developed in consultation with the new Portfolio Holder.

                                                                       Councillor XXXXX
                                               Portfolio Holder, XXXXXXXXXXXXXXXXXX
                                                                      Chair, Safer Harrow

                                                                                        2
2. Introduction

Harrow’s Community Safety Partnership, Safer Harrow, brings together many
organisations that contribute to our ambition of making Harrow the Safest Borough in
London. The Council’s vision is also “working together to make a difference for Harrow”
and this is particularly relevant to the work of Safer Harrow, which as a Partnership is
working together to achieve better and safer outcomes for people who live, work, visit and
study in the borough.

Since the publication of our first Community Safety and Violence, Vulnerability and
Exploitation Strategy last year, we have made some excellent progress against the
priorities which will be explored further in this document. However, we recognise the
importance of continued partnership working to address the rising crime (especially
violent) in the capital including Harrow.

We recognise that many of our priorities connect with those of other multi-agency strategic
partnerships in Harrow such as the Harrow Safeguarding Children Board, Harrow
Safeguarding Adults Board and the Health and Well-being Board, and we are working with
these groups to take forward their priorities.

The Partnership, taking the strategic lead on each agenda, will of course vary according to
its statutory obligations, but by collaborating on relevant topics, the partnership can be
more effective by supporting each other’s objectives. This means for example, that key
messages can reach a wider audience and Safer Harrow can influence the direction of
many more local initiatives through several lines of coordinated activity across the
community. For example the topic of Harrow’s Safeguarding Children’s Boards (HSCB)
next annual conference in 2019 is expected to be Trafficking and Modern Day
Slavery. This will clearly overlap with the priorities for the Safeguarding Adult Board and
the Safer Harrow Partnership.

The Mayor's Office for Policing and Crime’s Police and Crime Plan

The Mayor's Office for Policing and Crime’s Police
and Crime Plan (PCP) was launched in February
2017. As a result, each London Borough has

                                                                                              3
selected two local volume crime priorities, based on local knowledge, crime data and
police intelligence, along with antisocial behaviour, which has been identified by the
Mayor's Office for Policing and Crime (MOPAC) as an important issue in every Borough.
The priorities for all Boroughs will also include mandatory high-harm crimes: sexual
violence, domestic abuse, child sexual exploitation, weapon-based crime and hate crime.
This new approach is designed to ensure that police, councils, and other strategic partners
are focused on the issues of greatest concern in their areas and that serious, high-harm,
high vulnerability crimes that are a priority for the whole city are not overlooked.
The themes in the Mayor’s Police and Crime Plan 2017-21 are:
Neighbourhood Policing
Keeping Children and Young People Safe
Tackling Violence Against Women and Girls
Criminal Justice that Works for London
Hate Crime
Modern Slavery
This Community Safety and Violence, Vulnerability and Exploitation (VVE) Strategy sets
out the Council’s vision for tackling community safety in Harrow and takes into account the
findings from our Strategic Assessment 2018 and builds on the changes we made last
year when we changed the focus to high harm crime. Our local High Volume crime
priorities were agreed through engagement with partners including the Police, Harrow
Youth Parliament and Young Harrow Foundation.
Given that there is now a new strategic approach from the Mayor to policing and crime,
there are clear synergies with the VVE agenda in general and also with domestic and
sexual violence under the ‘Tackling Violence Against Women and Girls’ theme.
4
Looking Ahead
The Metropolitan Police Service has recently announced changes to the way local policing
is delivered in London through the introduction of new Basic Command Units (BCUs).
Harrow police services will merge with those in Barnet and Brent to form the North West
BCU, which is expected to go live in November 2018. The move will combine core policing
functions of neighbourhoods, emergency response, CID and safeguarding. There are local
concerns about how this new model will impact on police resources in the borough. . More
than 300 people have signed a petition to the Mayor London for the tri-borough merger to
be blocked. The merger of Borough Commands and policing numbers generally are some
of the top issues that have been raised with the London Assembly Member for Brent &
Harrow.

The new BCU also offers opportunity to explore more joined up and cross borough
working arrangements. For example, there may be an opportunity to explore a cross
borough Safer Partnership identifying and working on cross cutting strategic objectives.

                                                                                           5
Our Harrow, Our Community

Harrow prides itself in being one of the most ethnically and religiously diverse borough in
the country with people of many different backgrounds and life experiences living side by
side. It is the richness of this diversity, and the positive impact that it has on the borough
                                                 and our community, that we believe helps
                                                 make Harrow such a great place to live,
                                                 work and visit.

                                                 Harrow’s resident population is estimated to
                                                 be 248,750. 49.9% of the population are
                                                 male and 51.1% are female.1 20.6% of
                                                 Harrow’s residents are under 16. 52% of
                                                 Harrow’s population are of working age (16
                                                 to 64) and 15.2% of Harrow’s residents are
                                                 65 or older.2 The average (median) age is
                                                 37.4 years, lower than many other places.3
                                                 69.1% of residents classify themselves as
belonging to a minority ethnic group and the White British group forms the remaining
30.9% of the population, (down from 50% in 2001). The ‘Asian/Asian British: Indian’ group
form 26.4% of the population. 11.3% are ‘Other Asian’, reflecting Harrow’s sizeable Sri
Lankan community, whilst 8.2% of residents are ‘White Other’, up from 4.5% in 2001.
Harrow had the third highest level of religious diversity of the 348 local authorities in
England or Wales. The borough had the highest proportion of Hindus, Jains and members
of the Unification Church, the second highest figures for Zoroastrianism and was 6 th for
Judaism. 37% of the population are Christian, the 5th lowest figure in the country. Muslims
accounted for 12.5% of the population.4

Harrow’s Children and Young People
Approximately 57,300 Children and Young People (CYP) under the age of 18 years live in
Harrow. This is 23% of the total population in the area.

1
  ONS, 2016 Mid-Year Estimates
2
  ONS, 2016 Mid-Year Estimates
3
  ONS, 2016 Mid-Year Estimates
4
  ONS, 2011 Census, Table KS209EW
                                                                                                 6
87% of the school population is classified as belonging to an ethnic group other than
White British. The top five most recorded community languages spoken in the borough are
English, Gujarati, Tamil, Romanian and Arabic.
The Income Deprivation Affecting Children Index (IDACI) shows that 16.24% of children in
Harrow are living with families that are income deprived. A higher proportion of children
living in poverty are in Wealdstone and the south west area of the borough, but there are
also 8 lower super-output areas (LSOA) which are in the bottom 20% nationally for income
deprivation affecting children, spread across the borough.
The proportion of children entitled to free school meals:
• in primary schools is 8% (the national average is 14%).
• in secondary schools is 12% (the national average is 13%).
The proportion of CYP with English as an additional language (EAL):
• in primary schools is 66% (the national average is 21%).
• in secondary schools is 60% (the national average is 16%).
The number of pupils with Special Educational Needs and Disabilities (SEND) in Harrow
has increased from 4,203 in January 2017 to 4,688 in January 2018; representing a
percentage increase of 11.5%. The highest category of primary need is speech,
language and communication needs followed by moderate learning difficulties.
Employment and Income (Economic)
Harrow has seen a reduction in unemployment and the number of long term unemployed
claimants. However, a number of residents are in low paid jobs and have low functional
skills. Harrow’s ranking for health deprivation has improved and is better than the national
average, but there are health disparities within the borough.
The Job Seekers Allowance (JSA) claimant court in January 2018 showed 1.1% (1,805
residents) were claiming job seekers allowance, of which 55% were men and 46% were
women. The overall employment rate in Harrow is 76.5%, but rates vary by population
group.5 The employment rate for white UK born residents is 82.9%, compared to 88.5% for
5
ONS Annual Population Survey, October 2016 to September 2017
7white non-UK born residents. For UK born ethnic minority groups, the employment rate is
68.4% and 69.4% for non-UK born ethnic minority groups.6
The employment deprivation domain within the 2015 Index of Multiple Deprivation (IMD)
indicates 12,082 of Harrow’s residents experiencing employment deprivation. This
includes people who would like to work but are unable to do so due to unemployment,
sickness or disability, or caring responsibilities. Overall Wealdstone is Harrow’s most
deprived ward for employment deprivation, closely followed by Roxbourne. Unemployment
figures are highest in Greenhill, Wealdstone and Roxbourne wards.
In Greenhill and Wealdstone there are proportionately more followers of Islam in the
Opportunity Area, and slightly lower Hindus. There is a higher proportion of Bangladeshi
and Pakistanis in these wards. Those ethnic groups have high levels of residents aged 16-
64 who are economically inactive (35.4%) compared to Indians (14.7%). 7
Income deprivation
The Income Deprivation scale indicates that 30,733 of Harrow’s residents are
experiencing income deprivation. Wealdstone is Harrow’s most deprived ward for income
deprivation and for income deprivation affecting children, closely followed by Roxbourne,
then Marlborough and Harrow Weald.
Over a fifth of Harrow’s residents are in low paid jobs. In part this relates to the business
composition of the borough, with small businesses paying less than larger companies and
in part due to a significant number of residents having low skills.
Skills
Within Harrow, the highest proportions of the population without qualifications or with low
level qualifications are in Kenton East, Egware, Roxbourne and Roxeth. Poor language
skills are seen as a major barrier to progressing in the workplace.
Harrow was one of 25 local authority areas identified by the Ministry of Housing for
Communities and Local Government as an area with high levels of need for English
Language provision. 28.5% of Harrow’s residents have a foreign first language. In 15.9%
of households, English is not the main language of any household occupants, the 10th
6
The employment rate is the number of people in employment expressed as a percentage of all people of that cohort aged 16-64,
ONS Annual Population Survey (APS), October 2016 to September 2017. The APS is a sample survey and confidence
intervals vary for the different groups.
7
ONS Annual Population Survey, October 2015 to September 2016
8highest ranking nationally and much higher than the national level of 4.3%. The 2011
census showed 1% of Harrow residents unable to speak English at all, compared to 0.6%
for London and a national figure of 0.3%.
93. Strategic Analysis and Objectives
In refreshing this strategy, we have looked at and analysed a host of data and considered
the findings and recommendations from a number of documents. These include the
Locality Review, needs analysis conducted by Young Harrow Foundation and our latest
Strategic Assessment.
Quick Facts:
Change in the overall level of crime
2017: 13,892 recorded crimes
In Harrow, a total of 13,892 crimes were recorded 56 per 1,000 population
during 2017, which was 1.69% of all crime reported
2016: 13,162 recorded crimes
in Greater London. This was the sixth lowest of 53 per 1,000 population
actual crimes reported. When this total is divided by
In 2017 Harrow had the
Harrow’s population, the resulting crime rate is 56
lowest crime rate in London
crimes per 1,000 population, giving Harrow the
lowest crime rate in London.
The total number of all crimes in Harrow in 2017 increased by 5.54%, compared to 2016
(13,162 to 13,892). This is lower than Greater London’s 7.47% increase as a whole.
Level of crime by crime type: Harrow (2017)
The crime types with the highest number of offences in 2017 are violence against the
person and Theft and Handling.
Harrow Wards:
2016 2017
Total crime levels Total crime levels
highest: highest:
Greenhill, Greenhill,
Marlborough, Roxbourne,
Roxeth Marlborough
Total crime levels Total crime levels
lowest: lowest:
Pinner South, Pinner South,
Headstone North, Headstone North,
West Harrow Kenton East
10Harrow’s neighbouring boroughs:
When comparing to Harrow’s neighbouring boroughs; All have seen an increase in crime
from 2016-2017.
total 2016 2017 Rate
8
offences Offence Rat Offence Rate Change
Barnet s
25,722 e
66.62 s
26,914 1000
69.71 3.09
1000100
Brent 27,681 84.33 29,689 90.45
01--- 6.12
Ealing 28,039 81.70 28,222 82.23 0.53
Harrow 13,162 52.91 13,892 55.85 2.93
Hillingdon 22,760 75.25 24,716 81.71 6.47
London
761,411 86.8 818,341 93.2 6.4
Ealing has shown the lowest increase and a lower increase than Harrow’s. Both Brent and
Hillingdon showed larger increases to Harrow. Brent continues to have the highest crime
rate and Harrow’s the lowest of the group. Harrow’s rate change is in the lower quartile
when compared to the rest of London
8
Rate per 1,000 population
11The Strategic Assessment is an annual review of
the patterns of crime and anti-social behaviour, fulfilling
partnership responsibility under sections 5,6, and 7 of the
Key Findings Crime and Disorder Act 1998 to conduct an annual review
of the levels and patterns of crime and disorder in Harrow
from the Strategic & Greater London
Assessment
Overall crime levels in London are increasing
Crime in Harrow increased in 2017 compared to 2016 but
Harrow continues to have the lowest crime rate in London
Although burglary rates are increasing, Harrow
benchmarks well in relation to these increases and the rate
of artifice burglary amongst nearest neighbours.
Artifice Burglary maybe an emerging threat as from a low baseline offences are rising
in Harrow and bordering neighbours
Fear of crime in Harrow is reducing in areas associated with increasing levels of crime
Towards the end of 2017 there has been decline in some elements of resident
confidence in policing, however Harrow benchmarks well for Police reliability and
treating people fairly
Good performance in relation to Anti-social behaviour although there are hotspots
where levels remain relatively high.
The rate of non-domestic related violent crime continues to be higher in the
neighbourhoods also associated with higher levels of ambulance attendances to night
time violence and areas associated with the evening and night time economy.
Violent crime continues to rise with increases recorded in both violence with injury and
violence without injury.
The proportion of knife crime that results in injury is increasing particularly for under
25s.
Rates of gang flagged offences are low but resident concern is rising.
Slight reduction in the level of domestic abuse in Harrow, however domestic abuse
with injury, repeat victims and the proportion of the victims who are women is rising.
Drug crime may be an emerging risk as Harrow’s relatively lower levels are rising,
while neighbouring boroughs are showing significant reductions.
Significant increases in Faith Hate crime.
12Fear of Crime
Borough wide fear of crime performance information sourced from the Metropolitan Police
Service Public Attitude Survey (PAS)9 is broken down into three separate neighbourhoods
which are:
Harrow Central
Harrow East
Harrow West
50
% of residents worried about crime in their area
45
40
Harrow_Central
35 Harrow_East
30 Harrow_West
25
Q1 Q2 Q3 Q4 Q1 Q2 Q3
2016/17 2017/18
The above chart shows that the fear of crime is highest in Harrow East and rising in both
Harrow East and Harrow Central. The percentage of residents worried about crime in
Harrow West has been declining since Q1 2016/17, even though in recent months the rate
of crime in the area has increased (94 rate per 1000 of total notifiable offences10 in Q2 to
109 in Q3).
The recent events and rise in crime has also had an impact on the fear amongst residents
and young people. This was highlighted by members of the Youth Parliament who had
been approached by their constituents raising their concerns and fears. Residents have
also been raising their fears regarding this through local media including social media. We
will aim to address these concerns working collaboratively with partners and members of
the Youth parliament and where appropriately, directly with resident groups via this
strategy.
9
https://maps.london.gov.uk/NCC/
10
Total Notifiable Offences is the count of all offences which are statutory notifiable to the Home Offices as per the
Home office Counting Rules, with rates calculated using 2014 GLA Population projections
13Designing out Crime
One of the key objectives for the Council’s regeneration programme, Building a Better
Harrow is to encourage good design principles to ‘design out crime’ and ultimately foster
safer communities. Addressing issues such as anti-social behaviour is at the forefront of
the design process and includes on-going engagement with the Police and Secure by
design consultants. Examples include:
1. The proposed new Civic Centre scheme in Wealdstone will drastically change the
character and use of the block, with over 700 people expected to be on site during
day hours. The public realm strategy follows the principle of delivering ‘civic
streets’: high quality movement routes that remove visual barriers and create a
vibrant and permeable site with a particular focus on improving provision for
pedestrians and cyclists. In evening hours, the building will be part-operational with
evening community uses and council meetings, projecting light and a sense of
activity. A comprehensive lighting scheme will improve light levels throughout the
public realm. There will also be 24-hour on-site security.
2. General good practice has been adopted across the Poets’ Corner masterplan. The
scheme is a high quality residential-led development that aims to create a safe and
secure environment, increase tenant satisfaction and occupancy, reduce
maintenance and crime. Specific benefits include the creation of new public realm:
a new civic square and route to station with pedestrian and cycle priority. The public
realm is well overlooked with good natural surveillance to reduce crime and anti-
social behaviour and includes improved lighting.
3. The Byron Quarter development proposal is helping to design out crime by
increasing eyes on the park from both new residential and leisure buildings;
ensuring the park is well-lit and overlooked; improving the arrangement of park-
front buildings to ensure there are no dark-alleyways; attracting more visitors to the
park and leisure facilities; and providing secure cycle parking.
14Community Confidence in Police and Council
The chart below shows that there has been a downward trend in confidence since or
before September (Q2) 2017.
80% know how to contact your
SNT/ Ward officer
70% Listen to the concerns
60%
Dealing with the things that
50% matter
Local information provision
40%
Police can be relied upon
30%
20% Treat everyone fairly
Mar-16 Jun-16 Sep-16 Dec-16 Mar-17 Jun-17 Sep-17 Dec-17
Harrow residents are the most confident about the police treating everyone fairly and
police reliability. Harrow residents are least confident about knowing how to contact their
SNT / Ward officer, with similar levels in Harrow’s neighbouring boroughs.
15Strategic Objectives
Police & Crime Plan (PCP): Harrow’s Local Priorities
The Mayor's Office for Policing and Crime’s PCP was launched in February 2017. Each
London Borough has selected two local volume crime priorities, based on local
knowledge, crime data and police intelligence, along with antisocial behaviour, which has
been identified by the Mayor's Office for Policing and Crime (MOPAC) as an important
issue in every Borough. The priorities for all Boroughs will also include mandatory high-
harm crimes: sexual violence, domestic abuse, child sexual exploitation, weapon-based
crime and hate crime.
Mandatory high harm Mandatory high
crimes volume crimes Local Volume Priorities
Sexual violence, Burglary
Domestic abuse, CSE,
ASB
Weapon based crime, Non domestic violence with injury
Hate crime.
Motor Vehicle Crime
High Volume Crimes
Burglary – To reduce the number of burglaries and fear of crime in the borough and
increase public confidence in the police
Non-domestic violence with injury – To reduce the number of incidents of grievous
bodily harm and actual bodily harm
Anti-social behaviour (ASB) – To reduce the number of anti-social behaviour
incidents that occur in the borough and ensure victims get the support they need.
Motor Vehicle Crime –
o To reduce the number of thefts of a vehicle that occur in the borough and ensure
victims get the support they need.
o To reduce the number of thefts from a vehicle that occur in the borough and
ensure victims get the support they need.
High Harm Crime Priorities
Youth violence, weapon based crime, vulnerability and exploitation.
16o (a)To reduce the number of young people involved in youth violence and gang
crime and to decrease the number of young people carrying offensive
weapons (guns and knives)
o (b) To embed a cultural shift within the schools on the issues of sexual assault,
child sexual exploitation and digital exploitation, and to promote a culture of
awareness of child sexual exploitation
Domestic and sexual abuse – To provide critical support to the most vulnerable
members of our community who are affected by domestic and sexual violence and
female genital mutilation with a focus on the following:
o Prevention / Education
o Policing and enforcement
o Support and recovery
Drug and alcohol misuse –
o (a)To reduce the number of young people involved in the supply of illegal
substances and to build resilience in young people so that they are able to spot
the signs of dealer grooming;
o (b) To reduce alcohol and drug-related reoffending via targeted early support
and treatment for ex-prisoners
Extremism and hate crime – To prevent young people from being drawn into
terrorism; and to improve hate crime reporting rates.
174. High Volume Crime
The following crimes will be prioritised following a significant increase in these areas and
in agreement with the Mayor’s Office for Policing and Crime (MOPAC):
Burglary Quick Facts
2017: 2,043 recorded
Key Findings from Strategic Analysis burglaries, 8.21 per 1,000 pop
Burglary includes the theft, or attempted theft, from a 2016: 1,995 recorded
burglaries, 8.02 per 1,000 pop
residential building or business/community premises where
access is not authorised. Damage to a building/premises Lowest rate increase amongst
Nearest Neighbour group
that appears to have been caused by a person attempting to
enter to commit a burglary, is also counted as burglary.
Lowest rate increase amongst
Nearest Neighbour group
Between 2016 and 2017, the number of recorded burglaries in Harrow increased by 48.
There were a total of 2,043 offences during 2017, and 1,995 in 2016. This translates to a
0.19 rate increase.
The highest levels of burglaries occurred in Harrow Weald, Canons and Belmont, with the
highest increases in Greenhill and Canons wards. The increase in Canons was largely
residential burglaries, whereas Greenhill saw a significant increase in Business &
Community burglaries (26 in 2016 to 58 2017). Across Harrow, the proportion of Business
& Community burglary in 2017 reduced from 18.9% in 2016 to 17.9%. Wards with the
largest reductions were Headstone South, Kenton East and Roxeth.
When comparing Harrow’s nearest neighbours, Ealing has the lowest rate of burglary in
both 2016 and 2017, and at 0.19 Harrow has the lowest rate change of the group. Barnet
has the highest rate of burglary in both 2016 and 2017 and Hillingdon has the highest rate
of change of the group.
18Artifice burglary is a type of burglary where a
Quick Facts: falsehood, trick or distraction is used on an occupant
2017: 33 recorded artifice of a dwelling to gain, or try to gain, access to the
burglaries, 0.13 per 1,000 pop premises in order to commit burglary. In 2017 there
2016: 11 recorded artifice were 33 recorded burglaries, 0.13 per 1,000
burglaries, 0.04 per 1,000 pop
population compared to 11 burglaries in 2016, which
One of the highest rate increases was 0.04 per 1000 population. This is one the highest
in neighbouring group
rate increases in the neighbouring group.
Objective: To reduce the number of burglaries and fear of crime in the borough and
increase public confidence in the police
Our Progress So Far
1 ‘Be Safe’ programme (previously known as ‘Autumn Nights’The
engagement and preventative work on burglary is ongoing in the background.
This includes the ongoing roll out of Met Trace (smart water), cocooning after an
report of burglary, preventative advice on securing property in the hours of
darkness and locking away valuables such as gold jewellery (particularly at
festival time).
2 Harrow Safeguarding Adults Board (HSAB) identified a priority to tackle scams,
door step crime and distraction burglary which relate to older and vulnerable
people. HSAB promoted the Home Office / Metropolitan Police “little book of big
scams” and the National Trading Standard / Police “watch out for scams”
publications as widely in the borough as possible.
Going Forward
The Council works in partnership with the Police and other partner agencies on various
initiatives and programmes to reduce the number of burglaries and increase confidence in
the police.
The Police will continue preventative work on burglary. The current themes as we head
towards the summer are ensuring residents secure their properties when they are on
holiday, in hotter weather if windows are open ensuring they are on secure catches so
cannot be opened further.
The Police will continue to engage with older, more vulnerable residents to prevent
distraction burglaries.
19Non-Domestic Violence with Injury
Key Findings from Strategic Analysis
Non domestic abuse violence with injury (Non DA VWI) includes a range of offences such
as Murder, Wounding / GBH and Assault with Injury that has not been flagged as domestic
abuse related. Since 2015, Police forces are asked to “flag” crimes, which are domestic
abuse-related if the offence meets the government definition of domestic violence and
abuse11.
Between 2016 and 2017, the number of recorded Quick Facts:
Non DA VWI offences in Harrow increased by 67. 2017: 913 Non DA VWI offences,
There were a total of 913 offences during 2017, 3.67 per 1,000 pop
and 846 in 2016. This translates to a 0.27 rate 2016: 846 Non DA VWI offences,
increase. 3.40 per 1,000 pop
Lower quartile rate change in
London priority group
The highest proportion of Non DA VWI offences
occurred in Greenhill, Roxeth, Edgware and Harrow on the Hill. Wards with the highest
Lower quartile rate change in London
increases were Greenhill, Wealdstone, West Harrow and Roxbourne.
priority group
The largest reductions in 2017 occurred in Harrow on the Hill, Canons and Headstone
South.
All areas in the North West London group have seen an increase in the rate of Non DA
VWI over the last year. Harrow has the lowest rate of Non DA VWI in both 2016 and 2017
and Barnet has the lowest rate change of the group. Brent has the highest rate in both
2016 and 2017 and has also seen the highest rate increase.
Objective: To reduce the number of incidents of grievous bodily harm and actual bodily
harm
This is still an emerging theme with MOPAC, but in devising our strategy and
concentrating on high harm crime, non-domestic violence with injury is covered in other
sections of the strategy.
11
https://www.gov. uk/guidance/domestic-violence-and-abuse#domestic-violence-and-abuse-new-definition [maybe
copy and paste the new definition here]
20All Metropolitan Police Areas are undergoing major changes to the way they operate,
which involves Harrow merging with Brent and Barnet under a new tri-borough model.
Regardless of the change however, this will continue to be a forum of local policing
through the BCU changes and beyond.
21Anti-social Behaviour
Quick Facts:
Key Findings from Strategic Analysis 2017: 4594 ASB calls,
18.47 per 1,000 population
Anti-social behaviour covers a wide range of activity that
causes harm to an individual, to their community or to
2016: 4897 ASB calls,
their environment. This could be an action by another 19.69 per 1,000 population
person/s that leaves a person feeling alarmed, harassed
or distressed. It also includes fear of crime or concern for Second lowest rate in
public safety, public disorder or public nuisance. London
Examples of anti-social behaviour include nuisance,
rowdy or inconsiderate neighbours, vandalism, graffiti and fly-posting, street drinking.
Prostitution related activity, begging and vagrancy, fireworks misuse, inconsiderate and
inappropriate use of vehicles and environmental damage including littering, dumping of
rubbish and abandonment of vehicles.
In December 2017, antisocial behaviour
calls to the Met Police in relation to
activity in Harrow were 6.19 % lower
compared to the preceding year. The
map below also shows the scale of calls
in wards across Harrow in 2017.
Wards within the central Harrow
Neighbourhood area account for a large
proportion of ASB in Harrow, those
such as Greenhill, Wealdstone, and
Marlborough.
Edgware, Roxeth, and Canons are also hotspots. The average number of ASB calls per
month over the two year period is 390. Above average levels of ASB, over both years,
have occurred in, May, June, July and October with below average levels in January,
February, November and December
.
22500
400
300
200
JAN FEB MAR APR MAY JUN JUL AUG SEP OCT NOV DEC
The rolling year graph below shows that there has been a downward trend in the level of
ASB calls since August 2017. ASB levels have also shown a reduction since the launch of
MOPAC’s Police and Crime Plan.
The Harrow Resident Survey 2017 asked: ‘if the Council could fix one thing that’s wrong
with Harrow, what should it be?’ The top response was safety, tackling crime and ASB,
which was raised by 20% of residents. In the same survey, from a pre-defined list of
services, residents said that levels of crime and ASB were both the most important issues
to them (34% of responses) and need most improving (28% of responses) in the borough.
Objective: To reduce the numbers of anti-social behaviour incidents that occur in the
borough and ensure victims get the support specific to their needs.
Our Progress So Far
The police, local authorities and other community safety partner agencies, such as Fire &
Rescue and social housing landlords (which includes registered providers and the
Council), all have a responsibility to deal with anti-social behaviour and to help people who
are suffering from it, including resolving issues at the earliest point of an incident of ASB.
The Council’s Community Safety Unit is responsible for dealing with matters of Anti-Social
Behaviour with the exception of Council housing. The Community Safety Unit is
responsible for investigating complaints of ASB through to resolution using the appropriate
tools and powers under the Anti Social Behaviour Crime and Policing Act 2014 and
through engagement with partners. In order to enhance our partnership between the
Council and the Police, a designated Police Officer sits with the Community Safety Unit to
ensure sharing of information and a co-ordinated approach for the Borough. To ensure the
protection of the community, the team remit includes elements of violence and
vulnerability and the central focus of the team is the victim and also supporting the
community. Officers are also responsible for taking forward recommended actions outlined
23on the partnerships Risk Matrix, part of the Council’s Anti-Social Behaviour Action Group
(ASGAB), to support victims.
The Community Safety Team work with internal and external agencies to tackle
matters of violence, vulnerability and exploitation through identification, education,
disruption and enforcement. The aims are to:
Provide first line support and act as primary co-ordinators and enforcers for
matters of ASB, crime and disorder in the Borough in partnership with
other Council partners and external agencies;
Take the recommended action outlined on the Partnership Matrix to
support the victim(s) as well as the appropriate course of action to tackle
the perpetrator(s)
Investigate all ASB complaints to resolution using the appropriate tools and
powers and through engagement with partners, with the exception of
Council housing where the same process is followed for council tenants
and leaseholders via the Housing service. This includes the organisation
of a series of meetings that are governed by set protocols that ultimately
report to the Safer Harrow Board and the Home Office where necessary
Provide proactive reassurance and support in relation to ASB issues, to
those who live, work and visit Harrow in partnership with relevant agencies
Work closely with other Councils to share best practice in combatting crime
and disorder, in line with Home Office guidance
Support and protect vulnerable victims and manage risk in accordance to
them, working closely with safeguarding units
The Council works closely with the police in this area and delivers a 24/7/365 CCTV
service. This has worked well and includes utilising direct video and radio links. The
good work of the team has been recognised at a local and regional level.
Over recent months a MOPAC-led taskforce has been exploring opportunities to
secure sustainable CCTV provision in London. This is in recognition of the challenging
financial climate faced by local authorities, which are the primary funders of public
space community safety CCTV. Harrow Council is one of the sites that the taskforce
visited. The findings from the work of the taskforce will inform future approaches to
CCTV.
24Going Forward
Harrow Council will increase its co-operation with schools in order to further develop
the comprehensive awareness for students and other young people regarding the
impact of engaging in anti-social behaviour and gang crime. The Council will also seek
to introduce this approach through its youth provision at as many sites as we can
throughout the borough and will place a particular focus on integrating into the offer
which young people receive from youth centres
Intervention and prevention at schools: dedicated Schools Officers will continue to
raise awareness in relation to the misuse of fireworks and ‘trick or treating’ and
highlight the consequences of offences. Following on from this the police will maintain
a list of bail/curfew restrictions and carry out truancy patrols.
The Council will ensure that young people including the Youth Parliament and Young
Harrow Foundation are involved in programmes to raise awareness about the negative
impacts of crime and anti-social behaviour in order to try and deter their participation in
such activity.
The Council will seek to work alongside voluntary sector partners whose activities
involves addressing certain types of anti-social behaviour such as street drinking and
substance misuse.
The council will seek to extend the commissioning of a range of providers, including
Prospects who are an organisation which provide careers information and employment
support to young people to increase employability pathways, which is considered a
desistance factor.
We will continue to deliver bespoke sessions on the impact that criminal records and
convictions can have on future life chances, including any aspirations which the young
person has.
Continue to work proactively with the police and provide a 24/7/365 CCTV service.
25Services for offenders
All local authorities have a significant role to play in reducing reoffending as well as
tackling crime. This includes ensuring partners take account of the concerns of residents
and businesses and understanding the health and wider needs of offenders. A number of
partners are responsible for commissioning and providing a range of services that support
the rehabilitation of offenders. Examples include community based and residential drug
and alcohol treatment and recovery services, support with mental health needs, housing
provision and benefits, social care services, and access to training, volunteering,
education, and employment opportunities.
The Council continues to develop an effective working relationship with the National
Probation Service and the Community Rehabilitation Company through various panels,
including the Integrated Offender Management (IOM) service. The IOM panel meets on a
monthly basis providing an opportunity for the provision of intelligence sharing through a
number of partners and uses of a range of enforcement powers to take action against
offenders who choose not to engage with IOM services, and who continue to offend.
Harrow Council plays an integral role in the strategic development and operational delivery
of IOM in terms of securing partnership buy-in and resources for multi-disciplinary IOM
teams and ensuring robust governance arrangements are in place to support delivery and
ensure accountability.
26Motor Vehicle Crime
Key Findings from Strategic Analysis
Motor vehicle theft is rising in Harrow.
Quick Facts:
Theft of a motor vehicle relates to the theft or
2017: 373 theft of motor vehicle
attempted theft of a vehicle, driving without consent
offences, 1.5 per 1,000 population.
of the owner or as a passenger of a stolen vehicle.
2016: 290 theft of a motor vehicle
Between 2016 and 2017, theft of motor vehicle
offences, 1.2 per 1,000 population.
offences in Harrow have increased by 83. There
28.6% increase
were a total of 373 offences during 2017, and 290 in
(2016-2017)
2016. This translates to a 0.3 rate increase. Wards with the highest numbers of offences in
2017 are Wealdstone and Canons and the lowest are Pinner south and Hatch End
Theft from a motor vehicle is the theft of articles from a
motor vehicle, whether locked or unlocked. Between
Quick Facts:
2016 and 2017, offences in Harrow have increased by
2017: 1223 thefts from motor 136. There were total of 1,223 offences during 2017
vehicle offences, 4.9 per 1,000
and 1,087 in 2016. This translates to a 0.6 rate
population.
increase. The wards with the highest numbers of
2016: 1087 thefts from motor offences in 2017 are Harrow Weald and Greenhill, with
vehicle offences, 4.3 per 1,000
population. the lowest numbers in Stanmore Park and Headstone
South
Objectives:
To reduce the number of thefts of a vehicle that occur in the borough and
ensure victims get the support they need.
To reduce the number of thefts from a vehicle that occur in the borough and
ensure victims get the support they need.
Our progress so far:
The police have conducted intelligence led High visibility Patrols in hotspot areas in
reaction to crime trends.
Leaflets have also been produced and distributed regarding Moped thefts.
27 Number plate screw initiatives in conjunction with partners to combat theft of number
plates.
Target hardening through visits to know motor vehicle crime offenders by safer
neighbourhood teams.
Covert patrols in hotspot areas
Identification of high risk vehicles and addresses, crime prevention advice leaflets
delivered to the address.
Going forward:
The Council will work in partnership with the police and other agencies on various
initiatives and programmes to reduce the number of motor vehicle crime offences. This will
include:
Conducting environmental visual audits in high crime rate areas for theft from motor
vehicle crimes, for joined up approach to ask Why here? Why now and Why vehicles?
Increased media strategy to bring the public’s attention to high risk areas and minimise
the possibility of them becoming a victim.
Increased media in the public domain to educate the public as to what they can do to
prevent offences.
285. High Harm Crime
We will have a strong focus on the following aspects of high harm crime which reinforce
our commitment to tackle violence, vulnerability and exploitation in the borough. This also
firmly echoes the current Mayor’s priorities, and includes a renewed focus on Anti-Social
Behaviour, Youth Violence and Knife Crime.
Violence, Vulnerability and Exploitation (VVE)
In 2015 a Home Office led Ending Gang and Youth Violence Peer Review found that
Harrow is dealing with some of the highest risk young people, and recognised emerging
issues of serious youth violence vulnerability and exploitation. One of the
recommendations of the Peer Review was to develop a problem profile, which explores
the risk factors that affect violence, vulnerability and exploitation and gain an in-depth
understanding of the causes of gang membership. In identifying these issues, the
Council’s Business Intelligence Team have been working closely with the Police to explore
and track some of the most pertinent issues faced by young people in Harrow. By doing
this, we hope to reduce the number of people drawn into gang membership through early
intervention and equipping existing gang members with the support they need to exit a
disruptive pathway. This will not only safeguard younger siblings and family members who
may be on the periphery of exploitation but also help to prevent gang culture becoming
further embedded in Harrow.
Additionally, Harrow undertook a Home Office led Locality Assessment in July 2017 which
involved a one-day process for local areas as part of the national strategy to tackle gangs
and serious youth violence. It works as a broad-brush set of interviews and focus groups
with front-line practitioners to gather information, knowledge and perception whilst building
a qualitative picture of the key issues and drivers around county lines, gangs, youth
violence and vulnerability, and works as a rapid evidential assessment process that
focuses on violence and vulnerability. The Assessment gave us invaluable insight through
interviews and focus groups with front-line practitioners to gather information, building a
qualitative picture of the key issues and drivers around county lines with our neighbouring
boroughs, gangs, youth violence and vulnerability.
Several partners have a role to play in dealing with all aspects of VVE in our strategic
objectives, and as part of this, boroughs received two-year funding from MOPAC via the
29London Crime Prevention Fund (LCPF) in 2017 in order to address key priorities related to
crime reduction. Last year we worked with our voluntary and community sector (VCS) to
design a range of interventions that have been proven to be successful in the borough and
elsewhere, an update on these programmes is outlined in detail further on. By working in
partnership with the local VCS they have been able to leverage in additional funding and
resource to support this important agenda.
Violence with injury
Over the past year violence with injury has decreased in Harrow.
Violence 2016 2017
Offences Rate
with
Offences Rate Offences Rate Change Change
Injury
Barnet 75 0.19 68 0.18 -7 -0.02
Brent 85 0.26 121 0.37 36 0.11
Ealing 80 0.23 70 0.20 -10 -0.03
Harrow 56 0.23 40 0.16 -16 -0.06
Hillingdon 67 0.22 54 0.18 -13 -0.04
London 4337 0.49 4507 0.51 141 0.02
The violence with injury London average for 2017 is 135. Harrow is on the lower quartile
and has a higher reduction than any of the nearest neighbour group, the second highest in
London.
Knife crime
Knife crime includes all criminal offences committed Quick Facts:
using a knife or a bladed article as a weapon. 2017: 223 Knife crime offences,
0.90 per 1,000 population
Between 2016 and 2017, the number of Knife crime
2016: 180 Knife crime offences,
offences has risen by 43. There were a total of 223
0.72 per 1,000 population
offences during 2017, and 180 in 2016. This translates
to a 0.17 rate increase. The proportion of Knife crime
that causes injury is increasing
in Harrow
In March 2017, 20% of Harrow residents were
concerned about knife crime in their area, increasing from 12% the previous year.
Although there has been an annual increase, the graphs show that since October 2017
30there has been a drop in the level of knife crime. December 2017 is also lower (8
offences) than the same period in 2016 (12 offences). The graphs also show that while
knife crime has fallen in recent months, there has been an increase in the proportion of
knife crime that results in injury. In December 2017, 62% of knife crime was with injury
was at 62%, compared to 33% in December 2016. However, we know that in 2018 there
have been a number of incidents and this remains a clear priority.
30
25
20
15
10
5
0
Mar-16
Dec-16
Dec-17
Apr-16
May-16
Oct-16
Apr-17
May-17
Oct-17
Jan-16
Jun-16
Aug-16
Nov-16
Jan-17
Mar-17
Jun-17
Aug-17
Nov-17
Feb-16
Jul-16
Sep-16
Feb-17
Jul-17
Sep-17
Total Harrow: Knife crime (monthly
count trend)
Gun crime Quick Facts:
Gun crime includes any criminal offence committed 2017: 40 recorded offences,
with the use of a firearm. Also included are incidents 0.16 per 1,000 population
where the victim is convinced of the presence of a
2016: 56 recorded offences,
firearm, even if it is concealed, and there is evidence 0.23 per 1,000 population
of the suspect’s intention to create this impression. Lowest gun crime rate in
Both real, and fake firearms, and air weapons are nearest neighbour group
counted within this category.
Second highest reduction in
Between 2016 and 2017, the number of gun offences hasLondon
reduced by 16. There was a
total of 40 offences during 2017, and 56 in 2016. This translates to a 0.16 rate reduction.
The map below also shows the scale of offences in boroughs across London in 2017.
However, there have been several high profile gun crime incidents in the Harrow area in
May 2018, so responding to them makes it a priority.
Youth Violence Weapon Based Crime
Harrow has continued to see an increase in offences of a serious nature in relation to
young people. This has reflected an increase in the use of custodial remands and
sentences. In 16-17 a total of 9 custodial remand episodes occurred. Current data from
31April 2017 to date, shows a total of 9 remand episodes having taken place, this inevitably
means remand episodes for the forthcoming year will surpass previous year data. This is
monitored through the Youth Offending Partnership Board, to ensure all options were
considered prior to a custodial remand and only the most serious offences led to these
outcomes.
However Repeat Offending rates and First Time Entrants into the criminal justice system
demonstrate a positive trend. The number of first time entrants for the current period (Oct
16-Sep 17) shows a decrease of 25.4% on the same period in the previous year (Oct 15-
sept 16).
91 Number of First time entrants: Harrow
89 89
86 82 83
81 83 79
78 76
72
Jan 13 to Apr 14 to July 14 to Oct 14 to Jan 14 to Apr 15 to Jul 15 to Oct15 to Jan 16 - Apr 16 to Apr 15 to Jul 16 to
Dec 14 Mar 15 Jun 15 Sept 15 Dec 15 Mar 16 Jun 16 Sep 16 Dec 16 Mar 17 Mar 16 Jun 17
44.3% 46.6% Repeat reoffending rates: Harrow
44.9%
43.3% 43.3%
42.5% 44.4%
40.0% 39.4%
38.2% 31.8% 33.3%
Jul 12 to Oct 12 to Jan 13 to Apr 13 to Jul 13 to Oct 13 to Jan 14 to April 14 to Jul 14 to Jul 15 to Oct 13 to Oct 16 to
Jun 13 Sep 13 Dec 13 Mar 14 Jun 14 Sept 14 Dec 14 March 15 Jun 15 Sep 15 Sept 14 Sep 17
The Triage service continues to demonstrate a positive trend in successfully diverting
young people away from the Youth Justice System. Local analysis tracks those young
people who were subject for triage for 12 months, to see if they enter the criminal justice
system. The last quarter for 16/17 shows of the 20 young people who received Triage
intervention, only 3 went onto offend.
32Harrows current figure (Jan 16 – Mar 16) shows a figure of 38.5%, which accounts for 10
repeat offenders from a cohort of 26. This compares to 53.5% for the same period in the
previous year (Jan 15-Mar 15). This is lower than the National Average (42.1%) and
London figure (48.1%).
Youth offending and offensive weapons
Offence Category 2016 % of 2017 % of % Change
youth offs youth
offs
Possession of firearms 5 1.8% 3 1.0% -0.8%
Possession of an offensive 21 7.7% 1 0.3% -7.3%
weapon
Possession of knives and 8 2.9% 27 8.8% 5.9%
similar
Possession of other weapons 3 1.1% 12 3.9% 2.8%
The large increase in the possession of knives is owing to possession of knives being
recorded as possession of offensive weapons in 2016.
Serious Youth Crime victims
Between 2016 and 2017, the number of serious youth violence victims has risen by 40.
There was a total of 140 offences during 2017, and 100 in 2016. This translates to a 0.2
rate increase.
The graph below shows that there has been an upward trend in recorded serious youth
crime victims since 2015.
Gang Flagged offences
Between 2016 and 2017, the number of gang flagged offences has reduced by 9. There
was a total of 10 offences during 2017, and 19 in 2016. This translates to a 0.4 rate
reduction. However, despite this change in data, it is recognised where this remains an
issue in parts of the borough and remains a priority.
Concern about gangs being a problem in their area is rising in Harrow. In 2016, 5% of
residents were concerned about gangs in their area and in 2017 this rose to 12%.
33Objectives:
1. To reduce the number of young people involved in youth violence and gang crime
and to reduce the number of young people carrying offensive weapons (guns and
knives)
2. To support schools to deal more effectively with issues of sexual assault, child
sexual exploitation and digital exploitation, and to promote a culture of awareness
of child exploitation.
Progress So Far
Safer Harrow has responded to the rise in youth violence in South Harrow and
Rayners Lane, and are continuing to build on developing a Youth Offer as part of the
Councils Early Support Offer. The Youth Offer is aligned with the Youth Offending
Team and one Deputy Team Manager now oversees the work of the Out of Court
disposals (diversion from courts) and the Youth Offer, ensuring as many young people
as possible are engaged in positive activities and have an array of support available to
target support for those considered at risk.
Young Harrow Foundation, in partnership with Harrow Council and over 50 voluntary
organisations, is conducting the largest ever analysis of young people’s needs in
Harrow. This is made up of a combination of an extensive survey of young people
aged 10-19 living in Harrow; data and focus groups led by the charity sector; and a
council data review. Already we see that youth violence is a significant need in the
area across the board – with young people themselves citing it as the second highest
priority they would like support with. The final report will be available from June 26th,
after which the council and voluntary sector will be able to use the indicator of Fighting
or ASB to review what that tells us about other underlying needs and opportunities in
this population.
Ignite Project: The Council has been working with Ignite a well-known voluntary and
community organisation, with a team of experienced youth workers, to recruit a full-
time Gangs Worker for the Rayners Lane Estate and South Harrow area. The
programme is specifically aimed at working with young people connected to known
gangs in the area and those who are engaged in high levels of anti-social, violent and
criminal behaviour.
In July 2017 a full time gangs worker was recruited and the organisation was able to
34attract additional match funding to recruit a second part-time worker to work with the
full time gang’s worker on this project. The plan is to continue using this team
throughout 2018 for the project. The organisation also secured a total of £75k funding
from Lloyds over 3 years (£25k per year), and secured £840 funding for a 12 week
Youth Club pilot in Grange Farm and support staff/food and rental £720 in kind.
We have already seen 171 session taking place with young people, with 48 individual
young people engaged in positive activities and 76 mentoring sessions and 95
employment/education support sessions already delivered, which include Grange Farm
(early intervention) youth club; Basketball on Thursdays; Gym memberships.
In addition to this, 69 young people have been engaged with detached services; out of
these 51 young people have demonstrated improved self-efficacy; 32 have started
making positive choices; 28 have increased their aspirations. Further work is still being
developed to ensure that the Gangs Worker works in close partnership with the
Community Safety Team, including sharing intelligence and anecdotal insight on a
daily and frequent basis.
Series of primary schools based engagement programme aimed at raising general
awareness around crime and personal safety (for Academic year September 2017):
This has been a very successful programme. Feedback has been great from the
Primary Schools. Parents events have also been run to discuss transition from year 6
to year 7 and the pressures on children amongst other things. This was scheduled for
this academic year. It is intended that this will be delivered by the new youth
engagement team under the BCU model which launches in November, however this
cannot be guaranteed at this time as we do not know exactly what it will look like.
Schools officers’ priority will be secondary schools so whilst we aspire to continue we
will need to review in September when the position will be clearer
Secondary School – 3 schools have signed up to anti-knife crime seminars run by one
of the schools officers with assistance from HEMS, mother of a fatal stabbing victim
supported by the Ben Kinsella Trust.
The Youth Offending Team (YOT) are currently working in partnership with Prospects
whereby a workshop on the impact of having a criminal record on future life chances is
35delivered and this will be considered as part of the wider offer to schools.
Synergy: Last year we also invested in a drama
Case study programme with Synergy Theatre. Synergy have a proven
track record in working to rehabilitate ex-prisoners and
have featured in the national press for their successful work in changing the attitudes and
behaviours of participants and the audience. The production company has been working
in a select number of targeted schools where young people are at risk of entering the
criminal justice system to help them discover alternative pathways and become an integral
and meaningful part of society. Synergy have developed a ground breaking, interrelated
programme of artistic work that seeks to build a bridge from prison to social reintegration,
prevent young people from entering the criminal justice system, and inspire change by
capturing the imagination and affecting the feelings, behaviours and attitudes of
participants and public.
A screening of a film called The Thief, with question and answer sessions has also been
delivered to over 300 young people. Feedback from both schools has been positive and
students are reported to have engaged really well. The project will continue to run for
another year and will take place in a further two schools. Synergy are also exploring
opportunities to deliver ‘Blackout’ at select schools in Harrow
Unblurred Lines: This academic year two of the issues that have caused the most
anxiety in schools have been ‘unhealthy relationships’ and ‘digital exploitation’. The
MASH team, and in particular the Education Lead, are contacted frequently to discuss
concerns around these issues.
Vulnerability to sexual exploitation is a concern in high schools all year round but in the
run up to the six week holiday there is a greater anxiety and we wanted to support the
schools in educating the teenagers to keep themselves safe over the holiday and going
forward. After a presentation by Shanice Grant, Sexual Exploitation Digital Specialist,
at the Safeguarding in Education conference it became clear that primary schools are
becoming increasingly worried about the impact of mobile phones and social media on
36You can also read