Connected Commuting Research and Analysis from the New Cities Foundation Task Force in San Jose
←
→
Page content transcription
If your browser does not render page correctly, please read the page content below
Connected
 Commuting
Research and Analysis from the New Cities Foundation Task Force in San Jose

                                            Research report co-
                                              created with:
This study was commissioned and published by the New Cities Foundation. You can copy, download, or print this
report for your own use, and you can include excerpts from New Cities Foundation publications, databases, and
multimedia products in your own documents, presentations blogs, websites, and teaching materials, provided that
suitable acknowledgment of the New Cities Foundation as source and copyright owner is given. All requests for public
or commercial use and translation rights should be submitted to contact@newcitiesfoundation.org. Request for
permission to photocopy portions of this material for public or commercial use shall be addressed directly to the New
Cities Foundation.

           Please cite this publication as:

           New Cities Foundation (2012), Connected Commuting: Research and Analysis on the New Cities
           Foundation Task Force in San Jose, http://www.newcitiesfoundation.org/wp-content/uploads/
           New-Cities-Foundation-Connected-Commuting-Full-Report.pdf

The New Cities Foundation would like to thank the following individuals for their thought leadership, suggestions, and
participation in this project: Patrik Cerwall, Monika Byléhn, Nimish Radia, Geoff Hollingworth, Maria Akerlund, Marcus
Nyberg, and Kshitiz Singh, all from Ericsson. The Foundation also thanks Manuel Pineda from the San Jose Department
of Transportation; Alexandre Bayen, Joe Butler, Greg Merritt, and Joan Walker from the University of California CITRIS;
Di-Ann Eisnor, Michal Habdank-Kolaczkowski, and Fej Shmuelevitz from Waze; Scott Kolber and Ethan Arutunian from
Roadify.

All pictures (except cover) by Cristian Santibanez under Creative Commons License.

Cover picture by Flickr user Richard Masoner.
Table of Contents
Executive Summary............................................................... 4
   Main Findings and Recommendations.................................................. 6

Introduction......................................................................... 9
   New Cities Foundation Task Force on Connected Commuting.................. 11

Part I: Commuter Sentiment Analysis....................................... 14
   Summary of Key Findings.................................................................. 15

   Methodology.................................................................................. 16

   Data Analysis.................................................................................. 16

   Waze Data Set............................................................................... 17

   Roadify Data Set.............................................................................. 20

   Main Findings and Recommendations.................................................. 23

   Conclusion: Part I............................................................................. 24

Part II: Comparative Focus Groups..........................................27
   Methodology.................................................................................. 28

   Summary of Key Findings.................................................................. 29

   Detailed Learning by Type of Commuter............................................... 32

   Ideas to Improve Commuting.............................................................. 34

   Conclusion: Part II............................................................................ 35

Connected Commuting Works............................................... 37

Executive Summary
Executive Summary

Urban traffic and the difficulties of commuting are among the most intractable problems that face
cities across the world. Traffic congestion and commuting inefficiencies place a heavy strain on
urban infrastructure, increase pollution, damage the environment, and lead to loss of resources,
time and productivity. On a personal level, commuting has been identified as one of the most
unpleasant urban experiences and is often associated with very high levels of stress.

The New Cities Foundation — a non-profit organization dedicated to creating more sustainable,
dynamic, creative and just global cities — and Ericsson, the world's leading provider of
communications technology and services and a Founding Member of the Foundation, have set
up a Task Force on Connected Commuting, in partnership with the San Jose Department of
Transportation, the University of California Center for Information Technology Research in the
Interest of Society (CITRIS), and two start-up commuter-focused mobile applications, Waze and
Roadify.

This study aims to look at the potential benefits of connecting commuters to one another through
mobile phone apps. It seeks to compare experiences of connected and unconnected commuters,
and examines the kinds of information commuters share with each other. Can a new level of
networking between commuters enhance the overall commuting
experience? Is the connected commute “better” than the non-connected commute? Is it more
rewarding and less stressful? Is it shorter and potentially cheaper for the user? From a city
perspective, is it more resource efficient? Finally, what aspects of existing tools based on user-
generated data should be developed further to create more powerful positive impact for
commuters? This study is an important milestone to capture the power of data generated by
social networks.

The broader ambition of the Task Force is to develop new potential technologies, products and
services to improve commuting, and completion of this study is an important step forward.

                                                5
Executive Summary

Main findings and Recommendations
Part I: Commuter Sentiment Analysis

1. Commuter comments collected by smartphone commuter applications provide valuable high-
   quality real-time data about commuter sentiment in relation to their commutes.

2. The existence of a general platform allowing users to share feelings about their commute
   could in itself contribute to a more enjoyable commuting experience by adding a
   conversational element, which users seem to value highly.

3. Government and/or employer programs should consider conducting sentiment analysis to
   help identify and prioritize their efforts to address commuters’ frustration by time of day, day
   of week, locations and other topics of concern to commuters.

4. Trip planning applications should use historical analysis of commuter sentiment to provide
   route guidance based on positive user experiences on specific routes; these apps should also
   provide a feature that allows commuters to rate their travel experience, which can be used for
   further analysis.

5. Transportation and traffic management authorities should consider using sentiment analysis as
   a real-time, cost-effective metric for evaluating the impact of infrastructure investments. This
   method is more effective than traditional surveys.

Part II: Comparative Focus Groups

1. Public transportation commuters are different from car commuters.

  •   Commuters using public transport see themselves as knowledgeable and experienced.
      They don’t immediately see the benefit in receiving information from other commuters.

  •   Car commuters, on the other hand, are looking to connect while in the car. Their “alone
      time” creates a prime environment for connecting and sharing.

                                                 6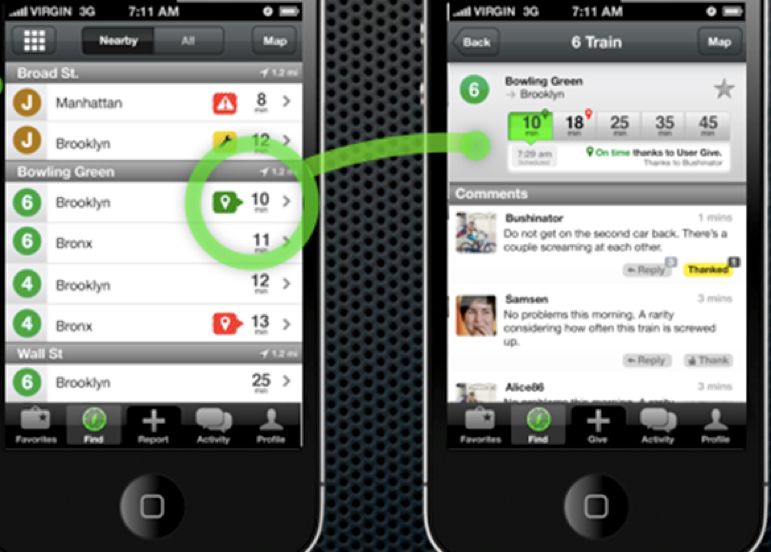
Executive Summary

2. Within the group of public transport users, connected and unconnected commuters are
   similar.

  •   Importantly, they are already connected to others physically while commuting, and this
      minimizes the need for connection through technology.

  •   Both describe themselves as “experienced” and believe they “know what they’re doing.”

  •   They use technology while planning routes, more rarely during the commute itself.

3. Within the group of car commuters there are slight differences between connected and
   unconnected commuters; in general, connected car commuters seem somewhat happier.

  •   Connected car commuters describe themselves as “happy” / “content” / “excited.” Their
      biggest complaint is that they are “busy.”

  •   Unconnected car commuters describe themselves as “neutral” to “happy.”         Their main
      complaint is “fatigue.”

4. Unlike public commuters, car commuters recognize a need for technology at both the
   planning stage and during the commute.

  •   For car commuters technology assistance is needed:

        ‣     In the planning stage: deciding the mode of transportation or route.

        ‣     Real time: re-routing around traffic and other incidents.

5. There is one key difference between connected and unconnected commuters: how they feel
   about sharing information with people they do not know while commuting.

  •   Connected commuters are very open to sharing (and receiving) information from people
      they don’t know while commuting. They appreciate receiving information, and this makes
      them more interested in “giving back” information in the future.

                                                   7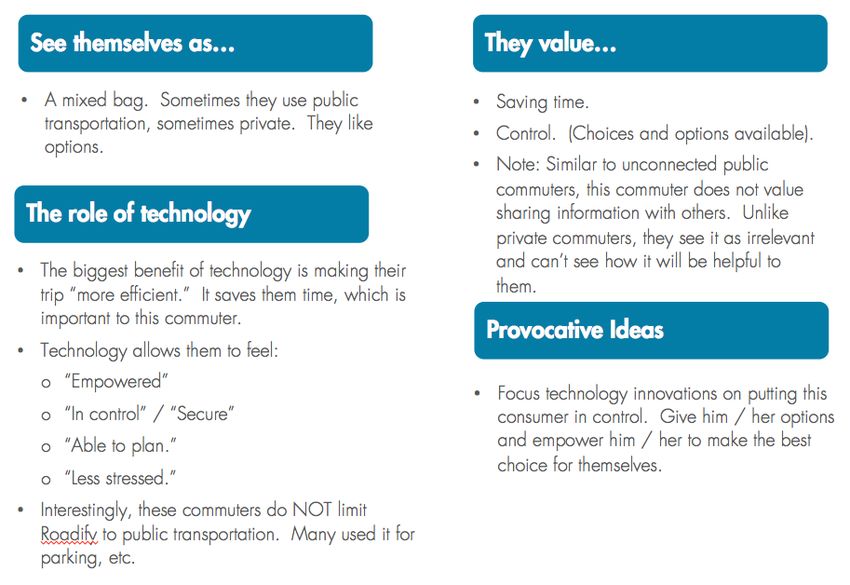
Executive Summary

  •   Unconnected commuters have mixed to negative feelings, particularly about receiving
      information from those they don’t know. They do not naturally trust crowd-sourced
      information and believe it may be wrong, or even worse, intentionally misleading.

6. Technology is integral to the future of commuting.

  •   Everyone (connected or not connected) uses technology on some level during or before
      their commute.

  •   There is a real opportunity to please commuters and enhance the commuting experience
      through future app technology.

                                                8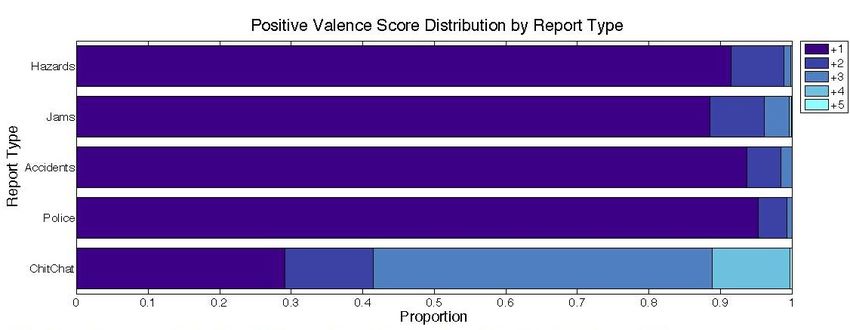
Introduction
Introduction

In every major city, the inefficiency of daily commuting has a negative impact on society, the
environment and the economy. Billions of trips to work and schools require unnecessary hours
stalled in traffic. Delays in the United States alone cost commuters an average of 34 hours a
year per commuter1, and the 2012 Ericsson City Life Report found that urban commutes
averaged nearly 2.5 hours in the 13 global cities it surveyed. This wasted time is not just an
inconvenience for commuters; wasted fuel, carbon emissions and opportunity costs mean that in
the United States traffic congestion costs over $100 billion annually2 . Globally, these costs
multiply; workers and students from Stockholm to Seoul cite daily commutes as a key cause of
stress and missed time at work3. The remarkably negative impact of traffic congestion on the
triple bottom line in developed and emerging societies alike positions it as one of the most
important challenges facing cities today.

Traffic congestion has been met with many innovative solutions globally. Road space rationing in
Brazil, car license plate quotas in China, and congestion pricing in the UK all aim to take
vehicles off the road and motivate commuters to use public transit. Despite these efforts, however,
more than 65% of urban commuters worldwide rely upon private vehicles4 ; further reductions in
this ratio, should they come, are unlikely to overcome the rapid increase in sheer volume of cars
on roads around the world. Steady increases in car ownership, especially in emerging markets,
also limit the efficacy of gradual increases in roadway capacity. In fact, increasing the number
of lanes and routes actually adds to the problem, by drawing more commuters onto the road.
These policies have experienced only limited success because they focus on altering the supply
and demand of road space, rather than rethinking the market for road space altogether.

Although governments have focused on roadway supply and demand, commuters would benefit
from a simple increase in information regarding the supply and demand that already exists. The
U.S. Department of Transportation estimates that half of all congestion is due to “non-recurring”

1
  Eisele, B. Lomax, T. and Schrank, D., 2011. 2011 Urban Mobility Report. College Station: Texas Transportation Insitute,
Texas A & M University.

2
    Ibid.

3
    Ericsson, 2012. City Life. Stockholm: Ericsson ConsumerLab

4
    IBM, 2011. Global Commuter Pain Survey: Traffic Congestion Down, Pain Way Up. Armonk: IBM

                                                                 10
Introduction
events such as accidents and road work5 – precisely the type of events that commuters cannot
predict but could incorporate into trip planning. Ericsson’s City Life Report observes that
“providing real-time traffic and transport schedule updates” would eliminate the unpredictability
of commuting and put city-dwellers at ease. In response, radio stations in Sao Paulo provide
24/7 coverage of traffic patterns and solicit commuter input for accurate updates.
Today, the ubiquity of smartphones and related technology means gathering and distributing
information to commuters can be simple and effective. The following study aims to understand the
potential advantages of smartphone technology for individual commuters. The selected pilot city
for the study was San Jose, California — relatively typical in terms of average commute times
and distances. San Jose ranks 22nd among large American cities in number of person-hours
delayed (42 million annually), and 25th in congestion cost ($842 million), suggesting that even
modest improvement could have considerable positive impact city-wide6.
New Cities Foundation Task Force
on Connected Commuting
The New Cities Foundation Task Force on Connected Commuting has taken a unique approach
to improving the daily commuter experience. The Task Force has undertaken an important first
step by looking at ways in which commuters who share the same daily route (whether by car or
public transport) can share information with one another in real time via mobile apps such as
Waze and Roadify.
Smartphones and social media platforms such as Twitter and Facebook are increasingly
integrated into daily city life, and information can therefore be transferred among individuals
more seamlessly than ever before. Waze and Roadify are two leading and widely-recognized
5
US Department of Transportation, 2006. National Strategy to Reduce Congestion on America’s Transportation Network.
Washington D.C.: US Department of Transportation
6
Eisele, B. Lomax, T. and Schrank, D., 2011. 2011 Urban Mobility Report. College Station: Texas Transportation Insitute,
Texas A & M University.
11Introduction
transportation-focused mobile apps designed to enable commuters to share real-time user-
generated travel information. Users communicate via short text messages in order to facilitate a
more efficient and enjoyable commute for others. In the case of Roadify, users can also view
route-specific comments that people have left on Twitter in relation to their commute.
The first part of the two-part Task Force study, undertaken by CITRIS, seeks to understand the
pertinence of these user-generated messages or micro-blogs, looking at how this data and its
analysis might be used to improve the commuting experience, both for individual commuters and
from a system point of view. For example, transportation agencies and local governments could
employ user-generated information that is localized and pertinent to create and exploit new
connections among relevant actors involved in coordinating and improving commuter routes —
making commutes shorter, more efficient, and generally happier.
Current trip-planning mobile applications allow users to take advantage of network maps when
planning their routes, and offer real-time information on train and bus arrival times or heavily
congested roads. Some trip-planning tools also allow users to publish comments that are shared
with other users. The most intriguing function here seems to be the social communication aspect
of these apps and how they can be effectively applied in the context of urban mobility. This
function not only allows users to share relevant information with each other, but also offers
valuable data that could ultimately help transportation agencies upgrade the way they structure
their initiatives aimed at improving and streamlining commutes.
The second part of the study was conducted through focus group interviews that compared
experiences of both private car and public transport commuters who were categorized as either
connected (defined as actively sharing and receiving information from the social networking
feature of the commuter apps) or unconnected commuters (not communicating or sharing through
the commuter apps). The goal: to discover commuter preferences, behavioral trends, and
compare overall commute experiences.
The New Cities Foundation serves as the primary coordinating body for the project. Ericsson’s
Research and ConsumerLab teams worked with the New Cities Foundation to design the project,
providing strategic guidance in articulating the central research question and in project
12Introduction
implementation. After a careful exploration of several US West Coast cities, San Jose, California
was selected as the pilot location for the project. The San Jose Department of Transportation —
the key public agency partner in the Task Force — has been instrumental in providing the traffic
and transport information necessary to understand local road conditions, and facilitated the
involvement of appropriate transportation agencies. Waze (a trip planning app focused on
drivers) and Roadify (an app for public transportation users) are the primary providers of the
anonymized user data that was used to study commuter behavior and information-sharing. The
University of California CITRIS conducted the analysis of the data.
13Part I: Commuter Sentiment Analysis
Part I:
Commuter Sentiment Analysis
Summary of Key Findings
The study discussed here is the first part of the Task Force’s broader effort to develop innovative
solutions to improve commuting. Undertaken by CITRIS, it used commuter sentiment analysis tools
to understand and improve the commuting experience.
The study’s main findings and recommendations are:
1. Commuter comments collected by smartphone applications provide valuable high-quality real-
time data about commuters’ sentiment in relation to their commutes.
2. The existence of a general platform allowing users to share their feelings about their commute
could in itself contribute to a more enjoyable commuting experience by adding a
conversational element, which users seem to value highly.
3. Government and/or employer programs should consider conducting sentiment analysis to
help identify and prioritize their efforts to address commuters’ frustration by time of day, day
of week, locations and other topics of concern to commuters.
4. Trip planning applications should use historical analysis of commuter sentiment to provide
route guidance based on positive user experiences on specific routes; these apps should also
provide a feature that allows commuters to rate their travel experience, which can be used for
further analysis.
5. Transportation and traffic management authorities should consider using sentiment analysis as
a real-time, cost-effective metric for evaluating the impact of infrastructure changes. This
method is more effective than traditional surveys.
15Part I: Commuter Sentiment Analysis
Methodology
The CITRIS team compiled a full analysis report for the Task Force upon completion of the study
(see full report here7 ). This paper summarizes the methods used during the analysis, as well as
the subsequent findings and recommendations. The primary method used was Text Sentiment
Analysis: a software program creates a reference dictionary that can recognize the emotional
connotation behind specific words and phrases. The software pre-assigns numerical values to
words frequently featured in user comments, using specific characteristics or contextual elements,
such as positivity or negativity and/or the intensity of the emotion. For example, the word
“happy” generally carries a positive sentiment, while the word “traffic” generally carries a
negative sentiment. Based on these pre-assigned values, statistical calculations determine the
overall positive or negative emotion of the body of text. The data set in this case was derived
from a feature within Waze and Roadify that allows users to publish comments and share
relevant traffic information with each other.
Data Analysis
Text sentiment analysis has previously been employed to evaluate longer texts such as consumer
product reviews or blogs and forums, to gauge public opinion on certain topics. While some text
sentiment analysis has been conducted on short texts, most notably tweets, this is one of the first
reports on sentiment relating to transportation and mobility issues.
Data produced by Waze and Roadify has the unique ability to offer first-hand insights into the
commuter experience in real-time. Compared to general forums like Twitter, which produce
overwhelming and non-topic specific pools of data, these applications provide a smaller, topic-
specific pool of data, simplifying the process of extracting and analyzing information.
7
http://www.newcitiesfoundation.org/wp-content/uploads/UCBerkeley_NCF_Report_Final.pdf
16Part I: Commuter Sentiment Analysis
Waze Data Set
Waze is a driver-focused smartphone application that provides a platform for users to report
traffic incidents with highly relevant information on specific travel routes. Real-time comments by
users can alert other drivers about local traffic conditions, such as roadblocks or accidents (see
image below). The reports are shared with Waze users who frequent the same route. For the
purpose of this analysis, Waze provided 114,256 user reports from a specific geographic area
within San Jose, California for the period of January 1, 2010 to February 29, 2012 (26
months).
!
Screen captures from the Waze app
When users submit a report, they are required to first choose a category. Those categories are:
“traffic jam,” “police,” “accident,” “hazard,” “chit chat” and “other.” The first four categories are
topic-specific. However, the “chit chat” category allows users to post comments with general
travel-related information. Users can choose whether or not to publish comments.
Of the 114,256 reports, 15,131 contained optional comments added by users, representing
approximately 13% of the original set of reports. Comments encourage users to provide more
17Part I: Commuter Sentiment Analysis
detailed and personal information regarding their commute and can therefore be more
informative than reports.
CITRIS analyzed the sentiments associated with these user comments, which were classified as
either predominantly positive or predominantly negative. The comments were then analyzed to
determine the distribution of positive and negative classification.
Based on the above information, the CITRIS report notes the following key findings:
Close to 50% of users selected “traffic jam” when making a report, followed by “police” and
“hazard,” each with 20%; 7% selected “chit chat” and 6% selected “accidents” (see figure on
left below). However, the distribution changes when users decide to publish a comment with
their report, with “chit chat” receiving 52% of comments, “traffic jam” with 17%, “hazards” with
12%, “police” with 10% and “accidents” with 5% (see figure on right below).
!
The word-cloud image displayed below captures the words most frequently used by Waze users
when selecting the “hazard” category to enter a report. A word-cloud displays words in different
font sizes as a function of how often each word is used in a given set of words; the more
frequent the occurrence of the word, the larger the font size. This word-cloud illustrates the high
degree of relevance of users’ comments with respect to the chosen category, indicating the
18Part I: Commuter Sentiment Analysis
usefulness of providing users with specific categories that address different travel-related issues.
(For more examples of word clouds by report category type, please see the full report8 )
!
Word cloud for Waze report type "hazard"
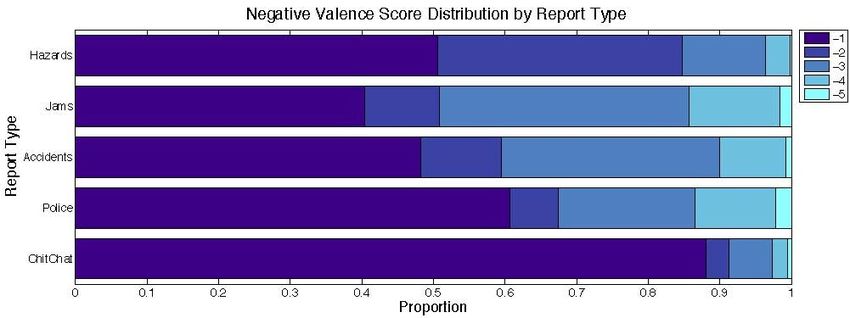
It was also determined that the distribution of positive and negative sentiment varies by report
type, with “chit chat” being relatively more positive than all other categories. However, the
degree of negative sentiment among “hazard,” “jams,” “accidents” and “police” varied
considerably. This may indicate that the social nature of the “chit chat” category (as shown in the
image above) contributes to a more enjoyable commuting experience by adding a more human
element.
This distribution is shown in the graphs below. The term “valence” is used in this context to refer
to the degree of intensity of emotion expressed in each user comment. For the graph of positive
valence, the scale ranges from 1 (no positive emotion expressed) to 5 (most intense positive
emotion expressed). For the graph of negative valence, the scale ranges from -1 (no negative
emotion expressed) to -5 (most intense negative emotion expressed).
8
http://www.newcitiesfoundation.org/wp-content/uploads/UCBerkeley_NCF_Report_Final.pdf
19Part I: Commuter Sentiment Analysis
Roadify Data Set
Roadify is a public transport focused smartphone application that provides commuters with
information about transit schedules, delays, and service alerts from official sources, while also
allowing commuters to include their own commentary about local transit conditions. These rider
comments are supplemented by filtered tweets that are relevant to users' particular route or line.
While user comments provided by Roadify did offer some data, the data set was not large
enough to be able to draw comprehensive conclusions to the same degree as the Waze data
set. This is due to the relatively recent launch of the app in the San Jose area and a low user
20Part I: Commuter Sentiment Analysis
adoption rate of the tool. However, Roadify’s data confirmed that user comments are highly
pertinent to the topic of commuting and are a good source of vocabulary needed to fine tune
text sentiment analysis software to more accurately understand commuter sentiment.
The word-cloud below illustrates the type of words Roadify users used most frequently in their
comments on the app. Again, the word-cloud reveals the high degree of relevance of user
comments to the topic of concern, indicating further that they are sharing useful information with
each other related to their commute.
!
Word cloud for Roadify comments
An additional interesting aspect of Roadify is the integration of relevant comments generated
from Twitter, a commonly used social networking and micro-blogging tool. Filtered for relevance
and fed directly into the Roadify app, Twitter data can offer further insights into the commuter
experience, and could be the basis for a future study on the impact of chatting and micro-
blogging while commuting.
21Part I: Commuter Sentiment Analysis
The image below illustrates the user commenting functionality on the Roadify app.
Screen capture of the Roadify app
Although the recommendations presented here are preliminary and should ideally be further
explored through analysis of larger data sets, the CITRIS report yields a number of interesting
conclusions that brings the Task Force closer to understanding the effects of social networking on
the overall commute experience. The following recommendations are intended to offer guidance
as the Task Force members embark on the next phase of the project. The recommendations are
therefore categorized according to the audience for which they are best suited.
22Part I: Commuter Sentiment Analysis
Main Findings and Recommendations
Recommendations for Transportation Agencies
• The study concludes that sentiment analysis is indeed a practical and
applicable tool for measuring commuters’ emotions, and recommends its use for future
analysis. This can be useful for understanding trends among commuters and how their
emotions change according to their location, the time of day, the day of the week, and
the feature or category of the app they use. For example, users might exhibit different
emotions when they comment in the “jams” and “chit chat” categories. Public agencies
should note that this type of social data can be useful to motivate users to use alternate
routes or modes of transport, and should be encouraged to embrace social data more
aggressively. For instance, services like 511.org in the U.S. currently only provide travel
information, but could go beyond this to include social network data in the future.
• Given the high prevalence of negative sentiment associated with the word “traffic” during
the evening commute, it is recommended that local programs aimed at improving
commuting focus their efforts on diminishing congestion during the evening, as opposed
to the morning, commute. It is generally recommended that programs be designed to
focus on areas that have a high prevalence of negative sentiment among users.
Additionally, future commuter services or transit tools might consider incorporating the
measure of sentiment as an additional input when relaying relevant information to
commuters. For example, in addition to providing weather-related information, commuter
services could also include commuter sentiment as an extra layer of data when
recommending an alternate travel path.
• Transportation mobile app data is recognized as a highly valuable source
of real-time information that should be used to advise transportation
agencies on problem areas where infrastructure repairs or improvements are
necessary. Sentiment analysis of this highly relevant app data could be used in a variety
23Part I: Commuter Sentiment Analysis
of situations, such as during an event at a particular location where there is an anticipated
mass gathering.
Recommendations for App Developers
• It was determined that the simple act of creating a general forum — such as the “chit
chat” category in Waze, where users can communicate in a more social manner, in
addition to sharing practical information — significantly increases the level of
positive emotion expressed by commuters. This function has great potential in
terms of facilitating a more enjoyable commute. Voice commands and other tools can
help guard against distracted driving.
• Text sentiment analysis suggests that app developers can incorporate more features to
improve users’ commuting and traveling experience. For example, because it is possible
to measure and map geolocalized frustration, commuters could be routed around these
choke points. People often use time or route length as a metric for re-routing their travel
path, but another possibility is to use social network tools to minimize frustration as a
metric for route guidance. Developers could offer a positive category for users
to choose from when publishing a report, such as “nice road,” “scenic train route,” or
“pleasant drive,” to offset the negative sentiment often associated with the category
“hazard” or “traffic jam.” This could be an effective method of improving the commute
experience through the promotion of more positive reports and comments.
Conclusion: Part I
In an age where rapid urbanization is taking place at an unprecedented scale, the commute to
and from work continually presents challenges for transportation agencies, city officials and
related actors. City officials need to manage rapid urban growth in a way that maximizes quality
of life and comfort for the city’s inhabitants. Organizing and planning transportation programs to
facilitate a smooth and enjoyable commute are key factors in pursuing this goal.
24Part I: Commuter Sentiment Analysis
Traditional solutions to the challenge of urban mobility, such as infrastructure improvements,
remain very costly, and are vulnerable to budget cuts. In addition, massive projects such as new
roads or new metro lines have long lead times from the identification of needs to project
delivery. They fail to address short term pressures posed by rapid urban growth, for example in
China and India. It is therefore imperative to seek new channels for improving the commute
experience rapidly and effectively.
The pervasive use of smartphones presents a unique opportunity to organize improvement
programs, and should be explored further by city officials and transportation agencies.
Specifically, mobile applications such as Waze and Roadify that offer topic-specific social
networking platforms are a potentially useful measurement tool that city officials and commuters
could use to facilitate a more enjoyable commute. Their crowd-sourced data, which cannot be
easily collected by automatic sensors, is highly relevant and could potentially lead to an
increased dialogue between the city and its citizens. Indeed, transportation and mobility is just
one example of the ways city management could use crowd-sourcing; public safety is another
possibility.
The Connected Commuting Task Force study was conducted to analyze existing data produced
by these mobile applications, to identify current commuter habits and experiences based on
commuters’ use of these applications. The unique feature of this study is that there has been very
little research conducted on the relationship between social networks and mobility, and
specifically how this relationship could be exploited to bolster the daily commute experience.
The Task Force report presents useful preliminary conclusions and recommendations; they will be
instrumental to organizing, planning and implementing the next stage of the project, which will
be to compare the experience of commuters who use these apps against those who do not.
Although further analysis of a more comprehensive set of data is required, the Task Force has pin-
pointed areas that should be targeted and those that need further examination. For example, the
study confirms that text sentiment analysis is indeed a useful tool for measuring commuter trends.
Future analysis could look at whether these social network platforms can affect commuter
sentiment enough to change commuters' behavior, and perhaps encourage them to use public
transportation instead of driving.
25Part I: Commuter Sentiment Analysis
The City of San Jose is in the process of building a transportation management center, due for
completion in 2013. This study's insights highlight ways in which user-generated commentary
could be a useful source of information for transportation authorities as they structure this new
department, and give city officials a new medium to directly engage with commuters for their
mutual benefit. How can city officials use the real-time information to manage traffic flows?
Could they utilize these mobile apps to communicate information to commuters? Going forward,
the task at hand will be to determine what future steps are necessary to implement such a tool
into the city system to promote an improved commuting experience.
26Part II: Comparative Focus Groups
Part II - Comparative Focus Group

The analysis of data related to commuter information-sharing provided insights into the sentiments
and behaviors of connected commuters. However, to understand whether a connected commute
provides a better commute experience, it was necessary to compare the experiences of
connected versus unconnected commuters, and to identify the specific ways in which being
connected enhances the overall journey. To do this, the Task Force conducted several focus
group studies of San Francisco Bay Area commuters who commute regularly into San Jose and
surrounding areas.

The research objectives of the focus group interviews were:

  1. To understand how social networking tools affect the overall commuting experience.

  2. To compare and contrast the commute experience of connected versus unconnected
      commuters — those who do or do not share or receive information with other commuters
      in their daily commutes.

  3. To identify unmet needs to aid the development of new technologies and solutions.

Methodology
Four focus groups consisting of 4-5 commuters each were conducted in San Jose. The group
breakdown was as follows:

  •   Two groups of commuters who do not use trip-planning apps containing a social
      networking feature

  •   One group of commuters who use the Roadify app

  •   One group of commuters who use the Waze app

The following criteria were used to select a representative group:

  •   Each group had 2-4 males and 2-4 females

                                                28
Part II - Comparative Focus Group
• A mix of respondents aged 21 to 64 years old
• All commuted into the city of San Jose at least twice a week
• A mix of transportation used when commuting – such as using public transportation or
driving a car
• All commutes exceeded 30 minutes in each direction
• Groups included a mix of commuting times
• Two of the four user groups used the Waze or Roadify app at least once a week on
average and were open to continue using the apps
• A mix of education levels with a high school degree at minimum
• A mix of ethnicities
Summary of Key Findings
With regard to the first objective — understanding how smartphone apps like Roadify and
Waze affect the overall commuting experience — the following trends were observed9 :
1. Public transportation commuters are different from car commuters.
• In general, public commuters see themselves as very knowledgeable and experienced.
Because of this, they don’t immediately see the benefit in receiving information from other
commuters.
• Many private commuters, on the other hand, are looking to connect while in the car.
Their “alone time” creates a prime environment for connecting and sharing.
9
It is important to note that the observations and trends described below are specific to commuting patterns and behavior within
the vicinity of San Jose and the surrounding Bay Area and may not be generalizable to cities with significantly different traffic or
public transport conditions, or with less tech-savvy populations.
29Part II - Comparative Focus Group
2. Within the group of public transport users, connected and unconnected commuters are
similar.
• Importantly, they are already connected to others physically while commuting, and this
minimizes the need for connection through technology.
• Both describe themselves as “experienced” and believe they “know what they’re doing.”
• They use technology while planning routes, more rarely during the commute itself.
‣ They say they are satisfied with current real time information.
‣ “I get updates at the station.” “There is an announcement of a train delay.” “A
fellow commuter will tell me about an incident.”
3. Within the group of car commuters there are slight differences between connected and
unconnected commuters; in general, connected car commuters seem somewhat happier.
• Connected car commuters describe themselves as “happy” / “content” / “excited.” Their
biggest complaint is that they are “busy.” They are:
‣ “Less stressed”
‣ “Able to predict and know.”
• Unconnected car commuters describe themselves as “neutral” to “happy.” Their complaint
is “fatigue.”
4. Unlike public commuters, car commuters recognize a need for technology at both the
planning stage and during the commute.
• For car commuters technology assistance is needed:
‣ In the planning stage: deciding the mode of transportation or route.
‣ Real time: re-routing around traffic and other incidents.
30Part II - Comparative Focus Group
• Note: private commuters do not only want to be informed of an incident; they want a
solution (e.g. re-routing options). When new technologies are created, they should go
beyond providing point A to B capabilities.
5. There is one key difference between connected and unconnected commuters: how they
feel about sharing information with people they do not know while commuting.
• Connected commuters are very open to sharing (and receiving) information from people
they don’t know while commuting. They appreciate receiving information, and this makes
them more interested in “giving back” information in the future. “I feel like I’m helping the
world.”
• Unconnected commuters have mixed to negative feelings, particularly about receiving
information from those they don’t know. They do not naturally trust crowd-sourced
information and believe it may be wrong, or even worse, intentionally misleading.
• Unconnected commuters brainstormed ideas to help them over this hurdle. Here’s what
they say they want from app technology:
‣ Profiles for users with experience ratings next to a login name
‣ A way to see where the commuter giving the information is / was when sending the
tip.
‣ An ability to share information with others on your same route, or those that typically
take that route (a route community of sorts).
6. Technology is integral to the future of commuting.
• Everyone (connected or not connected) uses technology on some level during or before
their commute. Some simply use more technology than others:
‣ Unconnected commuters are using technology such as: Google Maps, Apple
Maps, SignAlert, 511.org, and more.
31Part II - Comparative Focus Group
‣ Connected commuters are using all or most of the above, plus apps like Roadify,
Waze, etc.
‣ In short, there is a real opportunity to please commuters and enhance the commuting
experience through future app technology.
Detailed Learning by Type of Commuter
With regard to the second objective of comparing and contrasting the commute experience of
connected versus unconnected commuters, the following sections provide deeper insights into the
specificities within each subgroup of commuting individuals.
The Unconnected Public Transport Commuter
“We are commuting athletes.”
!
32Part II - Comparative Focus Group
The Connected Public Transport Commuter (Roadify users)
“I need options.”
!
The Unconnected Car Commuter
“Commuting is not generally a topic of my conversation [while driving].”
!
33Part II - Comparative Focus Group
The Connected Car Commuter (Waze users)
“I feel like I’m helping the world.”
!
Ideas to Improve Commuting
To identify unmet needs and aid the development of new technologies and solutions, several
ideas were presented to commuters to gain feedback on what is most important to them. There
were no differences between public and private commuters in the features they preferred.
However, public commuters said they would use these features when planning routes; private
commuters said they would use them in real-time during the commute.
Features commuters found most important and useful:
• Voice-activated alerts via mobile phone, warning of an upcoming traffic incident or public
transport service disruption.
• Real-time web and app-based comparisons of multiple routes or transportation modes and
how long they would take.
34Part II - Comparative Focus Group
• Recommended departure times to avoid being stuck in traffic and/or public transport
delays.
• GPS navigation visible on car windshield.
In addition to the options above, commuters were asked what ideal feature or technology would
improve their commute. The most important needs that surfaced were “one-stop-shopping”
and “proactive communication.” One-stop shopping refers to the convergence of all
traffic related information (car, public transportation, walking, biking, etc.) in one app. Proactive
communication refers to predictions of their travel with real conditions as a way to pre-inform
them about what conditions they can expect in the next ten minutes (with automatic re-routing
options if necessary).
Conclusion: Part II
The focus group studies were noteworthy in terms of what they revealed about commuters’
preferences, behaviors and experiences. Regardless of the mode of transportation that people
use on a daily basis or their choice of technology in facilitating their commute, commuters
generally value information that helps reduce uncertainty. In San Jose, commuters who travel
frequently or exclusively using public transport are satisfied with existing official real-time alerts
and notifications about service changes. They have little need to connect with other commuters
via the social networking feature of the Roadify app during their commute. As regular commuters,
they feel self-reliant in terms of knowing how to adjust their journey when faced with service
disruptions, or can get the information they need from fellow passengers. While having access to
trip-planning features is useful, being connected directly to other public transportation commuters
provides less marginal value.
However, car commuters in the Bay Area said sharing information during the commute was a
desirable and valuable added feature. Interestingly, its impact appeared to take two main forms.
Commuters felt that having access to real-time information saved some time, but they also
expressed satisfaction at helping others by sharing useful information. Both these elements
35Part II - Comparative Focus Group
contributed to an improved commuting experience for Waze users compared with their
unconnected counterparts.
Building on the observations in this pilot, further studies could quantify the marginal value of the
“connected” feature as well as the resulting amount of time saved. However, with regard to the
development of future technologies, we can already conclude that tools that commuters would
find most helpful are ones that further improve the predictability of their commute, featuring real-
time route alternatives in the event of an unexpected incident.
36Connected Commuting Works
Connected Commuting Works

The study overall aimed to obtain a clearer picture of how real-time social networking between
commuters can enhance the overall commute experience for public transport users and drivers,
and the specific ways in which commuting can be improved in cities all around the world,
drawing on this pilot. Thus part I of the study in the Connected Commuting Task Force
investigated the sentiments exhibited by connected commuters (i.e. those who share and/or
receive information in real time via smartphone social networking commuter apps); part II used
focus groups to draw real-life comparisons between connected and unconnected commuters
based on their experiences.

Taken together, they reveal that real-time sharing of information between commuters can improve
the overall commuting experience in a number of different and interesting ways. First, as the user
commentary data analysis illustrates, crowd-sourced commuter information-sharing can be a
useful gauge of commuter sentiment for transportation agencies, with regard to specific routes or
even particular traffic incidents. This could provide valuable feedback to local authorities, so they
can improve infrastructure or programs to facilitate a better commute. Second, crowd-sourced
data provides smartphone app developers with insights about additional features that could be
incorporated to give commuters further options on alternative routes that mitigate frustration or
stress. Lastly, the focus group results show that connected commuting is particularly useful for car
commuters. Receiving real-time information from others saved time, and sharing information gave
a feeling of satisfaction; both contributed to a more positive commute experience.

Although data from frequent users of public transport may provide useful information for city
authorities, the social networking feature appeared less useful for the commuters themselves, who
said were satisfied with existing real-time updates from official sources and/or fellow
passengers, and were able to adapt their journey based on their own knowledge of routes. Thus
being connected to fellow travelers does not necessarily offer significant additional value to
public transport users. However, there may be significant differences in this respect between
daily public transport commuters and new or infrequent public commuters.

For car commuters, while traditional forms of real-time traffic information (e.g. radio) are still
valued, being connected to fellow commuters provides a clear added dimension of predictability
to their journey, reducing stress and in some cases, saving time. An important area of future study

                                                 38
Connected Commuting Works
would be to quantify how much time is saved per passenger on average due to information
gained from connected commuting. The measurement of time saved could serve as a proxy to
calculate the reduced cost of fuel to passengers, reduced Co2 emissions, increased productivity,
and so on.
The Task Force on Connected Commuting will seek to explore these issues further in the post-pilot
phase of the project.
39About New Cities Foundation The New Cities Foundation is a leading global platform for innovation and high-level exchange on the future of the urban world. Working to create more dynamic, sustainable, just and creative cities with a special focus on rapidly urbanizing regions, the Foundation fosters urban innovations and new partnerships among government, business, the research community and civil society. Foundation members include some of the world’s most forward thinking companies, city organizations, universities, and philanthropic and civil society organizations. The Foundation hosts a number of leadership events on cities including its flagship event, the New Cities Summit, an annual invitation-only gathering bringing together about 1,000 of the world’s most senior decision makers, mayors, leading CEOs, innovators, entrepreneurs, architects and thinkers. The Foundation also runs a successful Urban Lab, managing a number of applied urban research projects including NCF Task Forces and thought leadership activities.
About Ericsson

Ericsson is the world's leading provider of communications technology and services. The company is enabling
the Networked Society with efficient real-time solutions that allow citizens to study, work and live their lives
more freely, in sustainable societies around the world.

Ericsson's offering comprises services, software and infrastructure within Information and Communications
Technology for telecom operators and other industries. Today more than 40 percent of the world's mobile
traffic goes through Ericsson networks and supports customers' networks servicing more than 2.5 billion
subscribers.

Ericsson operates in 180 countries and employs more than 100,000 people. Founded in 1876, Ericsson is
headquartered in Stockholm, Sweden. In 2011 the company's net sales were SEK 226.9 billion (USD 35.0
billion). Ericsson is listed on NASDAQ OMX, Stockholm and NASDAQ, New York stock exchanges.
www.newcitiesfoundation.org
    Twitter: @newcitiesfound
Facebook: /NewCitiesFoundation
You can also read