Ellesmere Market Town Profile - Autumn/Winter 2017 - Shropshire Council
←
→
Page content transcription
If your browser does not render page correctly, please read the page content below
Ellesmere Market Town Profile
                      Autumn/Winter 2017

              1
INFORMATION, INTELLI GENCE & INSIGHT

Contents
Section                                    Page
Introduction                                3

Local Politics                              5
Demographics                                7
Economy                                     13
Tourism & Leisure                           29
Health                                      31
Housing & Household                         34
Education                                   39
Transport & Infrastructure                  42
Community Safety                            43

Additional Information                      45

                                       2
INFORMATION, INTELLI GENCE & INSIGHT
                                                                                         Phone: 0345 678 9000
                                                                                         Email: commissioning.support@shropshire.gov.uk

Market Town Profile
Ellesmere
Ellesmere is situated in North Shropshire and was first settled by ancient Britons. The area has 9 meres (glacial lakes) with the town being situated
next to the ‘mere’ one of the largest in England outside of the Lake District. A castle was built in the 11 th century of which only earthworks now
remain.

The mere contains an artificial island, constructed in 1812 from the soil dug out to make the gardens at Ellesmere House. It was later named
Moscow Island, as Napoleon's defeat in Russia also took place in that year. The mere has a visitors' centre and is popular with birdwatchers

Area Quick Statistics

  2055 hectares                                    1927 households                               4,700 people
  2.1 people per hectare                           2,012 dwellings                               45 is the average age

 This town profile has been produced by the Information, Intelligence and Insight team of Shropshire Council. Whilst every effort has been made to
 ensure the accuracy of the information supplied herein, Shropshire Council cannot be held responsible for any errors or omissions.

                                                                       3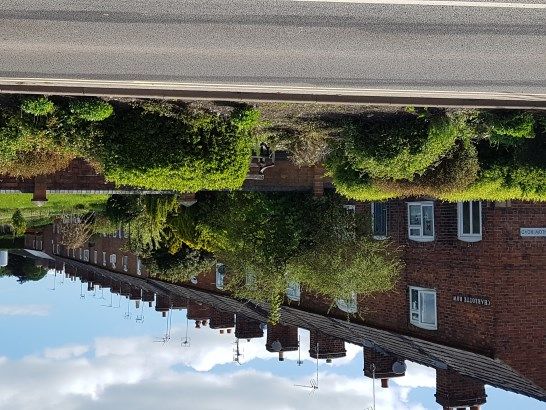
INFORMATION, INTELLI GENCE & INSIGHT

Ellesmere Town Council Area Key Assets
The information in this market town is predominantly focussed on the town council area of Ellesmere. Due to the nature of national statistical data
it is not always possible to fully replicate these boundaries. Statistics quoted in this profile will use the best fit to the town council area. If these are
                                                                                                                            not available the next best fit
                                                                                                                            is the use of Lower Super
                                                                                                                            Output Areas. These small
                                                                                                                            area figures are part of a
                                                                                                                            national      dataset         which
                                                                                                                            comprises of 32,000 areas of
                                                                                                                            which      there   are       192   in
                                                                                                                            Shropshire      and      3    which
                                                                                                                            cover most of the town
                                                                                                                            council area.

                                                                           4
INFORMATION, INTELLI GENCE & INSIGHT

Local Politics and Influences
Ellesmere is represented by a local town council that is responsible for the management of a range of services including; Grounds Maintenance,
Public Toilets, management of local grants and street lights. See the council website for full details of services.

https://www.ellesmere-tc.gov.uk/

Ellesmere Town Council area is currently represented by 11 members.

A mayor is elected each year – the mayor for 2017/18 is Councillor Ryan Hartley.

Shropshire Council is responsible for many services including; education, environment, highways, licencing, planning, social care, trading standards
and waste collection. Details of all services can be found at https://shropshire.gov.uk/

There is 1 Shropshire Council ward covering the town council area. Elections are held on a 4 year cycle with the next elections due May 2021. Ward
councillors are -

Ellesmere Urban – Councillor Ann Hartley.

Member of Parliament
Ellesmere is part of the North Shropshire parliamentary ward which is represented by the Rt Hon Owen Paterson MP.
https://www.owenpaterson.org/

                                                                         5
INFORMATION, INTELLI GENCE & INSIGHT

Community Assets
Ellesmere has a number of public services which operate from the town. There are also a number of facilities which can be used for hire.

 Public Services
 Ellesmere Town Council, Ellesmere Town Hall, 1-3 Willow Street, Ellesmere, SY12 0AL https://www.ellesmere-tc.gov.uk/

 Ellesmere Library, Our Space, Trimpley Street, Ellesmere, Shropshire, SY12 0AE
 Ellesmere Library is managed and staffed by Bethphage http://www.shropshire.gov.uk/libraries

 Ellesmere Fire Station, Grange Rd, Ellesmere SY12 0AU
 There is a meeting room available for public use, with whiteboard and kitchen facilities. The room has seating for around 12 people and has
 facilities for people with disabilities.

 Community Facilities
 Our Space, Trimpley Street, Ellesmere, Shropshire, SY12 0AE – Our Space is a Community Centre and Library facility in Ellesmere and is managed
 by Bethphage, a Shropshire based charity and specialist provider of support for adults with learning disabilities. Room hire is available with a range
 of spaces, from 1-1 meeting rooms to large multipurpose areas, along with a kitchen.

                                                                       6
INFORMATION, INTELLI GENCE & INSIGHT

Demographics
Shropshire Town and Parish
                           1981 Census           1991 Census 2001 Census 2011 Census
          Council
         Ellesmere                    2,474           2,967           3,367            3,835
Source: Census data
Ellesmere is the twelth largest town in Shropshire by population. The latest population of Ellemere is 4,700 (Mid Year Population Estimates, ONS,
2015) covering 2055 hectares. Ellemere’s population density was 2.1 people per hectare, making it the tenth most densely populated of all
Shropshire Market Towns. Ellemere’s population consists of 49% male and 51 % female. Ellemere’s Town Council population has increased since
1981 from 2,474 to 3,835. This is an increase of 55% in 30 years.

Population Forecast
 Built up Area Geography        Census Day                 2016                   2026
         Ellesmere            27th March 2011
        Population                   3,700                 4,100                  5,400

         Dwellings                   1,700                 1,900                  2,500

        Households                   1,600                 1,800                  2,400

Note: the population, dwellings and household figures are based on a different area than the
parish council area. Population forecasts are based on developments of new housing.

The population of Ellesmere area is forecast to rise from 3,700, in 2011 to 5,400 in 2026. This is a rise of 48% over this period. The largest part of
this increase is expected between 2016 and 2026, when the population is forecast to rise by just around 1300 people or 32%.

The number of dwellings is also forecast to increase from 1,700 in 2011 to 2,500 in 2026. This is an increase of 45%. Similarly the largest part of
this growth is forecast to happen between 2016 and 2026.

The number of households are forecast to increase by 49% between 2011 and 2026, in a similar manner to dwellings.
                                                                                   7
INFORMATION, INTELLI GENCE & INSIGHT

Population by Local Areas
                                           The information in this market town
                                           is predominantly focussed on the
                                           town council area of Elesmere. Due
                                           to the nature of national statistical
                                           data it is not always possible to fully
                                           replicate     these       boundaries.
                                           Statistics quoted in this profile will
                                           use the best fit to the town council
                                           area. If these are not available the
                                           next best fit is the use of Lower
                                           Super Output Areas (LSOA’s). These
                                           small area figures are part of a
                                           national dataset which comprises of
                                           32,000 areas of which there are 192
                                           in Shropshire and 3 which cover
                                           most of the town council area.

                                           The smallest area by population
                                           extends past the parish boundary to
                                           Breaden Heath.

                                       8
INFORMATION, INTELLI GENCE & INSIGHT
Age Structure 2,500 Ellesmere residents are of traditional working age
(16-64) which is the equivalent of 54.2% of the population.
The age structure in Ellesmere shows that there is an older age profile in the
This compares with 60% for Shropshire as a whole, 62.3%
town when compared to Shropshire and England.
in the West Midlands and 63.3% in Great Britain.
The age bands over the age of 75 show a higher percentage than for Shrop-
shire and England. Place Working age as % of population
There are slightly less people between the ages of 55 and 65 Albrighton 75.4%
Bishop's Castle 63.5%
There are fewer people under the age of 34 with the exception of the 10-14
age group. Bridgnorth 58.7%
Broseley 57.7%
There are slightly more people between the ages of 35 and 54 with the
Church Stretton 43.7%
exception of the 40-44 age group.
Cleobury Mortimer 73.4%
There are a similar number of children under 10 to Shropshire as a whole but Craven Arms 61.3%
far fewer than national proportions.
Ellesmere 54.2%
Age Structure Highley 49.7%
Ludlow 61.4%
Market Drayton 55.5%
Much Wenlock 58.3%
Oswestry 57.0%
Shifnal 60.9%
Shrewsbury 62.3%
Wem 61.4%
Whitchurch 60.5%
Shropshire 60.0%
Source: Office of National Statistic (ONS) Mid Year Estimates, 2015 - Ward Level Mid Year West Midlands 62.3%
Population Estimates, 2016. Great Britain 63.3%
9
INFORMATION, INTELLI GENCE & INSIGHT

Ethnicity and Religion
                                                                                              The latest ethnicity data is taken from the 2011
                                                                                              census. The next census is due in 2021 with the
                                                                                              results likely to be published from 2023. To help
                                                                                              provide an indication of changes to ethnicity
                                                                                              data    the      number       of   National    Insurance
                                                                                              registrations      to      adult   overseas    nationals
                                                                                              entering the UK are shown. These numbers should
                                                                                              only    be        used      as     an   indication    of
                                                                                              population changes. A registration does not mean
                                                                                              that    a       national     has    made      permanent
                                                                                              residence or has remained in the area.

                                                                                              The numbers shown are based on Middle Layer
                                                                                              Super Output Areas. These areas are larger than the
                                                                                              lower layers described in the population map.
Source: Department for Work and Pensions - Stat-Xplore

There is one middle layer that covers the area of Ellesmere, which extends beyond the parish boundary taking in surrounding hinterlands as far as
Breaden Heath to the east, Hordley and Bagley to the south, Welsh Frankton and Dudleston Heath towards the west. The total number of
registrations made during this period has been 142, which included 53 Polish and 52 Bulgarian nationals.

                                                                     10
INFORMATION, INTELLI GENCE & INSIGHT
Ethnicity and Religion
Ellesmere is home to a number of churches and chapels which reflect the majority of the population who have a Christian faith.
Ellesmere Methodist Chapel, Trimpley St, Ellesmere SY12 0AE https://www.shropshireandmarches.org.uk/find-a-chapel/northern-area/ellesmere/
St Mary’s Church, Church Hill, Ellesmere SY12 0HB - http://www.ellesmere.org.uk/ - worship has taken place on the site for more than 1000 years.
The current church has been developed in phases since the 13th century. Today the church remains active in the community with regular services
and home to the local bell ringers.
Cellar Church, 1 Scotland St, Ellesmere SY12 0DE - http://www.cellarchurch.co.uk/
11INFORMATION, INTELLI GENCE & INSIGHT
Multiple Deprivation
The Index of Multiple Deprivation (IMD 2015) is
designed to identify areas where communities lack
resources and are in need. To do this, seven factors
are considered, which are:
Income deprivation
Employment deprivation
Health deprivation and disability
Education deprivation
Barriers to housing and services
Crime
Living environment deprivation
Ellesmere has two areas covering the Town Council
area which fall into decile 4, or the 40% most
deprived LLSOA’s nationally. The area in the centre
Source: Index of Multiple Deprivation (IMD), Department of Communities and Local Government, is less deprived, falling into the 9th decile nationally.
crown copyright 2017
For more information on IMD see:
https://www.gov.uk/government/statistics/english-
indices-of-deprivation-2015
12INFORMATION, INTELLI GENCE & INSIGHT
Economy Breakdown Part/Full Time
Ellesmere is the ninth largest employment centre in Shropshire and is one of the main Part-time employment is more common in
locations of businesses and jobs in the north of the County, albeit notably smaller than Shropshire than it is regionally or nationally, and its
Oswestry, Market Drayton and Whitchurch. 170 businesses have registered offices in prevalence is even more pronounced in Ellesmere as
Ellesmere (Source: MINT (Bureau van Dijk), July 2017) which is less than 1% of the illustrated in the chart below.
Shropshire total and approximately 1,200 people are employed in the town (1.0% of the
Ratio of Full Time/Part Time Employers
Shropshire total).
Time Series Over the last five years, the
number of jobs in Ellesmere has
risen by 5.9%, or by around 100
jobs, which is the equivalent of an
increase of 20 jobs per annum. In
comparison, the number of jobs in
Shropshire rose by 2.9% over the
same period.
Source: Business Register and Employment Sur-
Private/Public Sector Employment Across Shropshire, the number of public sector jobs has fallen by 4,800 since 2010 (-18.3%)
while the number of private sector jobs has risen by 8,000 (+9.4%). The share of all the jobs
attributable to the public sector has declined from 23.3% in 2010 to 18.4% by 2015. The
loss of public sector jobs has had minimal impact on employment in Ellesmere with the
number of public sector jobs in the town holding stable at about 300. This represents 22%
of all employment, which is higher than any other town except Shrewsbury, Wem and Much
Wenlock. Private sector employment rose by 6.8% between 2010 and 2015.
13INFORMATION, INTELLI GENCE & INSIGHT
Employment Sectors
The three largest employment sectors in Ellesmere are education, retail and accommodation and food services. Together these account for 47.2% of
employment within the town. Employment in education accounts for 18.7% - almost twice as high a representation as for Shropshire as a whole.
Retail is typically over-represented in towns, and
this is the case in Ellesmere where it
accounts for 16.7% of jobs compared with the
Shropshire average of 10.4%. Accommodation and
food services account for 11.8% of
employment. Other sectors accounting for more
than 5% of jobs include health and
professional, scientific and technical.
* Includes all industry sectors accounting for 5% of more of
employment in the town, except where data has had to be
suppressed due to reasons of disclosure.
Source: Business Register and Employment Survey, Office for National Statistics, Crown Copyright 2017
Ellesmere Shropshire Great Britain West Midlands The adjacent table shows the employment sectors in
Agriculture, forestry & fishing 0.4% 0.6% 0.7% 0.9%
Ellesmere that are represented within the 41.2% of
Mining, quarrying & utilities 0.0% 1.3% 1.3% 1.3%
Construction 3.3% 6.8% 4.5% 5.2% jobs designated as “other” in the chart above (except
Motor trades 0.5% 2.7% 1.8% 2.2% where figures have had to be suppressed due to
Wholesale 1.1% 4.8% 4.0% 5.3% disclosure reasons). Compared with Shropshire,
Transport & storage (inc postal) 1.6% 4.8% 4.6% 5.9%
Ellesmere is under-represented in motor trades,
Information & communication 1.8% 2.1% 4.2% 2.6%
wholesale, transport and storage, information and
Financial & insurance 0.6% 1.2% 3.5% 2.6%
Property 1.1% 1.6% 1.7% 1.5% communication, property, business administration and
Business administration & support services 1.5% 4.7% 8.8% 8.3% support services, public administration and defence as
Public administration & defence 2.6% 4.4% 4.4% 3.9% well as arts, entertainment and recreation.
Arts, entertainment, recreation & other
1.8% 5.3% 4.4% 4.4%
services
Extra footnote: Employment in education suppressed to avoid disclosure
14INFORMATION, INTELLI GENCE & INSIGHT
Main Employers
The following organisations are identified by the business directory MINT as being the largest employers in Ellesmere. This suggests that there are
nine employers with a workforce of 20 or more within the town centre boundary.
Large employers which are not included within the below table include national retail stores, of which Tesco is the largest in Ellesmere.
Number of Turnover
Employers More than four-fifths of businesses in Ellesmere employ less than 5
Employees (£’000s)
people. An additional 7% employ between 5 and 9. 2.9% have a
R J Fullwood and Bland Limited 634 72,483
workforce of 50 or more.
Fabdec Holdings Limited 112 12,322
Lakelands Academy 89 5,432 Breakdown of
Employers by
Ellesmere Primary School 75 3,315
Size Band
The Boat House Restaurant 45 1,806
Ellesmere Medical Practice 30 1,806
Ellesmere Community Care
28 413
Centre Trust
Gough Thomas & Scott
23 1,905
Solicitors
S N R Brunt Partnership 20 2,448
Source: MINT (Bureau Van Dijk), July 2017
15INFORMATION, INTELLI GENCE & INSIGHT
Business Rates
167 establishments have a rateable value in Ellesmere and the combined rateable value of these organisations is £2.8 million. This is the equivalent
of 1.2% of the total rateable value of all businesses in Shropshire.
136 businesses have a rateable value of less than £12,000, which means that they are eligible for 100% small business rate relief. Just 7 (4.2%) have
a rateable value of more than £51,000.
Business by Rateable Value The majority of organisations on the Ellesmere business rates list are
classed as commercial—primarily retail outlets and offices. These
account for 79.0% of the total. Miscellaneous is the second largest
classification, accounting for 7.2% of the total.
Count of Classification Ellesmere
Commercial 132
Education Training and Culture 5
Industrial 8
Source: Valuation Office Agency
Leisure 6
Business Floor Space Miscellaneous 12
Utilities 4
Total 167
87 businesses have a floor space of less than 100m2, while just five have floor
space of more than 1,000m2. The two largest organisations cover more than
6,000m2.
16INFORMATION, INTELLI GENCE & INSIGHT Of those who were economically active, 76.0% were in
employment while 5.5% were unemployed. This compares with
Economic Activity
75.8% and 4.3% for Shropshire as a whole and with 71.2% and
The status of Ellesmere residents aged 16-64 at the time of the 2011 Census 5.8% for England. At the time of the Census, therefore,
showed 81.6% of residents were economically active, which includes people who unemployment was a greater issue in Elsmere in relation to
are both employed and actively seeking employment. This is higher than the Shropshire with the rate more or less on a par with the national
Shropshire figure of 80.1%. Economic activity in Ellesmere is also significantly average.
higher than the national and regional averages (77% and 75.8% respectively). Of the 1,970 Ellesmere residents in employment, the majority
are employees (83.0%) while the remainder are self-employed.
68.3% of employees work full – time compared with 75.7% of
the self-employed.
Employment Breakdown Ellesmere
In Employment Total 1,970
Of which Employee: Total 1,636
Of which Employee: Part-time 518
Of which Employee: Full-time 1,118
Source: 2011 Census Of which: Self-employed: Total 334
Of which Self-employed: Part-time 81
Of which Self-employed: Full-time 253
Self-employment is notably higher in Shropshire than it is nationally, accounting for
13.5% of 16-64 year old residents (10.5% in England). Typically, levels of self-employment
are lower in the County’s market towns, especially the main employment centres. This is
the case in Ellesmere, where the self-employment rate at the time of the Census stood at
12.9%. This proportion is notably higher than the regional or national average.
17INFORMATION, INTELLI GENCE & INSIGHT
Economic Inactivity
478 Ellesmere residents aged 16-64 were economically inactive in 2011, which represents over a fifth of the age cohort. These people –
representing those who are neither working nor seeking employment – include those who are retired, full time students, those looking after family
or the long term sick. The proportion of the Ellesmere population which does not participate in the labour market is lower than the average for
Shropshire.
The following chart shows the breakdown of the economically inactive population in Ellesmere, Shropshire, the West Midlands and England
according to the reason why they do not participate in the labour market. These figures relate to the 16-74 population rather than to 16 to 64 year
olds.
It is apparent that a notably higher proportion of economically inactive Ellesmere residents are inactive because they are retired than is the case
across Shropshire which itself supports significantly more retired people compared with the West Midlands and England.
Source: 2011 Census
18INFORMATION, INTELLI GENCE & INSIGHT
Employment by Occupation
Ellesmere supports relatively low numbers working in the Standard Occupational Classification (SOC) 1 to 3 professions, with 32.4% of residents in
work employed as managers, directors and senior officials, in professional occupations or in associate professional and technical occupations
compared with 38.9% in Shropshire. 10.5% work as managers, 13.3% in professional occupations and 8.6% in associate professional occupations. A
higher proportion are employed in lower level occupations, including elementary occupations (13.2% compared with 11.3% for Shropshire) and
process, plant and machine operatives (9.9% compared with 7.4% for Shropshire). More people are also employed in caring, leisure and other
service occupations (11.1% compared with 10.1% Countywide) and in skilled trades occupations (16.7% compared with 15.2%).
Source: 2011 Census
19INFORMATION, INTELLI GENCE & INSIGHT
Qualifications
According to the Census 2011, 26.9% of residents had a level 4 qualification or above, notably lower than the Shropshire average of 29.4%. In total
16.5% of people had no qualification. This is higher than the Shropshire average (14.0%). The qualification profile of Ellesmere residents reflects the
type of employment that is prevalent amongst the working population, with fewer working in managerial or professional occupations and more in
elementary occupations.
Qualifications Ellesmere Shropshire England and Wales
Level 1 17.6 15.4 15.2
Level 2 18.8 19.4 17.2
Level 3 12.5 14.7 14.5
Level 4/5 26.9 29.4 29.7
Other qualifications 7.8 7.1 8.6
No qualifications 16.5 14.0 15.0
Source: 2011 Census, ONS, Highest Level of Qualification Population aged 16-64.
For further information on qualification levels and definitions visit Office of National Statistics (ONS)
http://www.ons.gov.uk/employmentandlabourmarket/peopleinwork/employmentandemployeetypes/
articles/qualificationsandlabourmarketparticipationinenglandandwales/2014-06-18#background-notes
20INFORMATION, INTELLI GENCE & INSIGHT
Unemployment
Jobseeker’s Allowance (JSA)/Universal Credit is payable to people under pensionable age who are available for and actively seeking work. The chart
below shows the number claiming this benefit in Ellesmere between January 2013 and July 2017 and it is evident that numbers have declined
substantially since the start of this period when the country was still in the wake of the economic downturn. The number of claimants began to
level off in the summer of 2015, since when it has fluctuated between 25 and 40 people.
In July 2017, 30 Ellesmere residents were claiming JSA/
Universal credit, which is 63% lower than the 80 who
were claiming in January 2013. The claimant rate in
Ellesmere (the percentage of the 16-64 population which
is claiming) is slightly higher than the average for
Shropshire (1.2% compared with 1.1%). This rate is also
lower than for either Great Britain (1.9%) or the West
Midlands (2.4%).
Source: Department of Work and Pensions
Benefits Claimants State Pension
The following table shows the number of benefit claimants by type in Ellesmere in
In Shropshire there were 76,250 people claiming state
February 2017. The most common benefit is employment and support allowance (ESA),
pension in February 2017, claiming an average of
claimed by 110 people.
£140.29. The number of claimants has risen by 27.2%
Ellesmere since February 2003. The rise in claimants in Ellesmere
Employment and Support Allowance 110 has been much lower than this at 14.5%, which has
Incapacity Benefit/Severe Disablement Allowance 10 taken the number of claimants to 1,145. This
Income Support 25 represents 1.5% of the Shropshire total.
Jobseekers Allowance 15
21INFORMATION, INTELLI GENCE & INSIGHT
Travel and Commuting
The most commonly used method of transport to work for Ellesmere residents who work was to travel by car or van. 43% of workers drove to work,
while an additional 4% were a passenger in a car or van. A slightly higher proportion of Ellesmere residents work primarily from home than is the
case nationally at 4% which is lower than the Shropshire average of 6%. A relatively high number walk to work (10% compared with 9% for
Shropshire and 7% for England). There were considerably fewer people travelling by public transport than is the case nationally. This is a pattern
familiar to many rural areas .
Travel to Work
Source: 2011 Census
22INFORMATION, INTELLI GENCE & INSIGHT
Car or Van Availability
Car ownership is high in Shropshire, which is typical of a rural area. Just 15.8% of households in the County do not have a car or van compared with
a 25.8% of households nationally according to the 2011 Census. The proportion of households without a car in Ellesmere stands at 16.3%.
47.8% of households have one car, 28.0% have two cars while 7.8% have three or more. The total number of cars and vans owned by Ellesmere
households stood at 2,502 in 2011.
Car
Caror
orVan
VanAvailability
Availability
Source: 2011 Census
23INFORMATION, INTELLI GENCE & INSIGHT
Commuting Patterns
Ellesmere (place plan area) supports a lower level of employment self-containment than the largest market towns in Shropshire but in relation to
its size, self-containment is reasonably high. 32.0% of all Ellesmere jobs are filled by Ellesmere residents while 33.8% of working people who live in
Ellesmere also work there, which gives an overall level of self-containment of 32.9%. The differential between the number of resident workers and
the number of jobs is small in Ellesmere, with net in-commuting across the Ellesmere place plan border standing at 149. This equates with 1,784
people living in Ellesmere but working elsewhere and 1,933 people working in Ellesmere but living elsewhere.
Job density in Ellesmere is high with 1.06 jobs per resident worker compared with 0.95 in Shropshire. As illustrated in the chart below, the only
other towns in the county where the number of jobs exceeds the resident workforce are Albrighton, Ludlow and Shrewsbury.
Job Density
Source: Census 2011
Note: Data relates to Mid Super Output Areas (MSOA) aligned as closely as possible to Shropshire place plan areas
24INFORMATION, INTELLI GENCE & INSIGHT
Origins and Destination of Workforce
Other than Ellesmere, the rest of Shropshire is the main source of workers for Ellesmere jobs. Small numbers commute in from Telford and Wrekin
and Wrexham. Likewise, a significant proportion of Ellesmere resident workers who are not employed in Ellesmere work elsewhere in Shropshire.
Main Origins of Ellesmere Main Destinations for Ellesmere
Numbers % Number %
Workforce Resident Workers
Ellesmere 910 33.8%
Ellesmere 910 32.0%
Rest of Shropshire 1070 37.6% Rest of Shropshire 1,051 39.0%
Wrexham 502 17.7% Wrexham 320 11.9%
Telford & Wrekin 66 2.3% Telford and Wrekin 79 2.9%
Other 295 10.3% Cheshire West and Chester 62 2.3%
Source: Census 2011
Note: Data relates to Mid Super Output Areas (MSOA) aligned as closely Other 272 10.1%
as possible to Shropshire place plan areas this covers a wider geographic Note: Data relates to Mid Super Output Areas (MSOA) aligned as
area than the Parish. This results in a higher workforce number than closely as possible to Shropshire place plan areas
quoted in the economic activity table.
25INFORMATION, INTELLI GENCE & INSIGHT
Household Income
% of Households Household income in Ellesmere is reasonably
Market Town Households 15K or less 15k - 30k 30k to 50k 50k to 80k 80k + comparable with the County average. 25% or 507
households in Ellesmere earn less than £15,000
Albrighton 2333 21% 28% 26% 17% 8%
per year. 31% of households earned between
Bishop's Castle 714 30% 33% 24% 11% 3%
£15,000 and £30,000 and 25% earned between
Bridgnorth 5713 20% 28% 26% 17% 9%
£30,000 and £50,000.
Broseley 2523 24% 29% 25% 15% 6%
Church Stretton 2344 21% 28% 25% 17% 8% At the other end of the spectrum, just 5% of
Cleobury Mortimer 1409 20% 28% 26% 18% 9% households had an income exceeding £80,000 per
Craven Arms 1341 30% 33% 23% 11% 3% annum. 14% of households have an income
Ellesmere 2029 25% 31% 25% 14% 5% between £50,000 and £80,000.
Highley 1633 28% 33% 24% 11% 3%
Ludlow 5432 29% 31% 23% 12% 4%
Market Drayton 5382 26% 31% 24% 14% 5%
Minsterley 742 27% 31% 24% 13% 4%
Much Wenlock 1539 16% 25% 27% 20% 11%
Oswestry 7975 29% 32% 24% 12% 4%
Pontesbury 1564 17% 25% 27% 20% 11%
Shifnal 3502 22% 27% 25% 17% 9%
Shrewsbury 32370 23% 29% 25% 16% 7%
Wem 2733 28% 33% 24% 12% 3%
Whitchurch 4486 28% 31% 24% 12% 4%
Source: CACI, 2016, Paycheck Income Data, Shropshire
Note: the methodology to calculate the number of households is based on commercial and credit data rather than
census information.
26INFORMATION, INTELLI GENCE & INSIGHT
Retail Economy
Retail accounts for 16.7% of total employment in Ellesmere, which makes it the second largest employment sector in the town. 1.6% of all retail
employment across the whole of Shropshire is absorbed by Ellesmere.
Retail plays an important role in the economy of Ellesmere. Providing everyday amenities and shopping for local residents and serving as a shopping
hub for the hinterland of the market town.
High Street Shopping, The retail sector also assists in attracting visitors to the town by offering a mix of independent and national stores.
Ellesmere has a range of independent traders providing fresh produce, gifts and household items. There are a range of services including banking
and Post Office. Ellesmere has a number of cafés, pubs and restaurants for residents and visitors.
Supermarkets, There is a large Tesco’s situated on the outskirts of the town centre along with a Co-op and Londis convenience stores situated
within the town centre.
Markets
Ellesmere Market, Market hall, Scotland Street, Ellesmere, Shropshire, SY12 0EG http://www.ellesmeremarkethall.co.uk/
A market has been held in Ellesmere since the 1300’s. The current market hall was built in 1879 and continues to hold a market every Tuesday.
27INFORMATION, INTELLI GENCE & INSIGHT
Main Retail Area
28INFORMATION, INTELLI GENCE & INSIGHT
Tourism & Leisure
Approximately 200 people are employed in the tourism sector in Ellesmere, of which the majority are employed in accommodation and food
services a small number in arts, entertainment, recreation and other services. This is the equivalent of 13.6% of the total Ellesmere workforce
which represents a marginally higher share than for Shropshire as a whole (13.3%). 1.0% of total employment in the tourism sector in Shropshire is
provided by Ellesmere.
Visitors Attractions
Ellesmere is a popular destination with visitors attracted to its natural lakes, wildlife, tranquil walks and the nearby canal network.
An ideal starting place for information on places to visit and things to do in Ellesmere is the -
Meres Visitor Centre, The Mere, Ellesmere SY12 0PA - https://www.ellesmere.info/
Places to see in Ellesmere include:
The Meres, the visitor centre attracts around 250,000 visitors a year. Hire a rowing boat or take a ride in a steam boat to view the sca le of this
glacial lake. The Visitor Centre offers a range of facilities and attractions including; promenade, gardens, Boathouse Restaurant, Cremorne
Gardens, adventure play area, formal flower beds, specimen trees, lawns and seating, and a circular garden walk.
Ellesmere Sculpture trail - www.ellesmeresculpture.co.uk
Located next to the Meres visitors centre the Ellesmere Sculpture Trail is made up of sculptures set in the unique and beautiful landscape of
Ellesmere. The pieces are created by international contemporary artists.
Llangollen Canal, located close to the town centre the canal is popular with boaters and offers a marina and overnight moorings.
Events
Ellesmere hosts a number of events throughout the year. Key annual events are listed here but it is worth visiting the Ellesmere website for details
of events. https://www.ellesmere.info/
Ellesmere Carnival, A large parade of the Town streets with bands, floats, old vehicles and people dressed in costume. The parade continues to the
Mere where there are various stalls, refreshments and entertainment. https://www.ellesmere.info/
29INFORMATION, INTELLI GENCE & INSIGHT
Ellesmere Food and Drinks Festival, http://www.ellesmerefoodfestival.co.uk/ held over two days in June the Festival is held at the Market Hall and
the Town Hall and is free to visit and open from 10am until 4pm. The show includes a variety of produce, from fruit, vegetables, cheeses, meat
products, ice cream, wines, beer, homemade chocolates and preserves all from local and regional producers.
Ellesmere Summer Festival, The three day summer festival is usually held in August and celebrates the works of local crafters and artists. Events
are spread throughout the town and at the canal wharf and the historic canal workshops. https://www.ellesmere.info/
Ellesmere Winter Festival, Held in late November the annual switch on of the Tree of Lights is accompanied by Carols. Santa arrives in Ellesmere
on a Narrow Boat before being paraded through the Town with a Lantern Parade. https://www.ellesmere.info/
Sports, Leisure & Culture
Ellesmere has an active range of sporting, leisure and social clubs. If you are looking for particular activities the Community Directory is a good
starting place – https://shropshire.gov.uk/libraries/community-directory/
The following list highlights some of the cultural, sporting groups and facilities in the Ellesmere area:
Lakelands Sports Centre, Lakelands Academy, Oswestry Road, Ellesmere, SY12 0EA – school facilities are available for community use. Contact
school for details http://www.lakelandsacademy.org.uk/ Facilities include - Sports Halls, Health and Fitness Suites, Grass Pitches, Synthetic Turf
Pitches and Tennis Courts.
Ellesmere Swimming Centre, Elson Road, Ellesmere, SY12 9EU - community run pool based at Ellesmere Primary School
Ellesmere Bowling Club, 1 Church Hill, Ellesmere SY12 0HB - www.ellesmerebowlingclub.org.uk
18th century bowling club based on the grounds of Ellesmere castle.
Ellesmere Rovers Football Club, Beech Grove, Ellesmere SY12 0BT http://www.pitchero.com/clubs/ellesmererangers
Senior, youth, junior and veterans team.
Ellesmere Amateur Dramatic Society, perform two plays and one pantomime a year at Ellesmere Town Hall. They welcome new members who
would like to be involved either on stage, or behind the scenes.
Shropshire Sailing Club, Whitemere, Spunhill, Near Ellesmere, SY12 0HU – http://www.shropshiresailingclub.co.uk/
Founded in 1950 the Shropshire Sailing Club is a family club that meets on Wednesdays from Mid-April to September, Saturdays from April to
October, and Sundays from March to December.
30INFORMATION, INTELLI GENCE & INSIGHT
Health
Residents of Shropshire generally enjoy better health than across England as a whole with a healthy life expectancy being higher than average. Life
expectancy in Shropshire is also higher than the national average. Life expectancy for births in Shropshire between 2013- 15 are 80.3 for males and
83.8 for females. This compares to an average of 79.5 and 83.1 for England. Despite this there are areas in Shropshire where health inequalities may
exist. The index of deprivation, shown on the following map, highlight the areas where there are higher degrees of deprivation. The life expectancy
variation between the least and most deprived health areas in Shropshire is equivalent to 4.2 years for men and 3.3 for women.
This domain measures the following:
Years of potential life lost (2008 to 2012)
Comparative illness and disability ratio (2013)
Acute morbidity (2011/12 and 2012/13)
Mood and anxiety disorders (2008 to 2013)
Ellesmere health deprivation levels are low. Two areas fall into decile 6 or the 60%
most deprived LLSOA’s in England, and one area falls into decile 9, the 90% most
deprived decile in England.
Source: Index of Multiple Deprivation (IMD), Department of Communities and Local Government, crown copyright 2017
Of the 4,356 residents of Ellesmere in the last census reporting on their health conditions:
369 reported that their day-to-day activities were limited a lot.
476 reported that their day-to-day activities were limited a little.
3511 reported that their day-to-day activities were not limited.
The rate of people expressing that their day-to-day activities were limited a lot was 8.5% which is similar to the rate for Shropshire 8.4% and
England 8.3%.
31INFORMATION, INTELLI GENCE & INSIGHT
Health Conditions
At the time of the 2011 Census, 80% of residents in Ellesmere, said that they felt they were in very good or good health. This was similar to the
Shropshire and England average of 81%. In contrast 3.5% of people said their health was bad and 1.2% said their health was very bad.
Area Provide unpaid care a week
1 to 19 hours 20 to 49 hours 50 + hours
Ellesmere 7.1% 1.2% 2.9%
Shropshire 7.5% 1.3% 2.4%
England 6.5% 1.4% 2.4%
Source: 2011 Census
7.1% of people in Ellesmere provided unpaid care for 1-19 hours
per week, this was slightly lower than Shropshire as a whole.
Ellesmere also had slightly more people providing care for 50 or
more hours per week 2.9% compared to 2.4% for Shropshire and
England.
Source: 2011 Census
Health Economy
Approximately 100 people are employed in the health sector in Ellesmere (6% of total employment) which is low compared with the Shropshire
average of 14.7%.
32INFORMATION, INTELLI GENCE & INSIGHT
Health Facilities
Ellesmere has local access to a range of health facilities including chemists, doctors and dentists.
Hospitals
Accident & Emergency, 14.4 miles to the nearest Accident and Emergency service provided at Royal Shrewsbury Hospital, Mytton Oak Road,
Shrewsbury, Shropshire, SY3 8XQ.
Minor Injuries Unit Minor Injuries Unit, 6.8 miles to the nearest minor injuries unit at Oswestry Health Centre, Thomas Savin Road, Off Gobowen
Road , Oswestry, Shropshire, SY11 1GA.
Doctors
Ellesmere Medical Practice, Trimpley Street , Ellesmere, Shropshire, SY12 0DB – 7674 registered patients.
Dentists
Ellesmere Dental Practice, 18 High Street, Ellesmere , Shropshire, SY12 0EP.
Pharmacies
Ellesmere Pharmacy, 18 Scotland Street, Ellesmere, Shropshire, SY12 0ED.
Rowlands Pharmacy, 5 Cross Street, Ellesmere, Shropshire, SY12 0AW.
Residential Nursing Homes
The following care providers, residential and nursing homes are within or close to Ellesmere Town. Please check with the Care Quality Commission
for the latest details of providers and their care ratings -http://www.cqc.org.uk/
Care Providers in Ellesmere town include:
Ellesmere House, Church Hill, Ellesmere SY12 0HB
CQC Rating - Good March 2017.
33INFORMATION, INTELLI GENCE & INSIGHT
Housing
Fewer Ellesmere household spaces were
detached properties (35.4%) compared
to Shropshire as a whole (39.5%).
A larger percentage of household spaces
were semi-detached (38.2%) compared
to Shropshire as a whole (33.4%). This is
the largest housing type in Ellesmere as is
the case nationally. In Shropshire the
largest housing type was detached.
There were a greater proportion of
household spaces which were flat,
maisonette, or apartment in a
commercial building, (3.1%) compared to
Shropshire (1.1%).
Source: 2011 Census
34INFORMATION, INTELLI GENCE & INSIGHT
Housing Composition
31.4% of households were One Person Households greater than the Shropshire average (28.9%) and England (30.2%).
6.1% of households were Lone Parent with dependent children higher than the Shropshire average (5.2%) and similar to England (7.1%).
17.3% of households were One Person Pensioner aged 65 and over, greater than the Shropshire average of (13.9%) and England (12.4%).
15.2% of households were married couples with dependent children similar to the Shropshire average of (15.3) and England (15.3).
In Ellesmere, at the time of the 2011 Census, there were 1,927
households, 2,012 dwellings and 7 Communal Establishments housing
40 people. The largest proportion (39.6%) of houses in Ellesmere were
owned outright, similar to the Shropshire figure of 39%. 12.2% of
households were social rented housing, this was less than for
Shropshire as a whole (13.5%) and fewer than for England (17.7%).
There were slightly more houses privately rented 17.8% compared to
15% for Shropshire and 14% for England. In Ellesmere there are 228
registered social landlord (RSL) homes. These homes are owned by a
range of RSL’s including Meres and Mosses (part of Connexus Group).
Source: 2011 Census
35INFORMATION, INTELLIGENCE & INSIGHT
Housing
Median Median Median Lower Quartile Lower Quartile Lower Quartile The table shows affordability ratios for housing in
Area
Income House Affordability Income House Price Affordability Shropshire. The income data relates to Shropshire
Albrighton £33,850 £192,000 5.7 £18,602 £150,000 8.1 Place Plan areas which are a slightly broader
Bishop’s Castle £29,590 £219,225 7.4 £16,988 £143,250 8.4
geography than market towns, and take account of
hinterlands.
Bridgnorth £35,022 £188,250 5.4 £19,413 £155,125 8.0
Broseley £27,984 £209,500 7.5 £15,339 £151,875 9.9 The table shows that in Ellesmere a household with a
median household income of (£29,518) would need
Church Stretton £32,714 £230,000 7.0 £18,191 £170,000 9.3
5.3 times this income to afford a median priced house
Cleobury
£34,512.21 £188,750 5.5 £19,630 £130,000 6.6 (£155,000) as of year end 2016. This is lower than a
Mortimer
Craven Arms £30,365.87 £157,000 5.2 £17,010 £120,000 7.1 ratio of 6.6 for Shropshire and 7.5 for England.
Ellesmere area has one of the lowest ratios in
Ellesmere £29,518.61 £155,000 5.3 £16,578 £126,500 7.6
Shropshire.
Highley £25,350.87 £152,500 6.0 £14,540 £126,625 8.7
For households within the lower quartile household
Ludlow £26,811.17 £183,500 6.8 £14,899 £130,000 8.7
income (£16,578) the affordability ratio for a lower
Market Drayton £30,432.12 £158,000 5.2 £16,805 £125,625 7.5
quartile priced house (£126,500) was 7.6, lower than
Much Wenlock £35,513.95 £279,000 7.9 £19,755 £220,000 11.1
for Shropshire as a whole with 9.0 and England, 8.9.
Oswestry £28,067.70 £147,500 5.3 £15,662 £117,988 7.5
Shifnal £30,944.45 £230,998 7.5 £16,783 £169,950 10.1
*Lower quartile house prices and earnings are used together to
Shrewsbury £29,931.71 £190,000 6.3 £16,540 £150,000 9.1 indicate how affordable it is for people on low incomes to afford
Wem £31,076.24 £164,000 5.3 £17,406 £135,750 7.8 a house in Shropshire.
Whitchurch £27,109.93 £173,500 6.4 £15,207 £125,250 8.2
England £30,014.59 £224,000 7.5 £16,216 £145,000 8.9
Shropshire £30,052.83 £197,998 6.6 £16,680 £150,000 9.0
Source: Shropshire/England House Price Figures—ONS House Price Datasets, CACI Paycheck Data, DCLG Land Registry Price Paid Data. Year end 2016
36INFORMATION, INTELLI GENCE & INSIGHT
Housing Developments
Shropshire’s Core Strategy (March 2011) sets out the strategic vision and objectives to guide development and growth for the period 2006-2026.
This includes a vision for Ellesmere.
Detailed proposals to deliver the strategic vision within the Core Strategy are contained within the Site Allocations and Management of
Development (SAMDev) document which together with the Core Strategy forms Shropshire’s Local Plan for 2006-2026.
Consultations on the Local Plan Review Preferred Scale and Distribution of Growth for the period to 2036 was presented to Cabinet on 18th
October 2017.
The following table shows progress and expectations with current site allocations:
Already
Housing Allocations Provision Expected Build Out Rate
Completed
2017-18 2018-19 2019-20 2020-21 2021-22 2022-23 2023-24 2024-25 2025-26 2026-32
Land South of Ellesmere 250 0 0 15 37 37 37 37 37 37 13 0
Windfall Sites 352 N/A N/A N/A N/A N/A N/A N/A N/A N/A N/A N/A
37INFORMATION, INTELLI GENCE & INSIGHT
Proposed Development Sites
38INFORMATION, INTELLI GENCE & INSIGHT
Education
Number school Free School English as an Ellesmere is a key local educational centre with pupils mainly
Market Town age children Meals (FSM) additional Language drawn from Ellesmere Town area but schools also attracts pupils
4-15 eligible (EAL) from the surrounding hinterland areas.
Albrighton 407 34 4 The town council area has one primary, one secondary and an
Bishops Castle 189 28 9 independent school.
Bridgnorth 1258 69 29 The percentage of children living in the town parish area who are
Broseley 547 34 4 eligible for free school meals is 11.5%. This is similar to the rate
Church Stretton 389 33 9 for Shropshire which is 10.74%.
Cleobury Mortimer 373 37 6 The percentage of children who have English as an additional
Craven Arms 299 45 22 language is 8.7%. This is higher than the overall rate of 4.64% in
Ellesmere 495 57 43 Shropshire.
Highley 384 43 10 The number of school aged children shown is the number
Ludlow 992 122 19 resident in the market town. This figure may differ from the
Market Drayton 1531 215 66 total number of pupils at school in the area due to children
Much Wenlock 334 32 9 attending schools within or outside of their school catchment
areas.
Oswestry 1986 226 188
Shifnal 819 55 16
Shrewsbury 8771 1001 390
Wem 777 71 61
Whitchurch 973 122 83
Total 21108 2266 979
39INFORMATION, INTELLI GENCE & INSIGHT
Ellesmere provides educational facilities for pupils which are mainly drawn from the Ellesmere Town area but schools also attracts pupils from the
surrounding hinterland areas.
The town council area has a primary and secondary school.
Primary Schools
Ellesmere Lakelands Primary School, Elson Rd, Ellesmere SY12 0BE - http://ellesmereprimaryschool.org.uk/
Net capacity of 420 with an approved annual admission of 60 pupils. The school has 335 pupils on roll (Jan 2017).
The % of pupils eligible, at any time in the past 6 years, for Free School Meals is 17.6%, lower than the national average of 24.7%.
The percentage of pupils whose first language is not English is 8.7% lower than the national average of 20.5%.
Ofsted Rating: Good – May 2016
Nearby rural schools include:
Criftins C of E Primary School and Welshampton C of E Primary School
Secondary Schools
Lakelands Academy School, Oswestry Rd, Ellesmere SY12 0EA - http://www.lakelandsacademy.org.uk/
Net capacity of 580 with an approved annual admission of 116 pupils. The school has 519 pupils on roll (Jan 2017).
The % of pupils eligible, at any time in the past 6 years, for Free School Meals is 24.1%, lower than the national average of 29.1%.
The percentage of pupils whose first language is not English is 3.3% lower than the national average of 15.7%.
Ofsted Rating: Good - Feb 2016
40INFORMATION, INTELLI GENCE & INSIGHT
Further Education College
There are no college facilities within Ellesmere Town however facilities are available in nearby Oswestry
North Shropshire College, Oswestry Campus, Shrewsbury Rd, Oswestry SY11 4QB - http://www.nsc.ac.uk/
Provider of Further Education services offering learning opportunities, including Apprenticeships, full-time programmes and part-time opportunities,
ranging from professional qualifications through to degree level. Facilities at Oswestry include;
Four hair and beauty salons meeting the latest professional standards.
Dedicated art studio, with ceramics and photography facilities.
Six computer classrooms plus graphics/multimedia workshop with a suite of Apple Macs.
Professional teaching kitchen and Scholars restaurant.
High-quality sports pitch, training pitch and Multi-Use Games Area.
Construction Centre.
Two fully-equipped Science laboratories.
Independent Schools
Ellesmere College SY12 9AB - https://www.ellesmere.com/about-us/ - independent education from year 3 to sixth form.
41INFORMATION, INTELLI GENCE & INSIGHT
Transport and Infrastructure
Ellesmere is located on the A495 which links Oswestry (10 miles) and Whitchurch (12 miles) . Local roads provide access north to Wrexham and
south to Shrewsbury.
Ellesmere is situated alongside the canal network with the Shropshire Union Llangollen Canal Branch passing the town.
Airports
The nearest main international airports to Ellesmere are
Manchester Airport, Manchester M90 1QX – 60 miles north of Ellesmere.
Liverpool Airport, Speke Hall Ave, Speke, Liverpool L24 1YD- 52 miles north of Ellesmere.
Light aircraft facilities are available at:
Shropshire Aero Club, Sleap Airfield, Harmer Hill, Shrewsbury SY4 3HE http://www.shropshireaeroclub.co.uk/ - 13 miles south of Ellesmere the
airport provides facilities for general aviation operators.
Broadband
Digital connectivity is viewed as an increasingly important factor for business success, and nowadays broadband speed is a vital consideration
when businesses are looking to relocate.
Superfast broadband is being rolled out across Shropshire, and all premises in Ellesmere have access, or will have access within the next two years,
to infrastructure that allows downloads speeds of at least 30 Mbps. All premises in Ellesmere (and throughout most of Shropshire) are supplied by
just one infrastructure provider.
42INFORMATION, INTELLI GENCE & INSIGHT
Community Safety
The crime domain comprises four
underlying indicators, each one
accounting for a proportion of the total
crime domain score. They are weighted
as:
Violence – 32.4%
Criminal damage – 26.5%
Theft – 22.2%
Burglary – 18.9%
Crime levels are low in Ellesmere, All
areas fall into the 6th or 8th most
deprived decile nationally.
Source: Index of Multiple Deprivation (IMD), Department of Communities and Local Government, crown copyright
2017
43INFORMATION, INTELLI GENCE & INSIGHT
Crime—Ellesmere Town Rural
Category of Crime Aug 16 Sept 16 Oct 16 Nov 16 Dec 16 Jan 17 Feb 17 Mar 17 Apr 17 May 17 Jun 17 Jul 17 Total %
ASB 17 20 18 21 14 12 6 12 13 15 18 33 199 38%
Bicycle Theft 0 0 0 0 1 0 0 0 0 0 0 0 1 0%
Burglary 1 4 1 1 0 6 6 3 6 1 3 0 32 6%
Criminal Damage &
7 3 6 6 7 3 2 1 3 4 5 0 47 9%
Arson
Drugs 1 0 0 1 0 0 0 0 0 0 0 1 3 1%
Other Crime 0 1 1 1 1 2 1 0 0 3 1 1 12 2%
Other Theft 2 3 3 3 1 1 1 4 3 1 1 3 26 5%
Possession of Weapon 0 1 1 1 0 0 0 0 0 0 0 0 3 1%
Public Order 0 1 0 0 1 0 2 0 1 1 4 4 14 3%
Robbery 0 0 0 0 0 0 0 0 0 0 0 0 0 0%
Shoplifting 0 0 0 1 0 0 2 0 0 0 0 0 3 1%
Theft from the Person 0 0 0 0 0 0 0 0 0 0 0 0 0 0%
Vehicle Crime 1 3 2 2 2 1 0 1 4 1 3 1 21 4%
Violence and Sexual
9 12 13 11 13 8 22 12 13 20 9 17 159 31%
Offences
520 100%
Source: https://www.police.uk/
Overall levels of crime in Shropshire are low. Town centres generally experience higher rates of crime through anti-social behaviour and
shoplifting. Police data shows that the highest category of crime in the Ellesmere area is anti-social behaviour which accounted for 38% of
reported crimes in the year to July 2017. Latest crime data and more precise details of localities and investigations can be found by using the
police crime map at https://www.police.uk/
44INFORMATION, INTELLI GENCE & INSIGHT
Additional Information
Produced and designed by the Information, Intelligence and Insight team of Shropshire Council
Whilst every effort has been made to ensure the accuracy of the information contained within this profile, Shropshire Council can not accept any
responsibility for errors or omissions. The inclusion of associations, organisations or facilities in this profile should not be taken as an
endorsement by Shropshire Council of the services offered.
Easy ways to get in touch
Telephone - 0345 678 9000
Email - commissioning.support@shropshire.gov.uk
Find out more information on Shropshire
For more information on Shropshire including ward profiles, population data, Shropshire Snapshots, economic data and reports - visit our
webpages at: https://new.shropshire.gov.uk/information-intelligence-and-insight/facts-and-figures/
45You can also read