Coronavirus Job Retention Scheme: statistics - By Brigid Francis-Devine, Andrew Powell 6 July 2021 - UK Parliament
←
→
Page content transcription
If your browser does not render page correctly, please read the page content below

By Brigid Francis-Devine,
Andrew Powell               Coronavirus Job Retention
6 July 2021                 Scheme: statistics

                            Summary
                            1  Overview – CJRS
                            2 Jobs furloughed
                            3 Cost
                            4 Impact on the labour market
                            5 Further Reading

                            commonslibrary.parliament.uk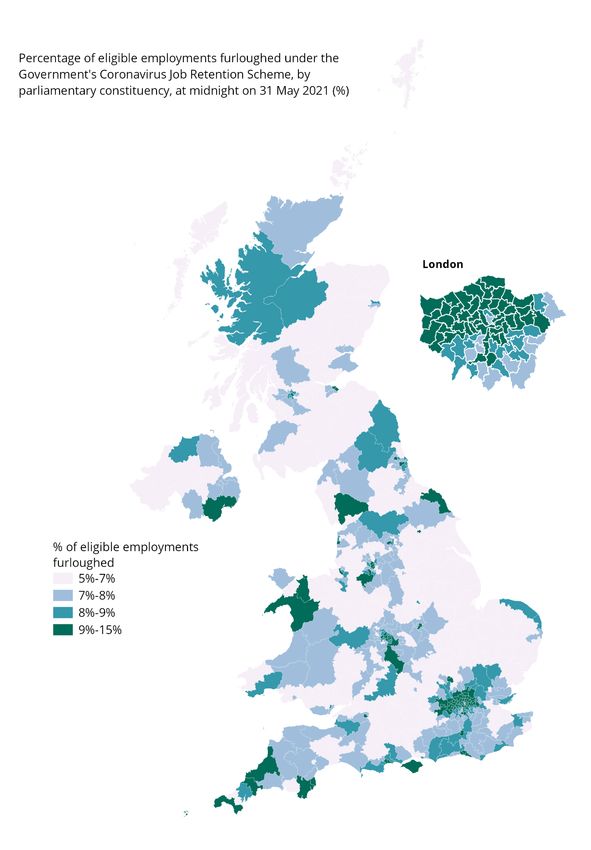
Number 9152                Coronavirus Job Retention Scheme: statistics

Disclaimer
The Commons Library does not intend the information in our research
publications and briefings to address the specific circumstances of any
particular individual. We have published it to support the work of MPs. You
should not rely upon it as legal or professional advice, or as a substitute for
it. We do not accept any liability whatsoever for any errors, omissions or
misstatements contained herein. You should consult a suitably qualified
professional if you require specific advice or information. Read our briefing
‘Legal help: where to go and how to pay’ for further information about
sources of legal advice and help. This information is provided subject to the
conditions of the Open Parliament Licence.

Feedback
Every effort is made to ensure that the information contained in these publicly
available briefings is correct at the time of publication. Readers should be
aware however that briefings are not necessarily updated to reflect
subsequent changes.

If you have any comments on our briefings please email
papers@parliament.uk. Please note that authors are not always able to
engage in discussions with members of the public who express opinions
about the content of our research, although we will carefully consider and
correct any factual errors.

You can read our feedback and complaints policy and our editorial policy at
commonslibrary.parliament.uk. If you have general questions about the work
of the House of Commons email hcenquiries@parliament.uk.

                           2                                              Commons Library Research Briefing, 6 July 2021
Coronavirus Job Retention Scheme: statistics Contents Summary 5 1 Overview – CJRS 7 2 Jobs furloughed 8 2.1 Sector 9 2.2 Employer size 11 2.3 Age and gender 12 2.4 Furlough type 13 2.5 Region and nation 14 2.6 Constituency 15 3 Cost 17 3.1 Cost by Sector 18 4 Impact on the labour market 19 4.1 September 19 4.2 November 20 4.3 International comparisons 20 5 Further Reading 21 5.1 House of Commons Library 21 5.2 Other sources 21 3 Commons Library Research Briefing, 6 July 2021
Coronavirus Job Retention Scheme: statistics

4                                              Commons Library Research Briefing, 6 July 2021
Coronavirus Job Retention Scheme: statistics

Summary

This paper provides statistics and analysis of the Coronavirus Job Retention
Scheme.

The Coronavirus Job Retention Scheme applied from 1 March 2020 and is
currently due to end at the end of September 2021. The scheme provides
grants to employers so they can retain and continue to pay staff during
coronavirus related lockdowns, by furloughing employees at 80% of their
wages.

By midnight on 14 June 2021, 11.6 million employee jobs had been furloughed
through the Government's job retention scheme, at a cost of £65.9 billion.

Furlough levels largely rise and falls with changes in lockdown restrictions
and changes to the CJRS scheme. The number of jobs furloughed peaked in
June, fell throughout the summer and then increased in November and again
in January after national lockdowns were introduced, and started to fall in
March-May 2021.

Sectors
Some sectors have been much more affected by the coronavirus pandemic,
and this is reflected in furlough levels. As at 31 May 2021, the three sectors
with the highest furlough rates were the Accommodation and food services
sector, with 34% (133,000) of eligible jobs on furlough, the Arts,
entertainment and recreation sector with 29% (41,700) of jobs on furlough,
and the Other service activities, with 19% (94,200) of eligible jobs on
furlough.

These three sectors had by far the highest furlough rates at the end of May
2021: all other sectors had rates of 11% or less.

Age and gender
Those aged 24 and under had the highest proportion of furloughed jobs, and
women under 18 were more likely to be furloughed than men.

Full and partial furlough
From 1 July 2020, the furlough scheme was made more flexible so that
furloughed employees could be brought back part-time. Over summer 2020,
the number of jobs partially furloughed rose as jobs fully furloughed fell, as
lockdown restrictions eased, and employees were more able to go to work
some of the time. The announcement of the November lockdown caused a

5                                              Commons Library Research Briefing, 6 July 2021
Coronavirus Job Retention Scheme: statistics

much sharper increase in full furlough, and this happened again when the
January 2021 lockdown began.

Impact on the labour market
It is clear that the CJRS has been instrumental to avoiding a large rise in
unemployment. In April 2020, the OBR published a reference scenario where
unemployment would peak at 10.0% in Q2 2020. In reality, the highest rate of
unemployment in 2020 was 5.1% in Q4.

6                                              Commons Library Research Briefing, 6 July 2021
Coronavirus Job Retention Scheme: statistics

1   Overview – CJRS

    The Coronavirus Job Retention Scheme applied from 1 March 2020 and is
    currently due to end at the end of September 2021. The scheme provides
    grants to employers so they can retain and continue to pay staff during
    coronavirus related lockdowns, by furloughing employees at (currently) 80%
    of their wages. 1

    More information on the Job Retention Scheme can be found in the Library
    briefing, FAQs: Coronavirus Job Retention Scheme.

    By midnight on 14 June 2021, 11.6 million employee jobs had been furloughed
    through the Government's job retention scheme, at a cost of £65.9 billion. 2

        Coronavirus Job Retention Scheme (CJRS)
        The scheme opened on the 20 April 2020
        By midnight on 14 June 2021
        Number of jobs furloughed                                 11.6 million
        Number of employers furloughing                            1.3 million
        Total claimed (£)                                         £65.9 billion

        Notes

        Jobs furloughed' is calculated as the sum of the maximum number of
        employees furloughed by any PAYE scheme across all claims by that
        scheme

        Employers furloughing is calculated by counting the number of CJRS
        claims from distinct PAYE schemes on employer reference (where the
        PAYE scheme reference is a proxy for a single employer)

    Source: Gov.uk, HMRC coronavirus (COVID-19) statistics

        1 Related Library briefings
            •    FAQs: Coronavirus Job Retention Scheme
            •    Coronavirus: impact on the labour market
            •    Coronavirus business support schemes: statistics
            •    People claiming unemployment benefits by constituency
            •    Youth unemployment

    1
      In September, the government covered 70% of employee’s wages, and in October it covered 60%,
        before reverting to 80% from the start of November.
    2
      Gov.uk, HMRC coronavirus (COVID-19) statistics, 3 June 2020

    7                                                         Commons Library Research Briefing, 6 July 2021
Coronavirus Job Retention Scheme: statistics
2 Jobs furloughed
The chart below shows the total number of jobs that were on furlough on each
day from the 1 March 2020 to 31 May 2021.
Chart 1
Furloughed jobs by day
1 March 2020-31 May 2021, millions
10
9 National
Restaurants, pubs lockdown
8 and hotels reopen announced (4
(4 July) January 2021)
7
All retail can
CJRS due to
6 reopen (15
end (30 April)
June)
5
4
3 'Eat out to help
out' scheme National
2
(3 August) lockdown (2
1 Nov- 2 Dec)
0
Mar Apr May Jun Jul Aug Sep Oct Nov Dec Jan Feb Mar Apr May
Source: HMRC, Coronavirus Job Retention Scheme statistics, 1 July 2021
April and May 2020: Over 8 million jobs were on furlough throughout April
and May, with a peak of 8.9 million jobs on furlough on 8 May.
June: Numbers dropped by 13% at the start of June, partly because the CJRS
was due to end at the end of May, and partly because of the easing of
lockdown restrictions. Furloughed jobs declined steadily in June and dropped
again at the end of the month, partly in response to a change to the scheme
which meant employers could only furlough employees for whom they had
already successfully claimed a grant. 6.8 million jobs were on furlough at the
end of June.
July and August: 5.4 million were on furlough at the end of July and this
figure dropped to 3.8 million by 31 August. This fall was driven by the
Accommodation and food services sector, which saw a fall of 237,600
employee jobs on furlough between 31 July and 1 August, 20% of the total
decrease. This coincided with the start of the Government’s Eat Out to Help
Out Scheme, which ran throughout August.
8 Commons Library Research Briefing, 6 July 2021Coronavirus Job Retention Scheme: statistics
September and October: Numbers gradually decreased in September, at
least partly because of a reduction in the level of government contribution to
employee wages at the end of August. This decline continued through
October, as the scheme was due to end at the end of the month. At the end of
October, 2.4 million jobs were still furloughed on the scheme, a decline of
73% from the peak in May.
November and December: The tightening of restrictions for the November
national lockdown meant the number of jobs furloughed increased by 1.3
million between 31 October and 1 November, the largest daily increase since
the 1 April. The number remained steady during December, with 4.0 million
jobs on furlough on the 31 December.
January to May 2021: The third national lockdown began on 4 January,
causing another increase in the number of furloughed jobs, with 4.9 million
furloughed at the end of January. Since then the number of furloughed jobs
has been gradually falling. On 28 February, 4.7 million jobs were on furlough,
4.2 million were on furlough on 31 March, and 3.4 million were on furlough on
30 April 2021. There was a sharp drop on 1 May, the day that the scheme was
due to end before it was extended March 2021 Budget, and 2.4 million were
on furlough on 31 May 2021.
The chart above shows that furlough levels increased at the beginning of the
second and third national lockdown, but remained well below levels during
the first lockdown. This is partly because sectors like Construction,
Manufacturing and Property were shut down in the first lockdown, but
continued to operate in lockdowns 2 and 3. Another reason could be that
businesses and employees had begun to adapt to lockdown, and found ways
to continue working.
2.1 Sector
Some sectors have been disproportionately affected, and this is reflected in
the proportion of eligible jobs furloughed in each sector.
Jobs on furlough as at 31 May
As at 31 May 2021, the three sectors with the highest furlough rates were the
Accommodation and food services sector, with 34% (133,000) of eligible jobs
on furlough, the Arts, entertainment and recreation sector with 29% (41,700)
of jobs on furlough, and the Other service activities, with 19% (94,200) of
eligible jobs on furlough. 3
These three sectors had by far the highest furlough rates at the end of May
2021: all other sectors had rates of 11% or less. This reflects the variety of
3
Note that the sector is unknown for around 48,000 furloughed employee jobs.
9 Commons Library Research Briefing, 6 July 2021Coronavirus Job Retention Scheme: statistics
restrictions on different sectors: the Accommodation and food services sector
(34%) has been largely shut down during lockdowns, whereas Public
Administration and defence (0%), has been allowed to continue without
much interruption.
Chart 2
Percentage of eligible jobs furloughed by sector
At at 31 May 2021
Public administration and defence;…
Energy production and supply
Households
Mining and quarrying
Finance and insurance
Education
Health and social work
Water supply, sewerage and waste
Agriculture, forestry and fishing
Information and communication
Manufacturing
Wholesale and retail; repair of motor…
Professional, scientific and technical
Total
Real estate
Administrative and support services
Construction
Transportation and storage
Other service activities
Arts, entertainment and recreation
Accommodation and food services
0% 10% 20% 30% 40%
Source: HMRC, Coronavirus Job Retention Scheme statistics, 1 July 2021
Furlough by day and sector
The number of furloughed jobs has followed a similar pattern over time in
each sector, with all sectors experiencing decreases when changes in
schemes or lockdown rules were eased and increases when the national
lockdowns are announced.
Some sectors have seen a larger decrease in the number of jobs furloughed
than others. The Wholesale and retail sector had the most furloughed jobs in
March and April 2020, but these numbers fell quickly as shops re-opened, as
shown in the chart below.
In comparison, the number of furloughed jobs in the Arts, entertainment and
recreation sector has remained more static, as much of the sector has
remained under restrictions.
10 Commons Library Research Briefing, 6 July 2021Coronavirus Job Retention Scheme: statistics
The Accommodation and food, and Wholesale and retail sectors saw the
largest proportional increases in jobs furloughed from the 31 October to 1
November 2020. The Accommodation and food service sector saw an increase
of 81% (490,100) whilst Wholesale and retail saw an increase of 53%
(84,300).
At the beginning of January, there was an increase in furlough levels in all
sectors. However, some of the largest increases were seen in sectors which
had been open in December such as education, which saw a 90% increase
when schools closed, and Wholesale and retail, which saw a 32% increase
once non-essential retail closed after Christmas.
Furlough rates in all sectors have been gradually decreasing since January
2021.
Chart 3
Jobs furloughed by day in most affected sectors
23 March 2020 - 31 May 2021, millions
2.0
Wholesale and retail
1.8
1.6
Accommdation and food
1.4
services
1.2
1.0
Manufacturing
0.8
0.6
0.4
Construction
0.2
Arts, entertainment and recreation
0.0
Mar May Jun Jul Aug Sep Oct Nov Dec Jan Feb Mar Apr May
Source: HMRC, Coronavirus Job Retention Scheme statistics, 1 July 2021
2.2 Employer size
Furlough rates vary by employer size, and at 31 May 2021, employers with 2-4
employees had the highest furlough rate, at 24%.
The largest employers saw the biggest rise in furlough levels as a result of the
January lockdown, but have also seen the largest falls from the end of
January to the end of April.
11 Commons Library Research Briefing, 6 July 2021Coronavirus Job Retention Scheme: statistics
Chart 4
Jobs furloughed by employer size
Take up rate as at 31 December 2020 and 31 May 2021
As at 31 January 2021 At 31 May 2021
40%
30%
20%
10%
0%
1 2 to 4 5 to 9 10 to 19 20 to 49 50 to 99 100 to 249 250+
Source: HMRC, Coronavirus Job Retention Scheme statistics, 1 July 2021
2.3 Age and gender
Jobs on furlough as at 31 May
On the 31 May 2021, 8% of jobs held by women and 8% of jobs by men were on
furlough.
Those aged 24 and under had the highest proportion of furloughed jobs. 13%
of eligible jobs held by people under the age of 18 were furloughed, whilst
10% of eligible jobs held by people aged 18-24 were furloughed.
For under 18s, jobs held by women were more likely to be furloughed.
The age group with the highest number of jobs furloughed was the 25-34 year
olds, with 515,900 jobs on furlough at 31 May 2021.
12 Commons Library Research Briefing, 6 July 2021Coronavirus Job Retention Scheme: statistics
Chart 5
Percentage of jobs furloughed Number of jobs furloughed
By age and gender, as at 31 May 2021 By age and gender, as at 31 May 2021, thousands
15%
Women 300 Women
250
Men Men
10%
200
150
5% 100
50
0% 0
Under 18 to 25 to 35 to 45 to 55 to 65+ Under 18 to 25 to 35 to 45 to 55 to 65+
18 24 34 44 54 64 18 24 34 44 54 64
Source: HMRC, Coronavirus Job Retention Scheme statistics, 1 July 2021
2.4 Furlough type
From 1 July 2020, the furlough scheme was made more flexible so that
furloughed employees could be brought back part-time. 4 Businesses can now
decide the hours and shift patterns of their employees – with the government
continuing to pay 80% of salaries for the hours they do not work. 5
As shown in the chart below, jobs partially furloughed follows a similar trend
to jobs fully furloughed. The trends started to converge over the summer as
lockdown restrictions eased and employees were more able to go to work
some of the time, but the announcement of the November lockdown caused a
much sharper increase in full furlough, and this happened again when
January lockdown began. In March-April 2021, partial furlough increased
slightly as full furlough fell, and by 31 May 2021 they were at a similar level.
4
HM Treasury, Chancellor extends furlough scheme until October, 12 May 2020
5
HM Treasury, Flexible furlough scheme starts today, 1 July 2020
13 Commons Library Research Briefing, 6 July 2021Coronavirus Job Retention Scheme: statistics
Chart 6
Jobs furloughed by day - Full and partial furlough
1 July 2020 - 31 May 2021, millions
5.0
4.0
3.0
Full furlough
2.0
1.0
Partial furlough
0.0
Source: HMRC, Coronavirus Job Retention Scheme statistics, 1 July 2021
2.5 Region and nation
The number and proportion of eligible jobs that were still on furlough as at 31
May 2021 varies slightly between the different countries and regions of the UK.
London had the highest furlough rate, at 14% (551,300). All other regions and
nations had a furlough rate between 10% and 12%. 6
6
Note that for 201,000 furloughed jobs, the region was unknown.
14 Commons Library Research Briefing, 6 July 2021Coronavirus Job Retention Scheme: statistics
Chart 7
Jobs furloughed by region and nation - Full and partial
furlough
As at 31 May 2021. thousands
London
South East
North West
East of England
West Midlands
South West
Full furlough
Scotland
Partial furlough
Yorks & Humber
East Midlands
Wales
North East
Northern Ireland
0 100 200 300 400
Source: HMRC, Coronavirus Job Retention Scheme statistics, 1 July 2021
2.6 Constituency
The map below shows furlough rates at 31 May 2021 by constituency. Furlough
rates range from 5% to 15%, with a UK average of 12%. The excel download
attached to this paper provides furlough rates by constituency.
15 Commons Library Research Briefing, 6 July 2021Coronavirus Job Retention Scheme: statistics constituency. 16 Commons Library Research Briefing, 6 July 2021
Coronavirus Job Retention Scheme: statistics

3                       Cost

                        The total cost of the CJRS up to 31 May 2021 was £65.5 billion.
Up to May 2021, the
total value of claims   The chart below shows the total value of claims made to the Coronavirus Job
made to the CJRS        Retention Scheme in each month from June 2020 to May 2021.
reached £65.5           From the start of the CJRS to the 31 May 2020, the total value of the claims
billion                 made was £17.5 billion. The value of claims peaked at £9.8 billion in July, then
                        fell sharply to £3.0 billion in August and continued to fall to £2.0 billion in
                        October. This fall in the value of claims mirrors the fall in the number of jobs
                        furloughed in these months.

                        The fall in value from August to October can be at least partly attributed to a
                        reduction in the level of government contribution to employee wages at the
                        end of August: in September, the government covered 70% of employee’s
                        wages, and in October it covered 60%, before reverting to 80% from the start
                        of November.

                        The value of claims increased to £3.1 billion in November, during tighter
                        national restrictions, fell to £3.0 billion in December, and increased to £3.9
                        billion in January and February following the January lockdown. The cost fell
                        in March, April and May reflecting the fall in the number of furloughed jobs.

                        Chart 8

                             Total value of claims made to the CJRS by month
                             June 2020-May 2021, £ billion

                             10
                              9          £9.8
                              8   £9.0
                              7
                              6
                              5
                              4
                              3                                                        £3.9      £4.0   £3.6
                              2                 £3.0                    £3.1    £3.0
                                                                                                               £2.6
                              1                         £2.2    £2.0                                                  £1.9

                                   Jun    Jul    Aug     Sep     Oct    Nov     Dec     Jan      Feb    Mar    Apr    May

                        Source: HMRC, Coronavirus Job Retention Scheme statistics, 1 July 2021

                        17                                                     Commons Library Research Briefing, 6 July 2021
Coronavirus Job Retention Scheme: statistics
3.1 Cost by Sector
The value of claims made to the scheme varies across sectors. The table
below shows the breakdown of the total value of the claims made to the CJRS
by sector.
Cost by sector largely mirrors the number of furloughed workers by sector.
The value of the claims made to the scheme overall until the end of April 2021
was highest in the Wholesale and retail sector, totalling £11.67 billion.
Between November and April, the Accommodation and food service sector
has had the highest value of claims, at £5.1 billion.
The sector with the lowest total value of claims was the Households sector, at
£58 million, The Mining and quarrying sector had the lowest value of claims in
November-March, at £12 million.
Value of claims made on the CJRS by sector
£, millions
1 November to Total (up to 31
31 May 2021 May 2021)
Wholesale and retail; repair of motor vehicles 3,986 11,930
Accommodation and food services 5,456 12,312
Manufacturing 1,573 6,792
Administrative and support services 1,920 6,039
Construction 1,317 5,125
Professional, scientific and technical 1,465 4,819
Transportation and storage 1,249 3,785
Arts, entertainment and recreation 1,411 3,384
Health and social work 673 2,258
Other service activities 975 2,246
Information and communication 670 1,986
Education 588 1,911
Real estate 338 1,091
Finance and insurance 172 571
Unknown and other 259 383
Water supply, sewerage and waste 77 306
Agriculture, forestry and fishing 83 213
Energy production and supply 19 116
Mining and quarrying 13 112
Public administration and defence 31 85
Households 15 59
Total 22,290 65,524
Source: HMRC, Coronavirus Job Retention Scheme statistics, 1 July 2021
18 Commons Library Research Briefing, 6 July 2021Coronavirus Job Retention Scheme: statistics
4 Impact on the labour market
It is clear that many of the workers on furlough would have been made
redundant if the scheme had not been in place, and that the CJRS has limited
the impact of the pandemic on the labour market.
In April 2020, the Office for Budget Responsibility (OBR) published a reference
scenario where unemployment would peak at 10.0% in Quarter 2 2020, falling
to 8.5% and 7.0% in Quarter 3 and Quarter 4. In reality, the highest rate of
unemployment in 2020 was 5.1% in Quarter 4. The CJRS has also played a
large part in unemployment rates staying much lower than expected in 2020.
The scheme has also played a role in keeping workers matched to their
employers, which means once lockdown lifts, the time and money spent on
recruitment, induction and training will be minimised for these employers. 7
The Bank of England expects the vast majority of furloughed employees to go
back to their regular working hours as the economy recovers. 8
4.1 September
As the economy opened up over the summer, the scheme was being wound
down before the Chancellor’s decision to extend it. The reaction of employers
to this wind down gives us a glimpse of how many jobs were protected by the
CRJS.
The Resolution Foundation found that more than half (55%) of those
furloughed during the first lockdown had returned to work by September, with
a third still on furlough and 9% no longer working. This was a higher rate of
job exit than of those who were not furloughed. This rate was particularly high
for those aged 18-24 (19%), those in insecure work (22%), worker from
minority ethnic groups (22%) and those in hospitality (15%). 9 This suggests
that the CJRS is protecting vulnerable jobs.
7
Resolution Foundation, Long Covid in the labour market, The impact on the labour market of Covid-19
a year into the crisis, and how to secure a strong recovery, 17 February 2021
8
Bank of England, Monetary Policy Report, 4 February 2021.
9
Resolution Foundation, Jobs, jobs, jobs, Evaluating the effects of the current economic crisis on the UK
labour market, 27 October 2020
19 Commons Library Research Briefing, 6 July 2021Coronavirus Job Retention Scheme: statistics
4.2 November
November saw the lowest number of planned redundancies since the start of
the coronavirus pandemic, which suggests that the Chancellor’s decision to
extend the scheme until 30 April 2021 helped to protect jobs. 10
Weekly data suggested that unemployment remained fairly flat in November,
despite a national lockdown, which suggests the scheme limited the rise in
unemployment. 11
4.3 International comparisons
It is difficult to directly compare policy responses between countries, but in
general, countries which implemented employment support schemes have
seen smaller increases in unemployment rates than countries which did not.
In the US, where an equivalent employment support scheme did not exist,
unemployment rates rose from 3.6% in January 2020, to a record high of
14.7% in April 2020. 12
In contrast, national governments of euro area countries implemented
extensive employment support programmes, and between February and
October 2020, the unemployment rate in the euro area increased by only 1.2
percentage points to 8.4%, with a peak of 8.7% in July. 13
10
BBC News, Redundancy plans fall after furlough extension, 23 December 2020
11
Financial Times, UK job losses slow as furlough scheme helps limit unemployment rise, 26 January
2021.
12
Economic Policy Institute, What the next president inherits, 6 November 2020.
13
European Central Bank, The impact of the COVID-19 pandemic on the euro area labour market,
December 2020.
20 Commons Library Research Briefing, 6 July 2021Coronavirus Job Retention Scheme: statistics
5 Further Reading
5.1 House of Commons Library
FAQs: Coronavirus Job Retention Scheme
Coronavirus: impact on the labour market
Coronavirus business support schemes: statistics
Coronavirus: Support for businesses
Coronavirus: Getting people back into work
5.2 Other sources
Long Covid in the labour market, The impact on the labour market of Covid-19
a year into the crisis, and how to secure a strong recovery
17 February 2021 Resolution Foundation
Labour market priorities for the 2021 Budget
14 January 2021| Institute for Employment Studies
The impact of the COVID-19 pandemic on the euro area labour market,
December 2020 | European Central Bank
The future of pandemic support for households
16 February | Institute for Fiscal Studies
21 Commons Library Research Briefing, 6 July 2021The House of Commons Library is a research and
information service based in the UK Parliament.
Our impartial analysis, statistical research and
resources help MPs and their staff scrutinise
legislation, develop policy, and support constituents.
Our published material is available to everyone
on commonslibrary.parliament.uk.
Get our latest research delivered straight to your inbox.
Subscribe at commonslibrary.parliament.uk/subscribe
or scan the code below:
commonslibrary.parliament.uk
@commonslibraryYou can also read