Corporate Presentation - NDR NY - September, 2019 - Suzano/RI
←
→
Page content transcription
If your browser does not render page correctly, please read the page content below
Corporate Presentation – NDR NY
                 September, 2019

                                   1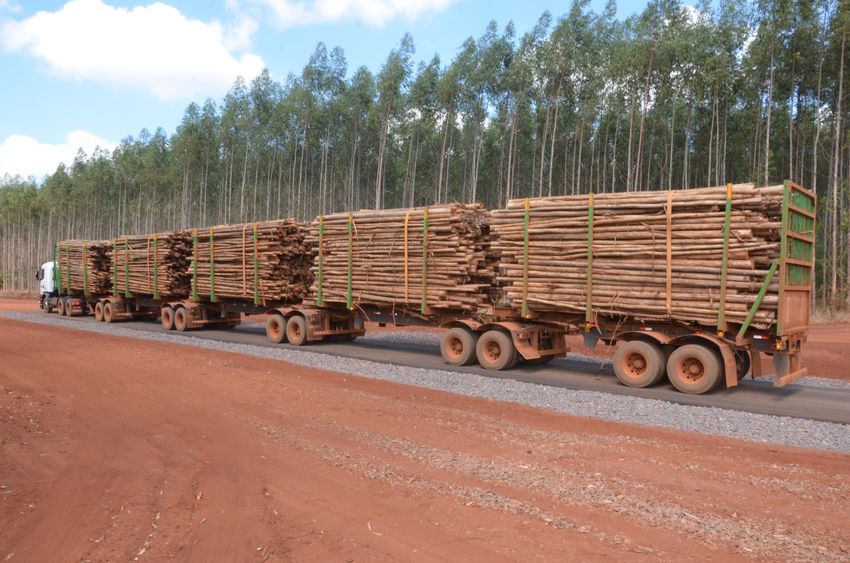
Disclaimer
This communication contains certain statements that are “forward-looking statements” within the meaning of Section 27A of the
Securities Act and Section 21E of the Securities Exchange Act of 1934, as amended. Some of these forward-looking statements are
identified with words like “believe,” “may,” “could,” “would,” “might,” “possible,” “will,” “should,” “expect,” “intend,” “plan,” “anticipate,”
“estimate”, “potential”, “outlook” or “continue,” the negative of these words, other terms of similar meaning or the use of future
dates. Forward-looking statements in this communication include, without limitation, statements regarding the implementation of
operating and financing strategies and initiatives, including with respect to the integration of Fibria’s operations and expected
potential synergies, plans with respect to capital expenditures, and factors or trends affecting financial condition, liquidity or
results of operations. Such statements reflect the current views of management and are subject to a number of risks and
uncertainties, including changes in prices and customer demand for our products, changes in raw material costs, pricing actions by
competitors, changes in the rates of exchange of the Brazilian real against the US dollar, and general changes in the economic
environment in Brazil, emerging markets or internationally. Such forward-looking statements are qualified by the inherent risks
and uncertainties surrounding future expectations generally, and actual results could differ materially from those currently
anticipated due to such risks and uncertainties. There is no guarantee that the expected events, trends or results will actually occur.

The statements information, opinions and forward-looking statements contained in this presentation speak only as at the date of
this presentation and should thus be considered in the context of the circumstances prevailing at the time. They are based on many
assumptions and factors, including general economic and market conditions, industry conditions, and operating factors, and are
subject to change without notice. Any changes in such assumptions or factors could cause actual results to differ materially from
current expectations. Suzano does not undertake any obligation to update any information, opinion or forward-looking
statements as a result of new information, future developments or otherwise, except as expressly required by law. All information,
opinions and forward-looking statements in this communication are qualified in their entirety by this cautionary statement.
                                                                                                                                                  2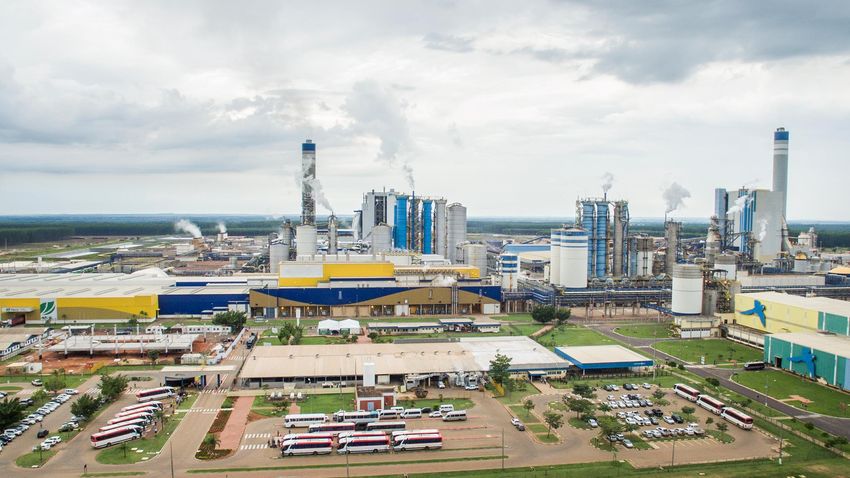
The New Suzano

                 3
An

                      first class
                      assets base

         Our plantations

hectares of planted
and certified areas                    Geographically                eucalyptus genetic base
equivalent to 200x Manhattan

                               areas
    m³/ha/year                                          structural                    harvesting and
average productivity                                    average radius                inbound logistics
                                                                                                          4
An
first class
assets base
Our mills
MWm
average pulp
equivalent to supply chain
tons of tons of 1.4 mn
market pulp paper people town
5An
first class
assets base
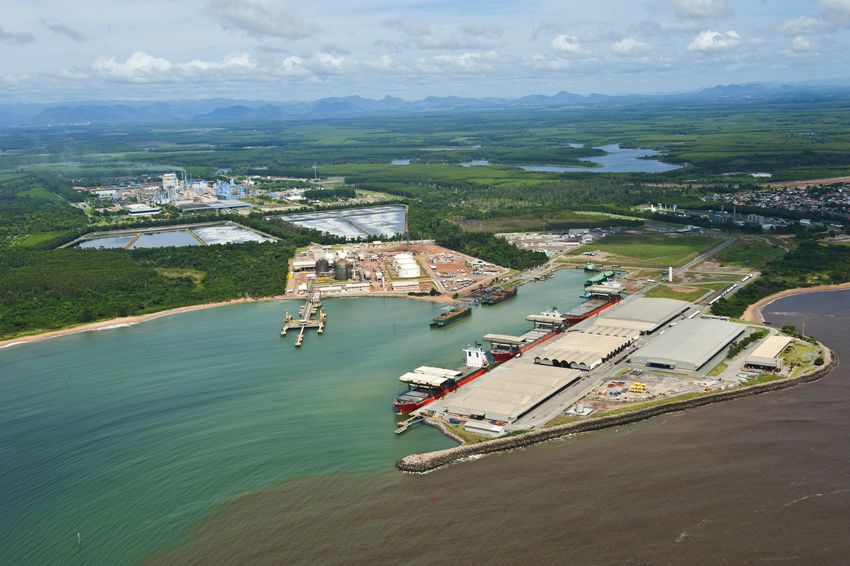
Our logistics
mills fully
either close to shore export
or railway connected pulp
served
6An
first class
assets base
Paper business
pulp go-to-market Brazilian clients Brazilian
integrated model brands market share¹
¹ Addressable market.
7Fully integrated
Plantation
Mill
Railway
Port
8Undisputable
in the pulp industry
Cash Cost(¹) Top 10(²)
Hardwood Softwood
Suzano 10,9
APP + PE 3,8
CMPC 3,7
459 462
435 442 442 Arauco 3,1
391 April 2,8
361 367
341
293 286
Metsa 2,7
UPM 2,6
225
Stora Enso 2,1
Mercer 2,0
Ilim 1,8
Brazil
Europe
US/Canada
Indonesia
Canada/US
China
Other Asia/Japan
Chile
Other World
East Europe
Chile/Uruguay
Other Europe
¹ Source: Hawkins Wright December 2018 (CIF Europe – USD/ton).
² Market pulp capacity production including hardwood and softwood volumes.
9Consistently
cash cost
R$/ton¹
709 690 668
622
2015 2016 2017 2018
¹ Cash production cost ex-downtimes. Pro forma basis of Suzano Papel e Celulose and Fibria Celulose cash production cost (R$/ton). Figures are adjusted by Brazilian inflation (IPCA) which represents R$ 104/t in
2015, R$ 52/t in 2016 and R$ 57/t in 2017.
10Synergies
11Structural competiti venes s
boosted by
Capture Profile1
100%
90%
Operational Synergies G&A
Supply Chain
40%
R$800MM R$900MM Forestry
per year¹
Industrial
¹ Total Steady State. Dec / 2019 Dec /2020 Dec /2021
12Structural competiti venes s
boosted by
Selected Logistic /
examples Industrial Forestry Commercial Procurement G&A
Reduction in Wood supply Routes Contractual Organizational
Initiative products (SKUs) optimization Optimization parameters Structure
per plant equalization adjustment
Lower consumption Wood Operational scale Lower cost in Headcount
of chemicals logistics cost expansion industrial and reduction
Benefit reduction forestry inputs
Higher OEE¹ Transshipment and fuel
costs reduction
¹ Overall equipment effectiveness
13Adjusted Balance Average² annual deductible Accounting effect:
Sheet to fair value¹ R$ 18.4 bn expenses of R$1.2 bn¹ EBT reduction
Preliminary Average3 annual fiscal Tax effect:
Goodwill¹ R$ 8.1 bn deduction of R$0.8 bn¹ taxable base reduction
Total R$ 26.5 bn
¹ Based on preliminary PPA as disclosed on 2018 Financial Statements – Note 32 (ii).
² Estimate considering preliminary 10 years depreciation period.
³ Estimate considering preliminary 10 years fiscal amortization period.
14Resulting Company
15mostly from international markets
3% 15%
Others Specialties
Net revenues (US$ billion) 8.7
7.0
Americas
6.1 6.1
5.6 Pulp
Europe
Asia
57% 25%
Tissue P&W
2014 2015 2016 2017 2018
Note: The data represents simple sum out of the sold volumes
Note: Pro forma figures of Suzano and Fibria historical data. of Suzano + Fibria and also considers Klabin’s volumes.
Average exchange rate of R$ 2.35 in 2014, R$ 3.33 in 2015, R$ 3.49 in 2016, R$ 3.19 in 2017 and R$ 3.65 in 2018. 16Adjusted EBITDA¹ and Margin¹ Operational Cash Generation²
R$ and US$ million and (%) R$ and US$ million
1
25.000 60%
20.000
52%
0,9
20.000
48% 50%
0,8
16,361
0,7
12,481
15.000
14,799 10,920
40%
0,6
15.000
0,5
30%
10.000
0,4
10.000
20%
0,3
4,477 3,830
5.000
3,415 2,826
0,2
5.000
10%
0,1
0 0% 0 0
2018 LTM2Q19 2018 LTM2Q19
¹ Excludes sales from the commercial agreement with Klabin. ² Operational Cash Generation = Adjusted EBITDA less Sustaining CAPEX. Note: for 2018 and LTM 2Q19 data is pro forma, considering
the sum of the results of the companies, or weighted where applicable 17Revenue 88% USD Hedging Policy
COGS 20% USD Operating Hedge Debt Hedge
Target: up to 75% of the Target: Net debt
SG&A 27% USD following 18 months 100% denominated
Sustaining in USD
11% USD Current: 74% of
Capex net exposure²
Sensitivity¹
~ R$ 700 million
EBITDA
~ R$ 600 million
¹ Sensitivity at each R$ 0.10/US$ variation
Operational Cash ² Net exposure as of August 2019.
Generation
18debt profile
Pro-forma³ Amortization Schedule
(US$ million)¹
average debt maturity
8,128
2,841
2,416 Average Cost (US$)²:
RCF
761
500 Non-Trade
7,546
1,548 Finance
1,314
938 707
2.080 517 1.916
728 711
Cash on
hand
216
512
873 344
797 841 581
Trade US$ 15.8 bn
367 Finance
65
3
Liquidity 2019 2020 2021 2022 2023 2024 2025
onward
77% from 2023 onwards
¹ PTAX of 3.8322 R$/US$ (06/30/2019)
² Total average cost in US$ considering the debt in BRL adjusted by the market swap curve. (vs. 55% 1Q19)
3 Liquidity position as @2Q19
Figures from the closing of the 1Q19 for comparison purposes. 197%
Non Trade Finance 30%
Related Bank
Local
Counterpart
Sources
70%
International
44% 32% 17%
International
Trade Finance
Related Bank
Local Capital and
Capital Markets Markets
As of June 30, 2019.
Funding sources
20Policies
Indebtedness
Net Debt/EBITDA Ratio (in US$):
1.0x to 3.0x 1.0x to 3.5x
Normal Cycle Investment Cycle
Dividend
The lowest between:
25% of the net income or
10% of the Operational Net Debt (US$ billion)
Cash Flow Generation¹
13.7 10
Leverage US$
(Net Debt / Adj. EBITDA)²
3.6x
Jun-19³ Long-Term Target
¹ Operational Cash Flow = Adjusted EBITDA – Sustaining Capex | ² Net Debt and Leverage on June 30, 2019. Considers the adjustments mentioned on amortization schedule slide. | . ³Closing rate (BRL/USD): Jun/19: R$3.83
21Capital
Old New
Capex (R$ billion) 2018 2019e 2019e
Sustaining 3.9 4.0 3.8
Modernization and Expansion 2.0 0.6 0.4
Forest and Land 1.3 1.4 1.3
Port Terminals¹ 0.2 0.4 0.4
Total 7.4 6.4 5.9
¹ States of São Paulo and Maranhão.
22Bonds
23One of the
G-spreads¹ in Brazil
288
267 271
258
213 222
210
Investment Grade 162
Rating Outlook
BBB- Stable
BBB- Negative
BRAZIL VALE GERDAU SUZANO KLABIN PETROBRAS BRASKEM BRF
¹ Issuances with no maturity in 2026 interpolated for comparative purposes; G-spread as of September 10, 2019.
Source: Bloomberg. 24Peers
6,0
5,5
5,0
4,5
4,0 Suzano 26 (BBB-)
Arauco 27 (BBB-)
3,5
CMPC 27 (BBB-)
3,0
IP 26 (BBB)
2,5
Jun-18 Jul-18 Aug-18 Oct-18 Nov-18 Jan-19 Feb-19 Apr-19 May-19 Jul-19
Source: Bloomberg, as of 08/12/2019
25Pulp Market
26on global
pulp demand
Global Market Pulp Demand By Grade
in million tons in million tons
Softwood
+1.4/y +0.2/y +0.2/y +0.4/y
+1.3/y 66,0 27,0
21,8 24,3 24,9
+1.2/y 58,9
55,0
42,8 2005 2015 2018 2023E
Hardwood
+1.0/y
+1.0/y +1.1/y 39,0
34,0
30,8
21,1
2005 2015 2018 2023E 2005 2015 2018 2023E
Source: PPPC S&D 2019.
27Driven by end-uses
Global Market Pulp Demand Annual
Demand by end use 58.9
million tons Growth until 2030
Paper and
paperboard
Tissue & Fluff 47% +2.9% demand average
growth of
Printing & Writing 26% -0.7%
Specialty 20% +0.6%
Packaging
until
+2.3%
Breakdown 2030
Source: PPPC S&D 2019, Poyry, Hawkins Wright, Suzano BI.
28China became the leading consumer of tissue
Tissue Demand by main region
in thousand tons
14.100
Western Europe
12.100 North America
China
10.100
8.100
6.100
4.100
2.100
100
2017 2018 2019 2020 2021 2022 2023
Source: RISI
29Supported by
market dynamics
Chinese Market Pulp Demand Tissue Consumption per Capita Tissue Machine Closures from
in million tons in kgs per year Environmental Restrictions
in million tons
25,6 1,4 1,4 1,5
+1.1/y
16,0 15,7
25,3 0,6
+1.1/y 0,5
6,7 6,0
19,8
+1.1/y North West Japan Latin China 2015 2016 2017 2018E 2019E
16,5 America Europe America
Chinese Waste Paper Imports Woodchip Supply Restrictions
in million tons in million BDMT
29 28 25
26 Others 3
23
Chile 3,1 3,3
2
5,8 17 Australia 6,5 4,5
?
Southeast Asia 13,3
12,4
2005 2015 2018 2023E 2015 2016 2017 2018 2019- 2018 2023E
2023E
Source: PPPC S&D 2019, RISI, Hawkins Wright, Suzano BI. 30Chinese to hardwood chips sourcing
2009-2019YTD US dollars per BDMT, nominal prices CIF Share of pulp capacity based on imported HW chips
Imported HW chips by pulp grade Source of HW chips for the Asia-Pacific Markets, 2019YTD
Source: RISI
31No major new capacity in the short term
1.200 BHKP BHKP adjusted by CPI 2,5
Pulp Prices - CIF Europe (US$/ton)(2)
UPM
Capacity Additions (‘000 ton)(2)
Uruguay
1.000
Horizonte 2 2
Eldorado
800 MAPA(3)
Rizhao APP South
Maranhão 1,5
Três Sumatra(1)
Montes
Lagoas del Plata Guaíba II
600 Fray Bentos
APP Hainan Klabin
Santa Fé
Nueva
Veracel 1
Aldea
400 Mucuri Kerinci Chenming
Aracruz Valdivia PL3 Zhanjiang
Jacarei APP Guangxi Oji
Metsa
Nantong 0,5
200
- 0
2000 2001 2002 2003 2004 2005 2006 2007 2008 2009 2010 2011 2012 2013 2014 2015 2016 2017 2018 2019 2020 2021 2022
7,650 kt 3,600 kt
(1) Partially integrated production
(2) Sources: Hawkins Wright, Poyry and Suzano
(3) Gross capacity, does not consider the closure of Line 1 in Horcones plant (Source: RISI) 3233
2019 pr oduct i on gui dance

                         Long term NPV maximization                                                Estimated Market Pulp Production in 20191

                      Preservation of more productive
                      forest base

                      Wood supply mix management                                                                             ~9.0
                                                                                                                            million tons

                      Gradual implementation during the year

1   Production capacity depending on conditions of global pulp market, according to Material Fact released on 05/09/2019.

                                                                                                                                               34
ESG for more value
and less risk
35Board of
a directors
Sustainability
Committee
a
CEO
Reports to
Chief Innovation and
Sustainability New business Strategy, HR, IT ….
Technology
Officer
• Coordinate the Sustainability Strategy throughout the company
Forest Social
Environment Development
• Integration of sustainability aspects throughout the company
• Transparency and dialogue
• Stakeholder relationship and engagement
Instituto Corporate • Implementation social, environmental and sustainability projects
Ecofuturo Sustainability • Reporting
36Construction process
April May June July August September October November December
1. GROUNDING 2 Engagement
Benchmarking External Stakeholders:
• EUA
Community favorability
• Europe
Stakeholders consultation • Brazil
Suzano’s leadership
interviews 3. LONG TERM GOALS JANUARY 2020
Development of long-term goals and definition of institutional commitments and positions:
Carbon, Biodiversity and Conservation, Waste, Water, Productivity and Communities
3. ROADMAP 2020
Create the company's institutional roadmap and develop Sustainability strategies in
conjunction with Business Units
37- 100% of the wood used in the production process is controlled (traceability)
- Compliance with the chain of custody management systems Forest Stewardship Council® (FSC®) and
Cerflor® / Programme for the Endorsement of Forest Certification (PEFC)
- Commitment to prevent sourcing and supply of wood from:
1 2 3 4 5
Illegally harvested Wood harvested Wood harvested in Wood harvested in Wood from
wood in violation of forests where high forests being forests in which
traditional and conservation values converted to genetically
are threatened by plantations or non-
human rights modified trees
management forest use
activities are planted
38Public engagement
In the concept of the new economic model, there is no way to exclude
the role of the forest regarding climate change
Eucalyptus plantation + native forest preservation = carbon sequestration
Positive Balance
(capture – emissions)
➢ Greenhouse inventories – GHG Protocol methodology
(http://www.ghgprotocolbrasil.com.br/?locale=en)
➢ About 90% of Company’s energy requirements based on renewable fuels
(black liquor and biomass)
Committed to CDP (Climate, Water, Forest) and TCFD
39Sustainable Forest Management Model
❖ Operation takes place in exclusively and already
consolidated agricultural and degraded areas
❖ Commited to zero deforestation
❖ Wood purchase policy and forest management plans
❖ Aiming for biodiversity maintenance, soil
productivity, water cycle preservation, carbon
~40% of its total area devoted to conservation (~900 k hectares)
sequestration and stock, etc.
All Suzano industrial units are certified
- Forest Stewardship Council® (FSC®) and/or
CERFLOR® / PEFC
- Traceability of 100% of the total raw
material used in operations
40Water body (rivers)
20% Evaporation
Pulp and paper
production
Pulp and paper – final product
Water withdraw 80%
22 – 32m³/adt Recirculation of
around 5 times
Returns as
treated effluent
- Suzano returns about 80% of the water withdrawn from the river as treated effluent
- High efficiency in the use of water – withdraw is below the BAT of IPPC (Integrated
Pollution Prevention and Control), which is within 30-50m³/adt
41❖ Suzano has no genetically modified trees deployed in commercial operations at this time.
❖ Plant biotechnology to improve forest yield and forest protection.
❖ FuturaGene undertakes extensive biosafety evaluation of new varieties, including human
and animal safety and environmental impact, under normatives determined by the National
Biosafety Technical Commission (CTNBio)
❖ Environmental impact assessment protocol of CTNBio includes studies to evaluate if the
GM variety impacts the environment differently from conventional varieties
❖ Policy of open dialogue with multiple stakeholders with respect to the Suzano’s GM
program (including NGOs, certification bodies, smallholder farmers, agricultural
associations and customers).
42- Risk and cost reduction: operational and reputational
PDRT
- Certification demands adherence
- Income generation and education improvement as drivers
for life quality increase and financial self-sufficiency
- Open dialogue and programs jointly developed with
traditional communities, NGOs, social movements,
government and other companies
- Examples:
Territorial
PDRT Sustainability
Beehives
+4,000 families 2,976 families +1,000 families
Attended Attended Attended
31 communities 76 communities
111 communities Attended
Attended
Attended
9 different Indian R$ 1,668 Families’
R$ 1,431 Families’ ethnicities average income
average income 1,664 tons of honey production
Indigenous communities
R$ 881 Families’
average income (30% of São Paulo state production) 43in place
Well-balanced
Board of Directors Supported by Management
Up to 10 members Audit Statutory Committee
Eligibility assessment Management and Finance Committee
20% independent Innovation and Strategy Committee
members Sustainability Committee
Talent and Compensation Committee
+
44Our Future
45Innovation and New Businesses Consumer Goods Pulp Paper
Fluff Nanocellulose Bio fuel Geographic Organic
expansion in Brazil
International
Expansion
Lignin Dissolving Pulp Bio Composites Portfolio expansion M&A
4647
Backup

         48
2018 2019 2020
Mill – Pulp capacity
1Q18 2Q18 3Q18 4Q18 1Q19 2Q19 3Q19 4Q19 1Q20 2Q20 3Q20 4Q20
Aracruz - Line A (ES) – 590 kt
Aracruz - Line B (ES) – 830 kt
Aracruz - Line C (ES) – 920 kt
Imperatriz (MA)² – 1,650 kt
Jacareí (SP) – 1,100 kt
Limeira (SP)² – 690 kt
Mucuri - Line 1 (BA)² – 600 kt
Mucuri - Line 2 (BA) – 1,130 kt No downtimes
Suzano (SP)² – 520 kt No downtimes
Três Lagoas - Line 1 (MS) – 1,300 kt
Três Lagoas - Line 2 (MS) – 1,950 kt
Veracel (BA)¹ – 560 kt No downtimes
49Demand Growth 2018-2030
in million tons
+80
(+1.5%/yr)
487 495
472 479
458 465
438 445 451
420 426 432 91 90
414 92 91
93 93
95 94
97 96 96
P&W 99 98 57 59
54 55
51 52
46 48 49
43 44 45
Tissue & Fluff 41
205 210 215 220
186 191 195 200
169 174 178 182
Containerboard 166
Cartonboard 49 50 51 52 53 54 55 56 58 59 60 61 62
Specialty 60 60 60 61 61 61 62 62 62 63 63 64 64
2018 2019 2020 2021 2022 2023 2024 2025 2026 2027 2028 2029 2030
Source: Poyry, Hawkins Wright, Suzano BI
50Share on total fiber consumption
4 20 40 60 80 100
Estimated demand growth until 2030 (%p.a.)
Tissue Containerboard
3
Paperboard
2
Packaging
1 Uncoated
Newsprint Woodfree Other
0
-1
Coated
Average growth of
-2 Woodfree
-3 Emerging Markets: 2.2% p.a.
Coated Mature Markets: -0.2% p.a.
Source: Poyry Uncoated
Mechanical
(2017) Mechanical 5165
413 398 Unbleached 59
Non-Wood
175 2
Others Mechanical Fluff
6
Newsprint 34 4 6
23 Tissue
35 Softwood
Recycled Integrated
P&W 217 20
110
100
BCP
59
Packaging Hardwood
222 Virgin 34
Market Pulp
175 65
2018 Total Fiber Consumption Virgin Pulp Market Pulp Bleached Chemical
Paper Pulp (BCP)
Production
Source: Poyry, Hawkins Wright and Suzano BI
52Suzano’s tax structure
Description and Amount Maturity
(-)Deductible accounting expense Annual deduction: R$ 1.2 bn (based on 10yr average) According to assets maturity
(a) EBT As stated in the income statement
Annual deduction: R$ 790 mn (based on 10yr average)
(-)(b) Goodwill (Fibria acquisition) 2029(1)
Tax benefit: ~R$ 270 mn
(+/-)(c) Exchange variation (cash) ---------- ----------
(+/-)(d) Other ---------- ----------
Tax base before compensations (a) + (b) + (c) + (d)
- Up to 30% of tax base before compensations
(e) (-) Tax loss carryforward Undefined
- Balance up to jun/19: R$ 1.0 billion (base)
(f) Tax base Tax base before compensations – tax loss carryforward (e) ----------
(g) Income tax Tax base (f) * 34% ----------
2024 - Mucuri line 1 and Imperatriz
(h) (-) SUDENE 75% reduction of the annual payable Income Tax²
2027 – Mucuri line 2
Balance jun/2019:
- PIS/COFINS: R$ 758 million
(i) (-) Federal tax credits Undefined
- Withholding tax (IR and CSLL): R$ 820 million
- Reintegra: R$ 113 million
Cash Tax Income Tax (g) – SUDENE (h) - Tax Credits (i)
¹ Based on PPA as disclosed on Financial Statements (ii) | ²Benefit does not include CSLL (Social Contribution) reduction 53and monitoring of its forest
base and efficient firefighting mechanism
❖ Forest monitoring towers, communication network, fire brigades, video monitoring
❖ Fire awareness and environmental education awareness activities
❖ Community workers and stakeholders involvement
❖ Commitment to native forest conservation
54Investor Relations
www.suzano.com.br/ir
ri@suzano.com.br
55You can also read