CORPORATE PROFILE - PETRONET LNG LIMITED, January 2020
←
→
Page content transcription
If your browser does not render page correctly, please read the page content below
CORPORATE PROFILE

   PETRONET LNG LIMITED,
       January 2020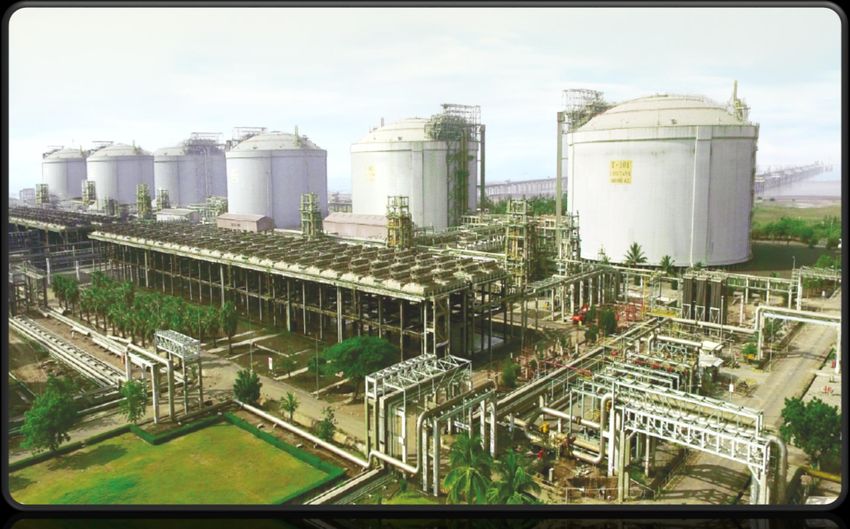
DISCLAIMER

Any information contained in this presentation should not be
taken as being a representation about facts and projection or
promise of performance, whether financial, operational or
otherwise. Nothing contained in this presentation should be
considered an invitation to transact in our securities or an offer
of our securities. This presentation is made specifically for
purposes of the meeting in which this is being presented and
not for any other purpose. You may determine that such
information may be regarded as forward-looking but we
make no assurance about any projection, extrapolation or
interpretation of the same that you may make.                 The
information contained herein should be treated with utmost
confidentiality and not used for any purpose. You are advised
to obtain legal advice on the nature and character of the
information and on implications of being in possession of the
same.

OVERVIEW
Global & India’s Primary Energy Consumption Scenario
India’s Gas Scenario, Infrastructure
Role of LNG in India
About Petronet’s
Dahej & Kochi Terminals
New Initiatives
Performance
3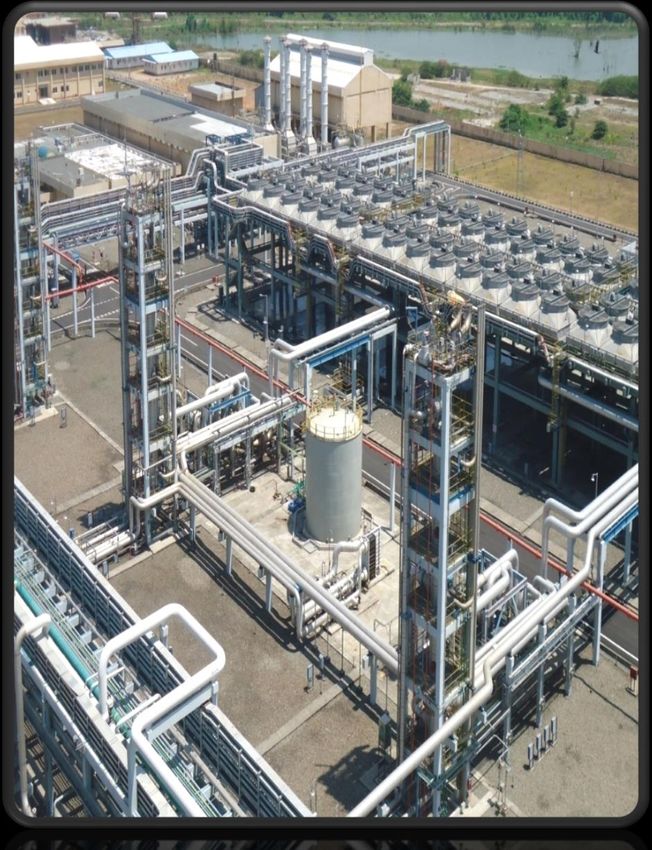
PRIMARY ENERGY CONSUMPTION (mtoe) – WORLD

          Fuel                  2008        %     2018    %

           Oil                  4143       35%    4662   34%

          Coal                  3503       30%    3772   27%

           Gas                  2578       22%    3309   24%

        Nuclear                  620       5%     611    4%

         Hydro                   737       6%     949    7%

     Renewables                  124       1%     561    4%

         Total                 11705       100%   809    100%

Source : BP Statistical Review-June 2019                        4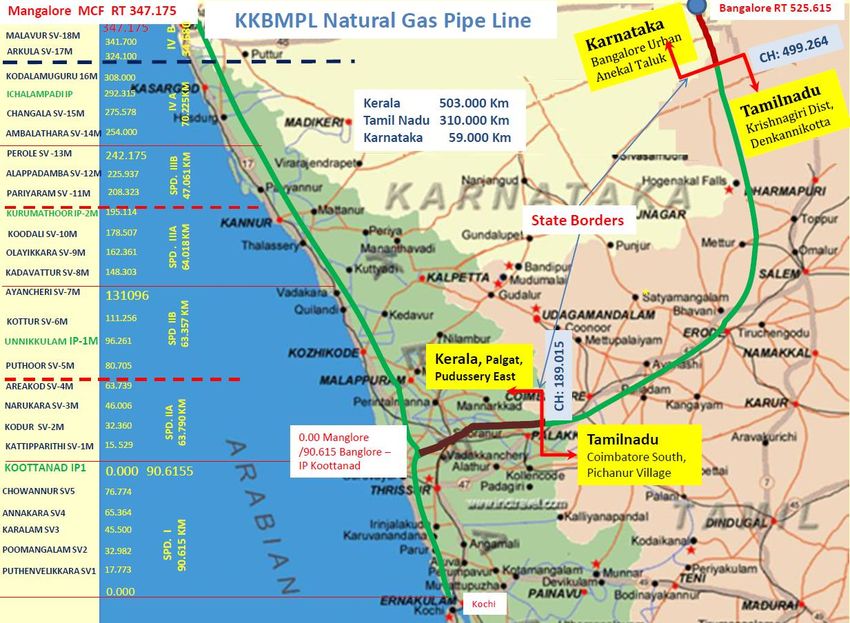
PRIMARY ENERGY CONSUMPTION (mtoe) – INDIA

            Fuel                       2008       %     2018    %

             Oil                           149   31%    239    30%

            Coal                           259   54%    452    56%

            Gas                            34    7%      50    6%

         Nuclear                            3    1%      9     1%

           Hydro                           26    5%      32    4%

      Renewables                            5    1%      27    3%

           Total                           478   100%   809    100%

Source : BP Statistical Review-June 2019                              5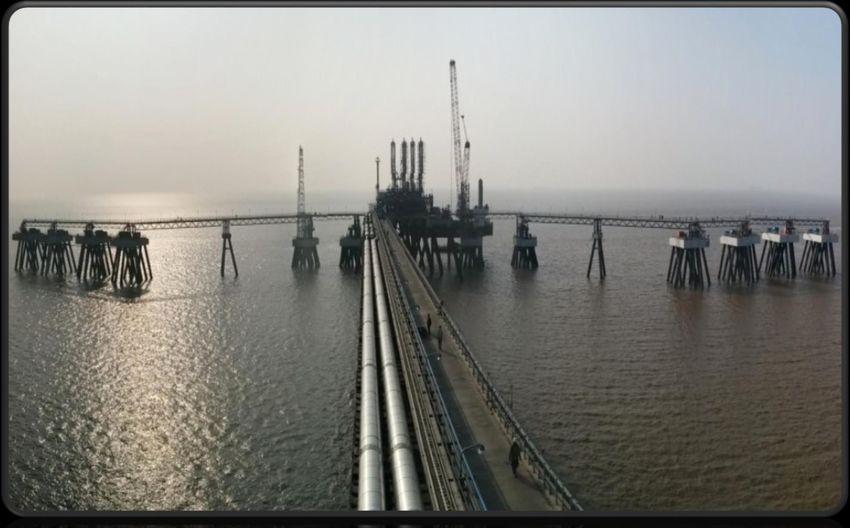
INDIA – A MAJOR GAS/LNG CONSUMER
14th largest gas consumer – 58 bcm (~158 mmscmd)
4th largest LNG importer – 31 bcm (~82 mmscmd)
Economy growing at CAGR of about 6-7% with similar growth in Energy Consumption
Government aims to significantly increase share of Natural Gas in Indian Energy basket to in
coming years
Despite increase in domestic gas production- dependency on imported gas to increase
substantially
Pipeline network- developing into a national grid- needs to grow faster, connecting new
markets
SECTOR WISE PROJECTED GAS DEMAND (mmscmd)
350.00 Sector 2016-17 2019-20 2026-27
Power
300.00 Power 157 202 309
Fertilizer
250.00 Fertilizer 97 106 110
200.00 City Gas City Gas 22 36 68
150.00 Industrial 27 35 52
Industrial
100.00
Petchem/
Petchem/ Refineries /
50.00 Refineries / Internal Cons. 47 54 103
Interal Cons.
0.00
Sponge/ Sponge/ Iron/ Steel 8 10 12
Iron/ Steel
2016-17 2019-20 2026-27
Total Realistic Demand 358 443 654
Source : PPAC, BP Statistical Review June 2019 & Vision 2030, Natural Gas Infrastructure in India
6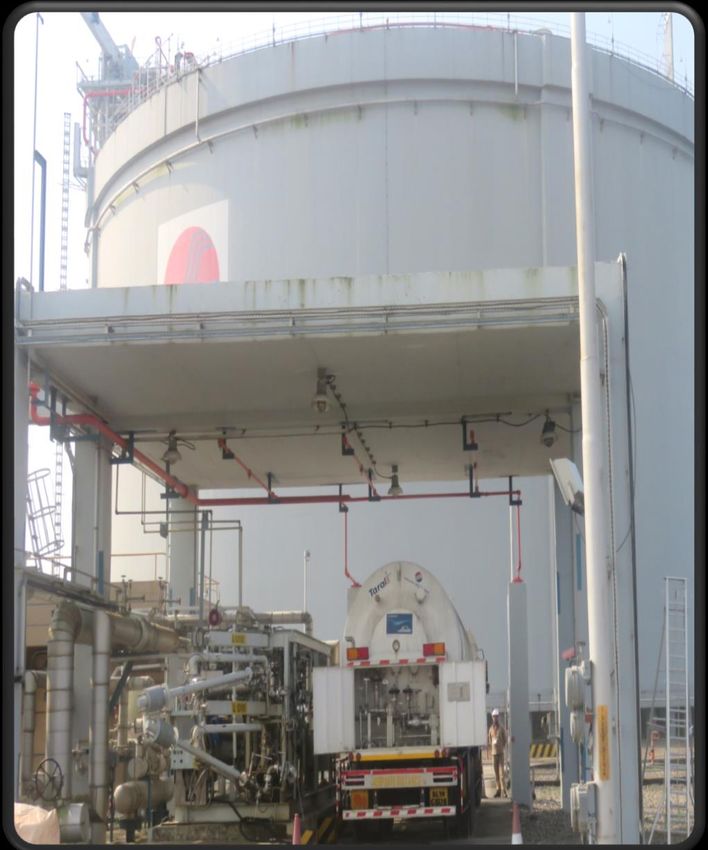
GAS DEMAND IN INDIA

                  MMSCMD

                           7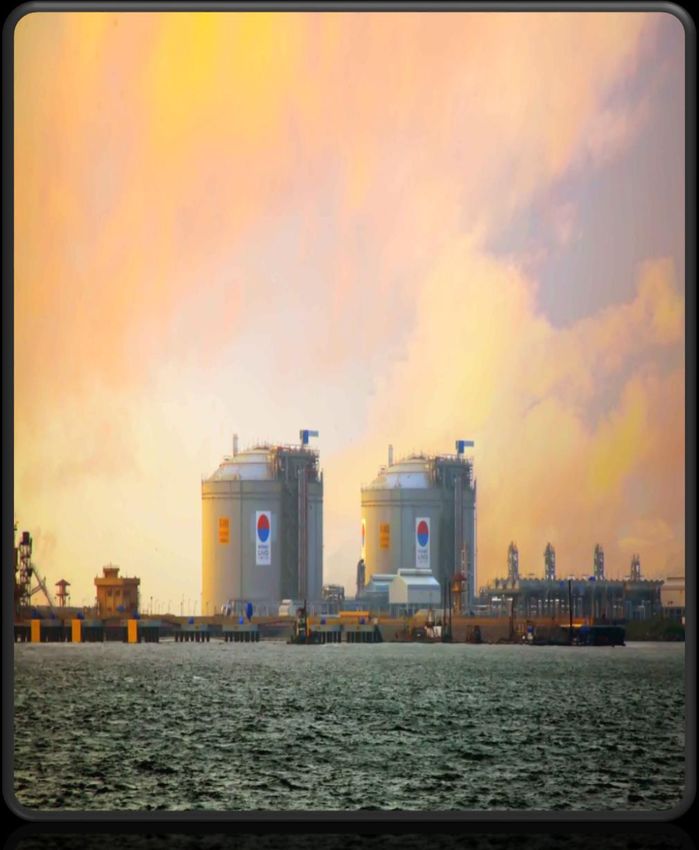
INDIA’S GAS INFRASTRUCTURE
                                               Pipelines           Length       Designed
           Chhara                                                  (Kms)        Capacity
                                                                                (MMSCMD)
                                           Existing                 16,770                369
   Jafarbad                                Under                    11,377                 -
                                           Implementation
                                           Total                    28,147     Kolkatta
Mundra

                                                                                Digha
Jaigarh

                                                                              Dhamra
 Dahej
                                                                             Gangavaram
  Hazira

                                                   Krishnapattam

                                        Kakinada

    Dabhol
                                  Ennore

     Kochi

                    Possible Physical
                    Gas Hub in India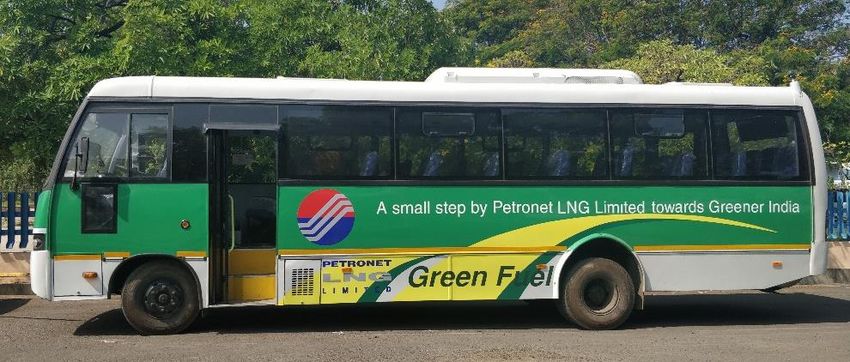
LNG TERMINAL INFRASTRUCTURE

                                                                                                                  CAPACITY
    No.                          TERMINAL                                                DEVELOPERS
                                                                                                                  (MMTPA)
                                                                      Existing Terminal
    1     Dahej                                                        Petronet LNG Limited                            17.5
    2     Hazira                                                       Royal Dutch Shell, Total Gaz Electricite         5.0
    3     Dabhol                                                       GAIL,NTPC                                        5.0
    4     Kochi                                                        Petronet LNG Limited                             5.0
    5     Ennore                                                       Indian Oil Corp                                  5.0
          TOTAL EXISTING                                                                                               37.5
                                          Construction completed
    6     Mundra                                  GSPC, Adani                                                           5.0
                                            Under contrcution
    7     Jaigarh (FSRU)                          H Energy                                                              4.0
    8     Dhamra                                  Adani                                                                 5.0
    9     Jafrabad (FSRU)                         Swan                                                                  5.0
    10    Chhara                                  HPCL & Shapoorji Pallonji                                             5.0
          TOTAL UNDER-CONSTRUCTION /CONSTRUCTION COMPLETED                                                             24.0
                                                     Proposed
    11    East coast                              Petronet LNG Limited                                                  5.0
    12    Kakinada/Krishnapatnam/Karaikal         Others                                                                2.5
    13    Kolkata/Digha Port                      H Energy                                                              2.5

          TOTAL PROPOSED                                                                                               10.0
          GRAND TOTAL                                                                                                  71.5
•   In absence of breakwater terminal can operate at 2.5 MTPA
•   # in absence of commercial commitments, plans have been put on hold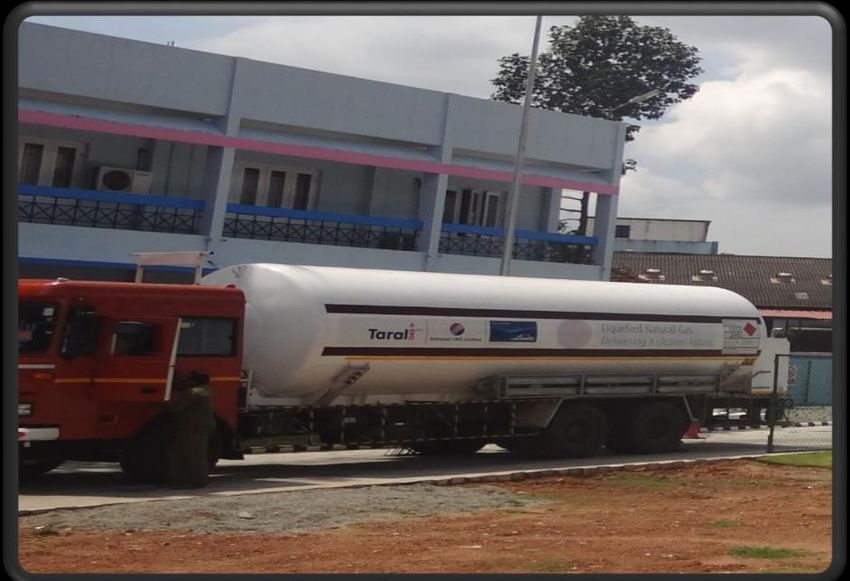
PETRONET LNG LIMITED
Incorporated on April 2, 1998
Authorized Capital INR 3000 Crore
Paid up capital INR 1500 Crore
Commencement of Commercial Operations - April, 2004
Equity
50% Oil & Gas PSUs (BPCL, GAIL, IOC & ONGC)
50% Public / FIIs
12.5
12.5
Public & FIIs
50
12.5
12.5
10TOWARDS THE VISION
Vision Business Strategy
To be a key energy provider to the nation Create and manage world-class
by leveraging unique position in the LNG LNG infrastructure
value-chain with international presence Continue excellence in LNG
45000 Revenue growth 19% business
EBITDA growth 20%
39500 (INR Crore) - Focus on higher capacity
40000 37747 utilization and better
operational efficiencies
35000
31467
30599 - Diversify LNG sources
30000
27133 Diversify business
24616
25000 22696 - Solid cargo port at Dahej
- Small Scale LNG
20000
- Exploring business
15000 13197 opportunities in neighboring
countries
10000
3630
- City-gas distribution/ direct
5000 1914
2205
1582 1594 1760
2939 marketing
1284
0
- Air Separation Unit
2010-11 2011-12 2012-13 2013-14 2014-15 2015-16 2016-17 2017-18 Maintain highest standards of
business ethics
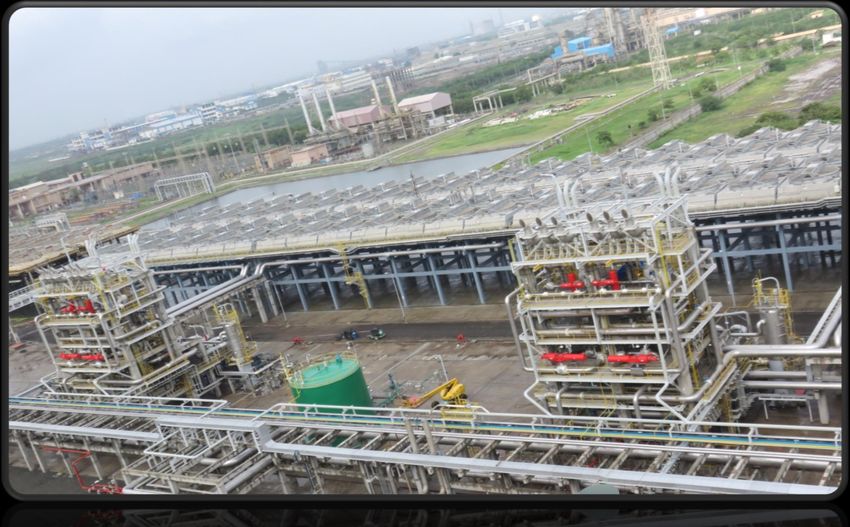
11DAHEJ LNG TERMINAL
Located at Dahej in Gujarat in the Gulf of Cambay on the West Coast of India.
Commencement of Operations in 2004
Capacity (mmtpa)
2004 5.0
2009 10.0
2016 15.0
2019 17.5
LNG Cargoes unloaded : 2200+
1st 1000 Cargoes in Feb 2013
2nd 1000 Cargoes in June 2018
7.50 mmtpa LNG imported from Qatar under long term contracts
Terminal meets almost 40% of India’s gas requirement and around 75-80% of
LNG imports in the country
Truck Loading facility can handle 14,000 loadings/ yr.
Offering tolling services to Offtakers & Bulk customers
Expanded Capacity contracted with GAIL, GSPC, IOCL & BPCL
Time Charter Vessels – Disha, Raahi and Aseem
12DAHEJ PLANT FACILITY
13DAHEJ SECOND JETTY
DAHEJ EXPANSION PHASE IIIA
DAHEJ EXPANSION PHASE IIIB1

                                      Pipe
                                    Pipe   Rack
                                         Rack
STV
                                                    Pipe rack
                                    STV Area

                        Pipe Rack

Air Heater                           Fire Station

15 MMTPA FACILITY AT DAHEJ
      NAME OF FACILITY?Air Heater
KOCHI LNG TERMINAL Terminal commissioned in September, 2013 with the nameplate capacity of 5.0 mmtpa. For effective utilization of Kochi terminal in absence of pipeline, ancillary services such as storage & reloading, cool down, bunkering options explored Kochi Terminal has so far handled 45+ Cargoes operations (including 18 Reload / Cool down Cargo operations and 2 bunkering). Truck loading facility– supply commenced to HLL, Kochi and so far supplied around more than 1250 + truck loads. Long term contract of about 1.50 mmtpa LNG from Exxon Mobil’s Gorgon Project (Australia) – supply commenced. PLL is aggressively pursing construction of Mangalore / Bangalore pipelines with GAIL.
KOCHI FACILITY

                 18
KOCHI – TRUCK LOADING
KOCHI PIPELINE PLL is aggressively pursing construction of pipeline with GAIL All sections Kochi Koottand and Perole- Kodalamuguru- Mangaluru awarded Kochi - Koottanad section completed and successfully commissioned in June 2019 The connectivity to Mangalore will ensure up to 25- 30% of capacity utilization at Kochi Terminal
NEW BUSINESS INITIATIVES
Launch of 1st LNG fueled bus in Kerala on 8th
November 2016
PESO has amended Static and Mobile Pressure
Vessels(U) rules,1981 including the guidelines
for setting up of LNG/LCNG Dispensing Station
Ministry of Road Transport & Highways have
incorporated LNG as an automotive fuel in
Central Motor Vehicle Rules
Exploring opportunities of utilizing LNG
as automotive fuel for heavy duty trucks by
setting up LNG dispensing stations on major
highways
as marine fuel to LNG powered fishing boatsSSLNG PROJECT PLAN FOR PILOT DEVELOPMENT Development of Pilot route with establishment of 20 LNG fuelling stations. The average distance between two stations being about 250 km. The proposed route is as follows: Delhi to Mumbai Highway Ahmedabad to Mundra Highway Mumbai to Chennai Manguluru to Bengaluru Mangaluru to Thiruvananthapuram Finalization of business plan with various Oil and Natural Gas Marketing Companies for setting up of stations
PLL’s PROGRESS FOR PROVING THE CONCEPT
LNG has been notified as an automotive fuel in Central Motor Vehicle Rules (CMVR).
PESO recommendations on Static & Mobile Pressure Vessels (SMPV) rules for dispenser
stations - final notification issued in April 2018.
PLL has procured four LNG buses approved for Commercial operations for its staff
transportation at Dahej and Kochi terminals
PLL has developed LNG dispenser stations inside Dahej and Kochi LNG terminals
PLL is in discussions with State Roadways of Gujarat and Kerala to run a few buses on
LNG and establishing LNG dispensing at their locations.NEW BUSINESS INITIATIVES LNG regasification terminals / FSRUs Initiatives being explored in : Sri Lanka Bangladesh Andaman & Nicobar Islands Mauritius
PERFORMANCE GRAPH

                                                                                                              Net Worth ( Crore)
                          Sales/ Service TBTU
                                                                                     12000                                                                        10666
 1000                                                                                                                                                     9720
                                                                    847     844      10000
                                                                                                                                                   8094
  800                                                       728                          8000
                                                                                                                                            6377
                                                    581                                                                             5688
  600              548      524             533                                          6000                                4992
                                    494                                                                               4450
           440                                                                                                 3520
                                                                                         4000
  400                                                                                             2236 2682
                                                                                         2000
  200
                                                                                           0
    0

                         Turnover Rs. Crore                                                                     Profit Crore
45000                                                                             2500
                                  37747   39500                           38395                                                                                      2155
40000                                                                                                                                                      2078
35000                     31467                                   30599           2000
                                                  27133                                                                                            1706
30000                                                     24616
25000            22695
                                                                                  1500
20000                                                                                                1058     1149
         13197                                                                                                                             914
15000                                                                             1000                                          882
10000                                                                                       620                        711
 5000
                                                                                   500
    0
        2010-11 2011-12 2012 - 2013-14 2014-15 2015-16 2016-17 2017-18 2018-19
                          13                                                         0
                                                                                          2010-11 2011-12 2012-13 2013-14 2014-15 2015-16 2016-17 2017-18 2018-19
FINANCIAL PARAMETERS
Mkt. Price INR
450 403
400
350 336
300
250 170 238
200 151 208
150 82
100 123 133
50
0
10 11 12 13 14 15 16 17 Current
(* - Bonus Share 1:1)
Year EPS (INR) P/E D/E
2010-11 8.26 15.19 1.20
2011-12 14.10 9.29 0.93
2012-13 15.32 8.83 0.68
2013-14 9.49 14.75 0.66
2014-15 11.77 14.52 0.45
2015-16 12.19 20.57 0.37
2016-17 22.80 17.72 0.27
2017-18 13.86 16.66 0.15
2018-19 14.37 17.51 0.07
Exchange Rate 1 US$ = INR 60PERFORMANCE BASED ON EMPLOYEE PARAMETERS
2018-19 2017-18 2016-17 2015-16
Number of Employees 494 486 480 466
Turnover/ employees (INR Crore) 78.62 63.45 52 58.41
Profit Before Tax / Employee (INR Crore) 6.69 6.27 4.92 2.63
Profit after Tax/employee(INR Crore) 4.51 4.32 3.55 1.99
Employee Benefit Expenses (INR Crore) 12.58 91.12 73.86 71.69
Employee Remuneration cost (as % of Profit after tax) 5.64% 4.38% 4.33% 6.11%
A Snapshot of our Human Capital
Human Capital Skill Set Others
Location Male Female
Professional : 241 76% of the professionals are of Technical
Delhi 85 25 background as opposed to 24% Non
Tech: 182 Non Tech:59 Technical
Average Age:36.34 years (more than
Dahej 249 4 Technician/Operators: 180
50% employees in 30-40 years age)
Office Support 48
(Receptionist/Assistant) Average years of association of employees
Kochi 128 3
Support Staff: 25 with Company: 7.45 years
(Attendant/Driver/Caretaker)
Attrition rate: 2018-19 : 3.03%
Learning & Development : 5.67 Mandays / Employee
27RATING AND RECOGNITION
Ratings & Ranking:
Moody’s International Rating Baa2 (at
par with India’s Sovereign Rating)
(2018)
Rated AAA+ by CRISIL, India Ratings &
ICRA (2018)
48th rank Fortune India 500 (2018)
51st rank in ET 500 (2018)
46th rank in D&B India’s 500 Companies
Certificate of Appreciation from US
Environment Protection Agency for
maintaining low methane emissionsCSR – PARTNERING WITH SOCIETY Healthcare and Sanitation Financial assistance for construction of Trauma Care Centre at AIIMS, Bhubaneshwar Eye screening & cataract operational camps in Delhi, Dahej, Kochi, and U.P. Education and Empowerment Petronet Super 30 in collaboration with Indian Army & CSRL supporting underprivileged & brilliant students of Kashmir for 11 months Residential coaching for admission to IITs/NITs. Skill development training for underprivileged youth in association with CIPET in Gujarat , Kerala, Haryana and Himachal Pradesh. Skill Development training of 540 women in Dharwad, Karnataka Skill development initiative of Tribal girls with DRI Balrampur Community Development & Others Efforts towards Hunger Free City Numma – Oonu – Petronet Kitchen, Ernakulam, Kochi Solar lights installations in Pali, Rajasthan Construction of BSF widow quarters in Gujarat, Rajasthan and Punjab District level Special Olympics in Bharuch, Gujarat
Thank You

            30
You can also read