COVID-19 IN INDIA: STATE AND - NATIONAL RESPONSES, ECONOMIC CONSIDERATIONS AND NEXT STEPS
←
→
Page content transcription
If your browser does not render page correctly, please read the page content below
COVID-19 IN INDIA: STATE AND
 NATIONAL RESPONSES, ECONOMIC
CONSIDERATIONS AND NEXT STEPS

                Rijo M. John, PhD
 Senior Fellow, Centre for Public Policy Research
                  Kochi, Kerala
               rmjohn@gmail.com                     0
STRUCTURE OF TALK
India: Demographic & health profile
Progression of COVID-19 in India
India’s response
Current trends of COVID-19 at national and
subnational level
Mortality and testing strategies
Impact on the economy
Recap of key points
1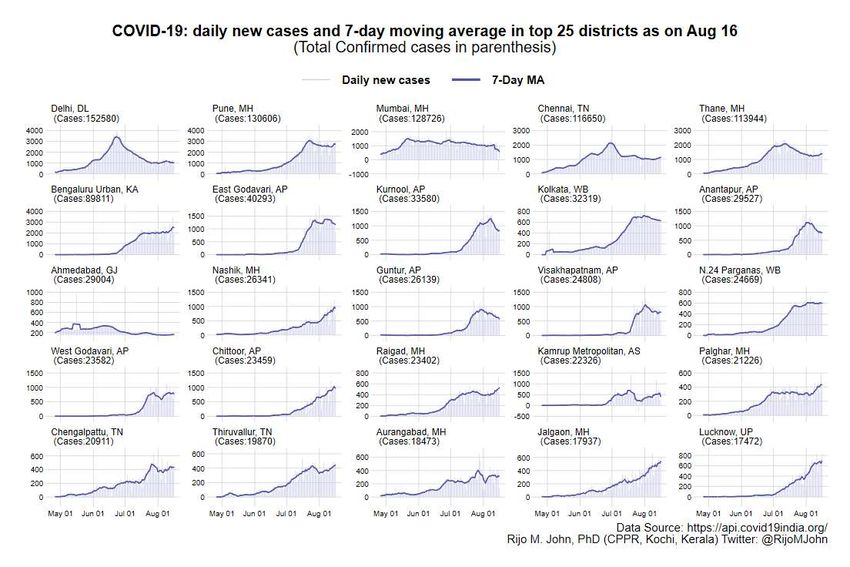
DEMOGRAPHIC & HEALTH PROFILE

                               2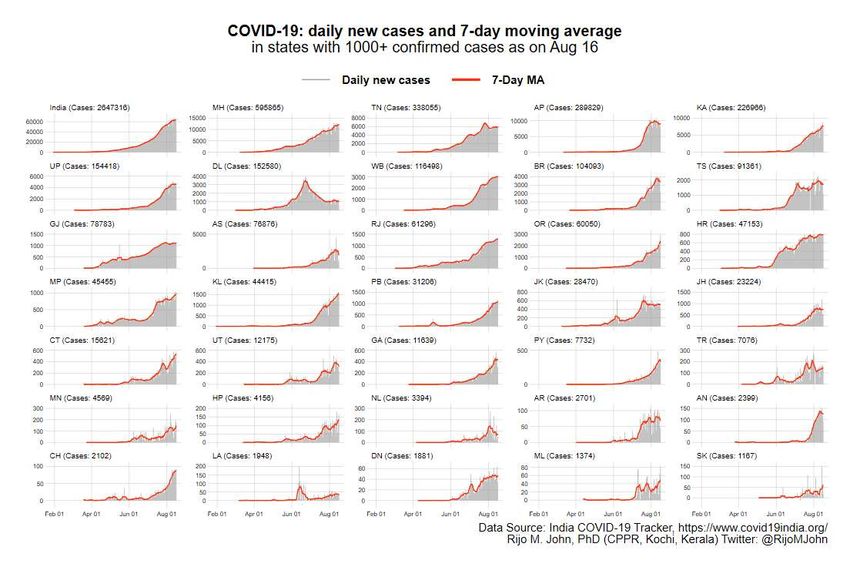
India: Demographic Profile
1.3 billion people (52% Male)
Population age distribution
Sex ratio at birth: 899 females (2018)
/ 1000 males
8%
Population density 26%
382 persons/sq km (2011)
Life expectancy
Male: 69.8; Female: 72.3
66%
Crude Rates:
20 birth/1000 0-14 15-59 60+
6.2 deaths/1000
i.e., some 71K live births &
22K deaths every single day
3
Source: SRS, 2018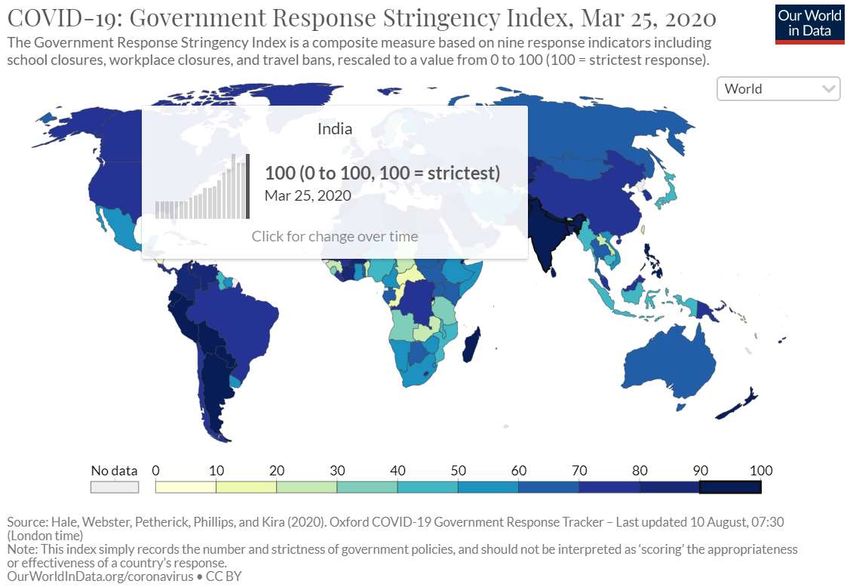
India: Health Profile
Public expenditure on health: 1.28% of GDP (2017-18)
Centre : State share in total public expenditure on health was 37:63 in
2017-18.
Per capita public expenditure on health in nominal terms has gone up
from INR 621 in 2009-10 to INR 1657 in 2017-18.
Close to 65% health expenditures are private out-of-pocket expenditures
4
Source: NSS 75h Round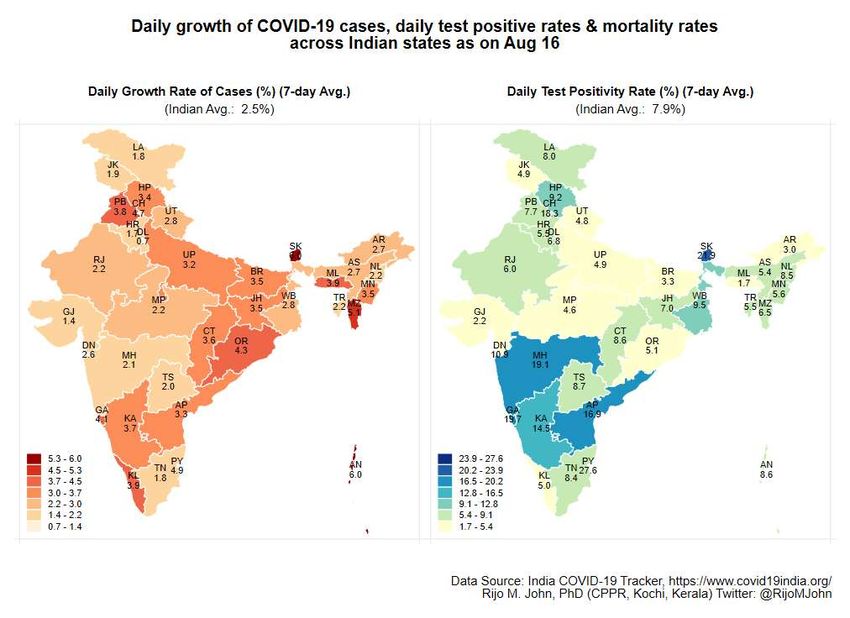
PROGRESSION OF COVID-19 IN INDIA

                              5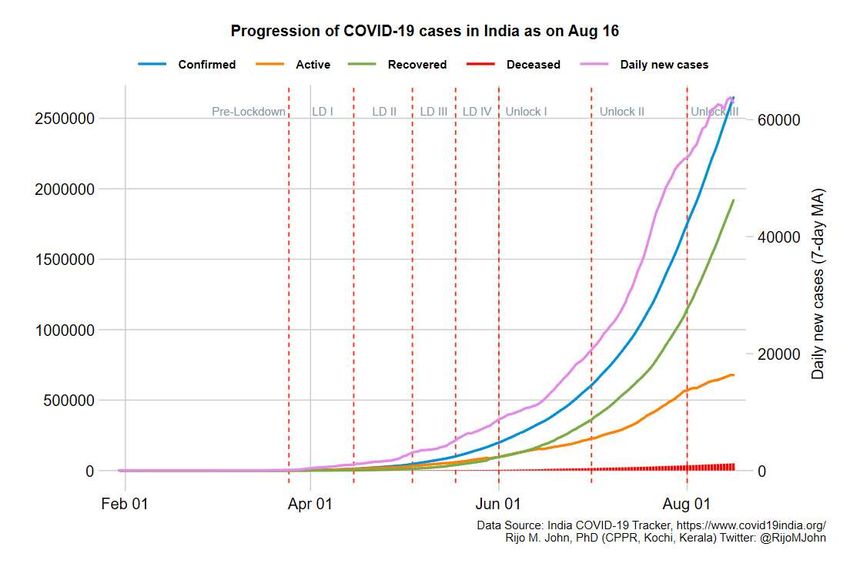
Chronology of COVID19 in India
Date       Events                                                        Cases        Deaths TPR (%)
30-01-20   Wuhan Student in Kerala                                         1            0       -
03-02-20   Kerala declares state calamity                                  3            0       -
06-03-20   Screening for ALL intnl passengers at airports                 31            0       -
08-03-20   100K cases in 100 countries reported                           39            0       -
11-03-20   WHO declares COVID-19, a pandemic                              71            0       -
12-03-20   Haryana Declares COVID19 a pandemic                            81            1       -
           >>Odisha declared COVID-19 a 'disaster'
13-03-20   >>MoHFW said COVID19 not a health emergency                       91            1           1.4
15-03-20   100 cases mark.                                                  100            1           1.7
           Testing primarily limited to symptomatic airport
17-03-20   travelers and contacts with known sources                        146            1           2.2
           ICMR expands testing guidelines to include those
20-03-20   with symptoms but no travel history                              256            1           1.7
22-03-20   Janata Curfew: 14 hour “voluntary” lockdown                      403            1           2.2
           >>Nationwide lockdown for 21 days
25-03-20   >>An exodus of migrant workers begin                             657            1           2.6
                                      Source: The Wire (2020) & www.covid19india.org & author’s calculations

                                                                                                      6
States     Cases
      MH        122
      KL        118
      KA         51
      TS         41
      RJ         38
      GJ         38
      UP         38
      DL         35
      HR         31
      PB         31
      TN         26
      MP         15
      LA         13
      JK         11
      AP         10
      WB          9
      CH          7
      UT          5
      BR          4
      HP          3
      GA          3
      CT          3
      OR          2
      MN          1
      MZ          1
                    7
      PY          1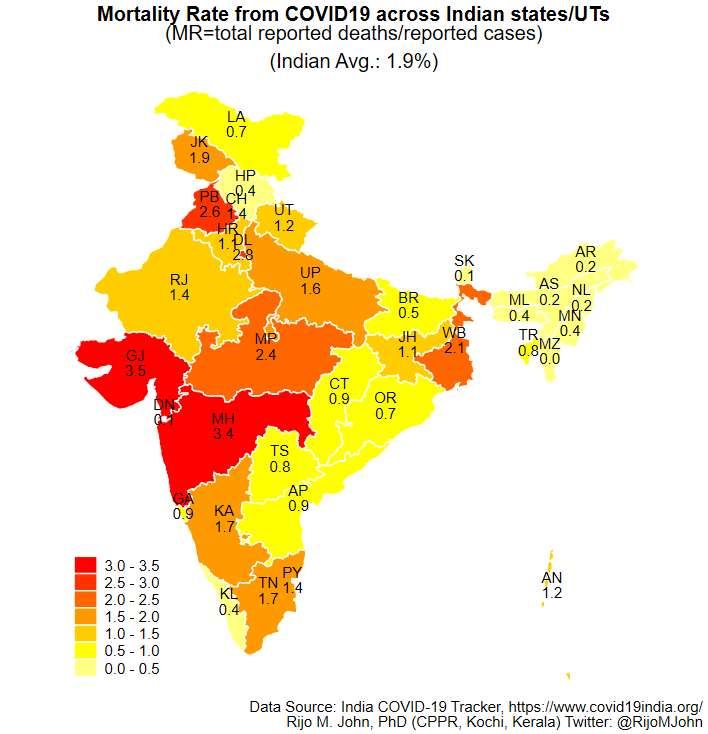
8

INDIA’S RESPONSE

                   9
The Nation-wide lockdown
India did a staggered nationwide complete lockdown
from 25th March to 1st June (Approx. 72 days)
India had about 600 total cases (about 0.5 cases per
million population while this lockdown was announced
Announcing the lockdown at 9PM on 24th March the
Prime Minister of India said:
“from midnight tonight, a full ban is being imposed on
people from stepping out of their homes. All the States
in the country, all the Union Territories, each district,
each municipality, each village, each locality is being
put under lockdown…this lockdown will last 21 days ”
1011
Economic Stimulus Plan (GoI)
March 26: Announced INR 1.76 Trillion ($22.6 billion)
economic stimulus plan
Direct cash transfers to 200 million women and the elderly
Free cooking gas cylinders to 83 million poor families
5 kg. of staple food-grains wheat or rice and a kilogram of
pulses free once a month for three months to about 800
million poor people
A plan for medical insurance cover of 5 million rupees
($66,000) for every frontline health worker
The additional fiscal stimulus component was INR 0.8
Trillion (approx. 0.4% of GDP)
May 17: Announced INR 20.7 Trillion ($270 billion)
Collateral-free loans to MSMEs, ration cards useable
anywhere, credit facilties
The additional fiscal stimulus component was about INR
1.3 trillion (approx. 0.7% of GDP) 12CURRENT TRENDS IN COVID-19:
National & Sub-National
1314
15
16
17
18
About 46% of the cases & 60% of the deaths from this top 25 districts
                                                                        19
MORTALITY & TESTING STRAGEIS
2021
Death Reporting in India
states                        Confirmed           COVID19 Population Death     Medical
                              COVID19             Deaths  Share (%) Registrati Certification
                              cases                                  on (%)*   of Deaths (%)
Maharashtra                         595,865           20,037                   9.0            98.4                       34.8
Tamil Nadu                          338,055             5,766                  5.7           125.9                        45
Andhra Pradesh                      289,829             2,650                  3.9           106.4                       14.9
Karnataka                           226,966             3,956                  4.9           120.7                       31.1
Uttar Pradesh                       154,418             2,449                17.2             60.8                        5.1
Delhi                               152,580             4,196                  1.4           194.0                       62.3
West Bengal                         116,498             2,428                  7.3            91.8                       12.9
Bihar                              104,093                537                9.0              34.6                       13.6
Share in Total                        74.7%             82.3%              58.5%                 -                          -
All India                          2647316             51045                 100                86                       21.1
Source: Annual Report on Vital Statistics of India based on CRS – 2018; Medical Certification of Cause of Death, 2018;
COVID19 data: https://www.covid19india.org/
*Death Registration computed as Registered deaths/estimated deaths in each state (computed from CRS and MCCD 2018)
                                                                                                                    22
Reporting of COVID19 Deaths
State of WB had excluded close to 50% of the COVID related
deaths on account of “comorbidities” in early March and April
Death counts were partly adjusted by the govt. of Delhi for the
under counting in April and May.
Maharashtra adjusted COVID fatalities up by 1328 on June 16th
Tamil Nadu made upward adjustments to its earlier reported fatality
numbers
In Gujarat, while the total cases have increased by >200% in the
past two months the deaths increased only about 79%.
States of Madhya Pradesh & Telangana also have had instances
of discrepancies in fatality numbers
Attributing covid19 deaths to comorbidities
Mismatches in data from crematoriums & graveyards.
Some later added as “reconciled” fatalities
23Sero-prevalence surveys
Place / Period of Sample Preval Popul Crude Actual
Agency Survey Size ence ation IFR* Cases
83 Dists (ICMR) May 26,400 0.73% 0.08% 0.2M
Delhi (Gov. of Delhi) 27 June – 10 22,853 23% 19M 0.07% 0.11M
July
Mumbai – 3 municipal 1-15 July 6,936 33% 13.5M 0.12% 0.1M
wards (BMC)
Ahmedabad (AMC) 16 June – 11 30,054 18% 6M 0.14% 22K
July
Berhampur (OD) 3-7 August 2,830 31% 0.5M 0.02% 2.5K
BeMC/RMRC
Pune 20 July - 5 1664 51.5% 0.4M
(Research institutions) Aug
*Crude IFR based on the assumption of no under counting of deaths (Murad Banaji, 2020)
High sero-prevalence compared to similar studies in other
countries & deaths are not commensurate with it.
2425
Testing strategies by ICMR
March 17:
All asymptomatic people who have undertaken International travel
All contacts of laboratory confirmed positive cases
Symptomatic health care workers
March 20:
All hospitalized patients with Severe Acute Respiratory Illness
Asymptomatic direct and high-risk contacts of a confirmed case
April 4:
All symptomatic ILI (fever, cough, sore throat, runny nose) patients
in hotspots/clusters
May 18:
Symptomatic frontline workers involved in containment and
mitigation of COVID19
All hospitalised patients who develop ILI symptoms
All symptomatic ILI among returnees and migrants
26Testing strategies by ICMR
June 14:
Rapid antigen detection tests (RADTs) recommended as
a PoC test in containment zones/hotspots and healthcare
settings
Suspected individuals who test -ve by RADT should be
definitely tested sequentially by RT-PCR to rule out
infection, whereas a +ve test should be considered as a
true +ve and does not need reconfirmation by RT-PCR
test
Kits by 3 private companies have been validated &
approved for testing by ICMR so far.
0.9M tests y’day alone. About 44% of tests on average
are RADT
A quantity over quality strategy or a shift towards
mitigation over containment strategy of test & trace
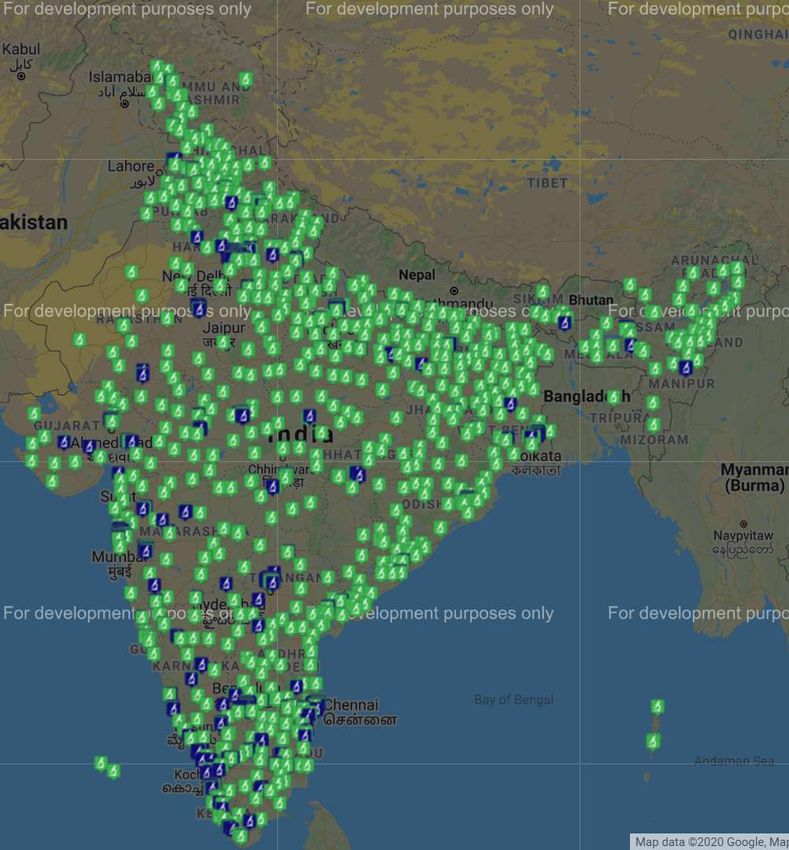
27 COVID-19
Testing labs
approved by
ICMR
Total: 1476
labs as on
17, Aug.
971 Govt.
505 Pvt.
28Testing in practice
States are increasingly using Rapid Antigen Tests unlike
the RT-PCR tests most of them used earlier
40% to 70% of total tests are RADT in states like Delhi,
Andhra Pradesh & Karnataka
About 11 states/UTs are now reporting separate testing
numbers for RT-PCR and Rapid Antigen Test
Only a few percentage of –ves from RADT are retested
For example, of the 300K+ RADT Delhi govt. did
between June 18 to July 16, 280K were –ve, but only
about 0.5% of these were re-tested with RT-PCR. 15%
of these re-tested turned out +ve.
States seem to be partly replacing RT-PCRs with RADT
instead of supplementing it thus not utilizing even the
existing capacity for RT-PCR.
2930
31
India reports about 65K cases, close to 1000 deaths & 850K tests daily
                                                                         32
IMPACT ON THE ECONOMY
33India’s workforce composition in 2018
Source: PLFS 2017-18, NSO (Estimated by Thomas, J. 2020)
India’s workforce consists of 471.5M workers
Total wage incomes earned by all workers in the country
in a month is estimated at about INR 4.8 trillion or 2.5%
of the country’s annual GDP in 2018 (Thomas, J (2020)) 34Lost wage income during lockdown
CMIE estimates 122M people (26% of workforce)
lost jobs in India in April 2020.
Some studies put this figure at 60% to 85%.
Almost all casual workers and vast sections of the
self-employed in India have lost their wages
Nearly half of all regular workers (49.4%) in the
country do not receive any form of social security
Study by Thomas, J (2020) estimates India’s workers
may have lost approx. INR 4 trillion (2.2% of GDP) in
2 months during the lockdown
35Arrivals in the agricultural markets between March 15 & May 31,
for selected crops in India in 2019 & 2020 (tonne & per cent)
Crop Total arrivals Total arrivals Arrivals in 2020 as
between March 15 between March 15 per cent of arrivals
and May 31, 2019 and May 31, 2020 in 2019 (%)
(in tonne) (in tonne)
Paddy 19,40,434 17,07,024 88
Wheat 1,83,15,110 1,01,86,771 55.6
Maize 4,70,034 6,38,122 135.8
Barley 4,02,966 1,61,802 40.2
Gram (chana) 17,75,383 4,76,704 26.9
Pigeon pea (arhar) 2,90,474 1,18,335 40.7
Lentil (masur) 1,91,725 1,58,967 82.9
Potato 24,00,594 12,10,066 50.4
Tomato 5,13,851 4,10,711 79.9
Onion 30,17,686 10,74,346 35.6
Cabbage 1,29,757 86,923 67
Cauliflower 1,40,924 88,270 62.6
Peas (matar) 1,07,057 43,472 40.6
Lady’s finger 1,01,125 71,187 70.4
Banana 3,86,328 3,13,567 81.2
Mango 3,69,991 95,719 3625.9
Source: Computed from the CMIE commodities database, June 1, 2020 (R. Ramakumar, 2020)Forecasted Percentage Change in Real GDP
Growth
Projections 2019 2020 2021
IMF June 2020 4.2 -4.5 6
WB June 2020 4.2 -3.2 3.1
OECE June 2020 4.2 -3.7 7.9
ICRA July 2020 (for FY 20-21) - -9.5 -
SBI August 2020 (for Q1 FY20-21) - -16.5 -
Sources: Congressional Research Service, 2020 & others.
37Estimated GDP loss due to lockdown Study by Pronab Sen, Programme Director, IGC India Programme The supply effect of the lockdown affecting 50 to 55% of the economy, leads to a weekly loss of approx. INR 2 Trillion (1% of 2019-20 GDP) translating to a loss of INR 19T (9.5% of GDP) for the lockdown period till May 31 Adding the partial lockdowns by other states prior leads to a loss of INR 23T (11.5% of GDP) The ripple effects it creates on incomes can eventually lead to a loss of INR 40T (20% of GDP) Assuming already budgeted govt. expenditures were expected to generate a 6% growth in FY 20-21, the net loss will be a reduction of GDP in 20-21 by INR 23.3T, a shortage of close to 12%. If we also factor in possible fall in exports as global trade contracts, the estimated impact on India’s GDP will be even larger The net -ve effect of the lockdown, export slowdown, and the fiscal stimulus provided so far in 2020-21 is estimated to be at least INR 25T or a GDP growth rate -12.5% 38
Projected GDP trends, 2019-20 to 2023-24
                    GDP            Growth                         GDP           Growth
                                   rate                                         rate
Financial Year      (Rs. Tr. 19-20 (year-on-     Financial Year   (Rs. Tr.      (year-on-
                    prices)        year)                          19-20         year)
                                                                  prices)
2019-20                     207.1         5.0% -                  -             -
(Pre-Covid)
2019-20                     203.4         3.0% 2021-22 Annual           162.5       -8.80%
(Post-Covid)
Q1 FY 21                     30.8       -37.5%   Q1 FY 23                39.7       17.9%
Q2 FY 21                     47.2        -3.9%   Q2 FY 23                41.3       12.4%
Q3 FY 21                     47.8        -7.5%   Q3 FY 23                43.1        4.6%
Q4 FY 21                     52.3         1.7%   Q4 FY 23                48.2       -5.2%
2020-21 Annual              178.2       -12.4%   2022-23 Annual         172.3        6.0%
Q1 FY 22                     33.7         9.5%   Q1 FY 24                  42        5.9%
Q2 FY 22                     36.8       -22.2%   Q2 FY 24                43.8        6.0%
Q3 FY 22                     41.2       -14.0%   Q3 FY 24                45.7        6.0%
Q4 FY 22                       51        -2.8%   Q4 FY 24                51.1        6.0%
2021-22 Annual              162.5        -8.8%   2023-24 Annual         182.6        6.0%

Source: Pronab Sen, 2020, https://tinyurl.com/y58x4jyb
                                                                                    39
RECAP COVID-19 has spread far and wide in India and the daily numbers are still rising India’s cases, deaths and tests should all be looked at per million population due to the sheer size of its population Success and failures of containment and/or mitigation differ so widely among states and has to do with each state’s health infrastructure The mortality rate from COVID19 vary widely across states in India. For the country as a whole, it is on the lower side even if one allows for some under reporting of deaths The current testing strategy seems to be an effort at mitigation in a more cost effective manner which is suggestive of an acknowledgement that containment is no more possible 40
RECAP
India had one of the most comprehensive, stringent and
extended lockdowns anywhere in the world
One could argue the pandemic could’ve been worse had such
a lockdown not been there
It could be also argued the pandemic could’ve been contained
with the opportunity it got from the longest and stringent
lockdown if it was better managed & planned
In hindsight, seeing the devastating impact of a country wide
lockdown which happened without much preparation, one
could argue a more localized strategy could’ve been just as
effective perhaps at a much lesser cost
Going by the bottom-line (mortality), it is now clear that the
damage to the country on account of a stringent lockdown is
41
far more disconcerting than that from the pandemic itself.REFERENCES
India COVID-19 Tracker, https://www.covid19india.org/ (Data for most COVID charts in this ppt are from this site)
SRS Statistical Report 2018, Office of the Registrar General India, Ministry of Home Affairs, Government of India.
https://censusindia.gov.in/vital_statistics/SRS_Reports_2018.html
NSS 75th Round - Social Consumption in India : Health. New Delhi: National Statistical Office, Ministry of Statistics
and Programme Implementation; 2019
The Wire (2020), "Half a million COVID-19 cases in India: How we got to where we are". https://thewire.in/covid-19-
india-timeline
Annual Report on Vital Statistics of India based on CRS - 2018, Office of the Registrar General India, Ministry of
Home Affairs, Government of India. https://censusindia.gov.in/2011-Common/CRS_reports_2018.html
Medical Certification of Cause of Death, 2018, Office of the Registrar General India, Ministry of Home Affairs,
Government of India. https://censusindia.gov.in/2011-Documents/mccd_Report1/MCCD_Report-2018.pdf
Murad Banaji, "Modelling the COVID-19 pandemic", (2020) http://maths.mdx.ac.uk/research/modelling-the-covid-
19-pandemic/
Thomas, J. “India’s poor may have lost Rs 4 lakh crore in the coronavirus lockdown” (2020)
https://scroll.in/article/963284/indias-poor-may-have-lost-rs-4-lakh-crore-in-the-coronavirus-lockdown
Government of India. Periodic Labour Force Survey (PLFS) 2017-18. New Delhi: National Statistical Office, Ministry
of Statistics and Programme Implementation; 2019
Ramakumar, R. “Agriculture and the Covid-19 Pandemic: An Analysis with Special Reference to India.” Review of
Agrarian Studies 10, no. 1 (2020). http://www.ras.org.in/agriculture_and_the_covid_19_pandemic
Congressional Research Service "Global Economic Effects of COVID-19", Report No. R46270, Aug 7, 2020
https://fas.org/sgp/crs/row/R46270.pdf
Pronab Sen, "The Covid-19 shock: Learnings from the past, addressing the present - II“ Ideas for India, 2020.
https://www.ideasforindia.in/topics/macroeconomics/the-covid-19-shock-learnings-from-the-past-addressing-the-
present-ii.html
42THANK YOU!!
Email: rmjohn@gmail.com
Web: www.rmjohn.in
Twitter: https://twitter.com/RijoMJohn
43You can also read