CREATING HEALTHY COMMUNITIES - TOGETHER - 2021 COMMUNITY HEALTH NEEDS ASSESSMENT MIDMICHIGAN MEDICAL CENTER-WEST BRANCH
←
→
Page content transcription
If your browser does not render page correctly, please read the page content below
2021 Community Health Needs Assessment
     MidMichigan Medical Center-West Branch

Creating Healthy Communities - Together

                                              1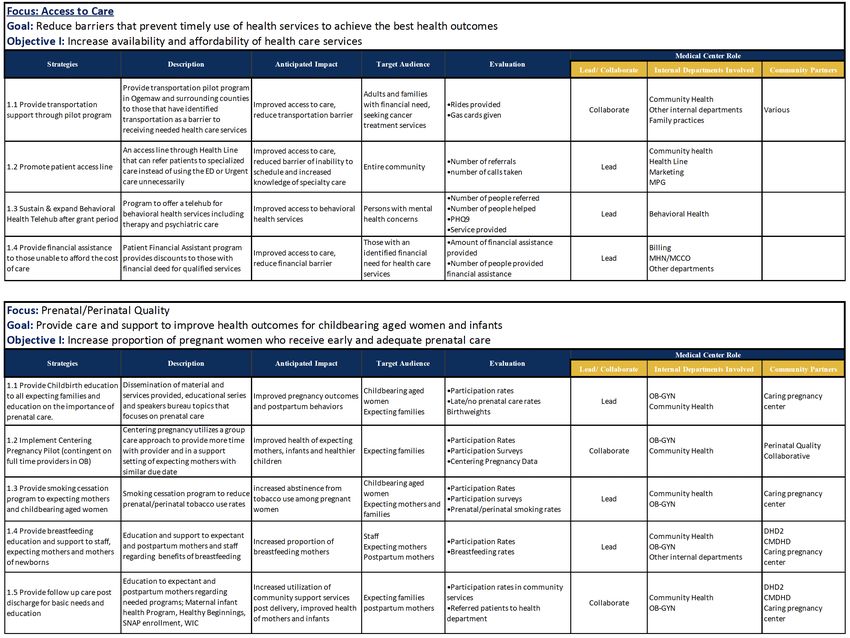
Table of Contents

Table of Contents............................................................................................................................ 2
Executive Summary......................................................................................................................... 3
Background & Communities ........................................................................................................... 5
Community Served.......................................................................................................................... 9
Introduction/Framework ................................................................................................................ 9
Demographics ............................................................................................................................... 12
Determinants of Health ................................................................................................................ 15
Access to Care ............................................................................................................................... 17
Health Behaviors........................................................................................................................... 20
Health Conditions ......................................................................................................................... 25
Prioritization Process .................................................................................................................... 28
Final Steps ..................................................................................................................................... 29
Improvement Plan ........................................................................................................................ 30
Appendix A.................................................................................................................................... 31
Appendix B .................................................................................................................................... 32

                                                                                                                                                  2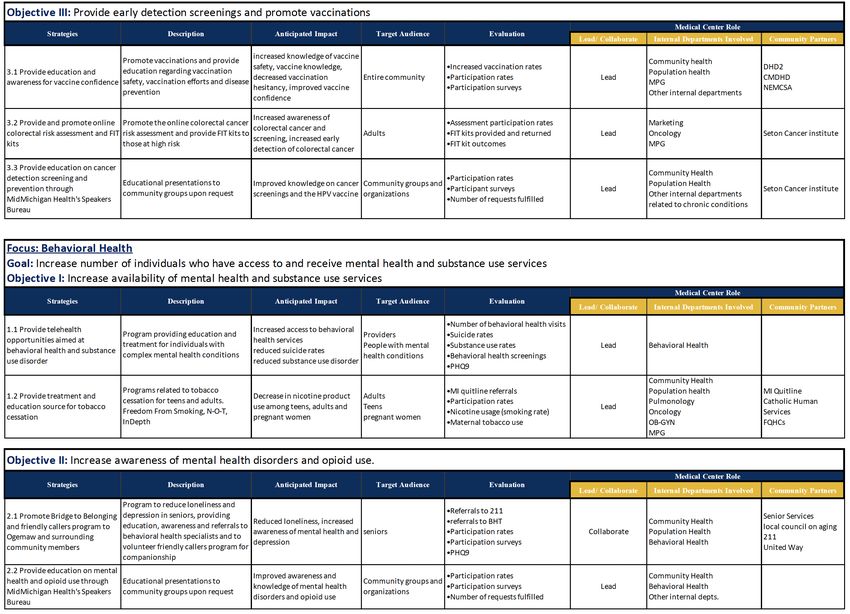
Executive Summary
The Community Health Team of MidMichigan Health supports the Community Health Needs
Assessment (CHNA) as a key component of improving population health. Our assessments and
corresponding plans are a reflection of the purpose and core values of MidMichigan Health.
We truly believe that health happens were we live, learn, work and play and that all people
should have the opportunity to make choices that allow them to live a long, healthy life,
regardless of their income, education or ethnic back ground.
MidMichigan Medical Center-West Branch conducted a CHNA using a modified MAPP process
that assessed the current health status of the communities the medical center serves based on
identified needs according to benchmark comparisons, Primary data collection through
community surveying for community input, and the development of a Community Health
Improvement Plan (CHIP). The process included 19 community leaders that submitted
information for the assessment to review health data, analyzed public health data, complete
and distribute the Wellbeing Survey, identify priorities and set goals for the 2021 CHIP.
1. Community Health Status
This assessment evaluated each county identified as the community served by MidMichigan
Medical Center-West Branch and the community collaborative organizations that were involved
in the assessment, which included Ogemaw, Roscommon, Arenac, Isoco and Oscoda counties.
Evaluation included demographics and public health data from a variety of sources and
agencies including Ten16, District Health Department #2, countyhealthrankings.org, and other
county level data.
The combined population of all five counties is 93,234 residents in 2019. Each
county ranges from 93.4%-95.2% white, 0.3%-0.7% African American, 1.0%-1.2%
American Indian, and 2%-2.4% Hispanic or Latino.
Povery levels for children under 18 years of age range from 24% for Arenac
County, to 33% being the highest in Roscommon County. The Michigan Average
is 19%. Those that are below the ALICE population threshold is between 38%
and 47%.
Obesity rates are increasing with Oscoda county at the highest of those
evaluated with 39% reporting obesity, and Iosco county with the lowest at 30%.
Roscommon and Arenac counties were in the top five highest invasive cancer
incident rates in the state of Michigan.
3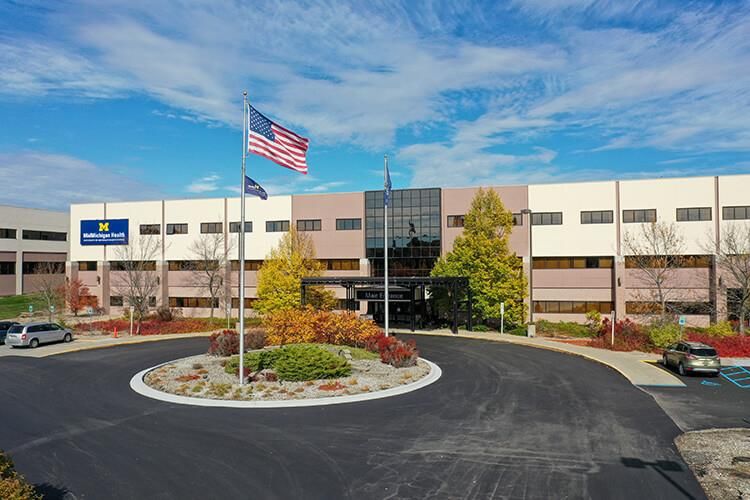
Maternal tobacco use ranged from 29% in Oscoda County to 40% in Iosco
County. 44% of pregnant moms in Oscoda county received late or no prenatal
care, along with 32% in Arenac County.
Each census tract in all five counties ranked in the lowest quartile for health
literacy.
2. 2021 Wellbeing Survey for Community Vitality
The wellbeing survey was a primary survey that looked at the vitality of the community and
assessed the current strengths and themes within each community served. The survey was
sent out both electronically, using surveymonkey.com, and also paper surveys were sent to
harder to reach populations such as meals on wheels and senior services. 213 people
completed the survey electronically, and 121 complete the paper survey.
40% of respondents that postponed or did not receive care when needed was due to
cost, while 36% was due to Covid concerns and 24% due to no available appointments.
Residents identified jobs with livable wages, affordable/quality housing, low-cost/free
exercise opportunities, healthy food options and access to healthcare as the top 5 needs
that if addressed, would improve the health of the community.
3. Community Health Improvement Plan
The Community Health Improvement Plan will guide the next efforts of the community health
team, while aligning with the strategic plan of MidMichigan Health, for the next three years.
The plan includes the efforts of the community collaborative team in order to create
partnerships in community health improvement, with the goal of improving health outcomes.
Health Priorities:
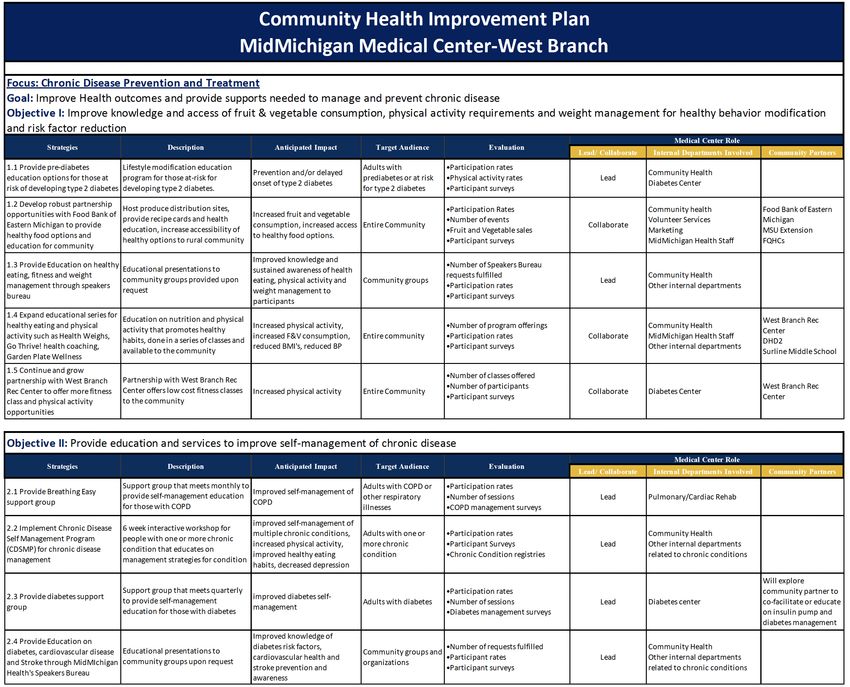
1. Chronic Disease Prevention & Treatment
Areas of high priority are cardiovascular disease, Obesity, Diabetes and Cancer
2. Behavioral Health
Behavioral Health will include Substance Use Disorder, Mental health providers and
suicide prevention.
3. Access to Care
While this is a broad spectrum of possibilities, the ares of focus will be on provider
engagement, utilizing and education on Advanced Practice Providers for primary care,
healthy food access, exercise opportunities, broadband internet access and health
literacy.
4. Prenatal/Perinatal Quality
Each of the counties have high rates of maternal tobacco use, and high rates of late/no
prenatal care. Focus will be given to these two categories while providing additional
support services to new and young mothers within our recently re-opened OB.
4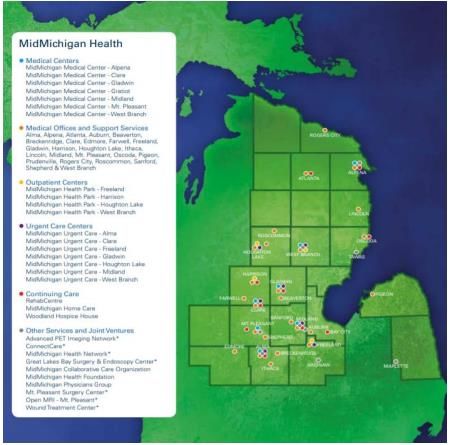
Background & Communities

MidMichigan Health, a non-profit health system headquartered in Midland, Michigan, is a
leader in providing award-winning, high-quality care to the 23-county region it serves. With
Medical Centers in Alpena, Clare, Gladwin, Gratiot, Midland, Mt. Pleasant and West Branch,
MidMichigan Health provides a full continuum of care across a wide array of settings, including
urgent care centers, home health, virtual care, as well as medical offices in more than 30
specialties and subspecialties including cardiology, hematology/oncology, orthopedics, vascular
surgery, family medicine and more. MidMichigan Health demonstrates its commitment to the
future of medicine by partnering with leading institutions to offer medical education programs
that train medical students, physicians, nurse practitioner and physician assistant students,
nursing students and other clinical experts for our region. Its more than 8,800 employees,
volunteers, health care providers and other personnel work together to create healthy
communities through solutions designed to meet the ever-changing needs of the 938,000
residents in the health system’s 23-county service area. In fiscal year 2020, MidMichigan Health
provided more than $91 million in community benefits, as well as supported its patients and
families with new equipment, services and programs with funds raised by the MidMichigan
Health Foundation.

                                                                                               5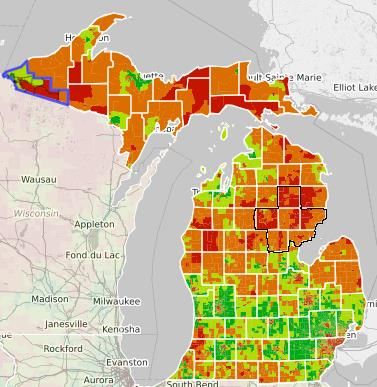
MidMichigan Medical Center - Alpena
A 139 licensed-bed hospital located in northeast Michigan on the shores of Lake Huron,
Alpena's first community hospital opened in 1915 as the Donald McRae Hospital. It served until
1939, when a petition was passed to build a new public hospital. On April 16, 1940, a new 88-
licensed bed hospital opened called Alpena General Hospital. On April 1, 2016, Alpena Regional
Medical Center joined MidMichigan Health, making it the fifth Medical Center in the
MidMichigan Health system. To reflect the hospital joining MidMichigan, the Medical Center
changed its name to MidMichigan Medical Center - Alpena. Accredited by The Joint
Commission, the Medical Center has approximately 1,000 employees, 200 volunteers and about
100 physicians. In 2017, the Medical Center in Alpena was recognized as a Top Rural

                                                                                            6
Community Hospital by the National Rural Health Association, was named to the Becker's
Hospital Review 2017 list of 100 Great Community Hospitals, and received Michigan’s Quality
Improvement Organization (MPRO) 2019 Governor’s Awards of Excellence for outstanding
achievement in Effective Reporting and Measurement in Outpatient Quality Reporting Acute
Care Hospitals, as well as Hospital Value-based Purchasing Acute Care Hospitals.

MidMichigan Medical Center - Clare
A 49 licensed-bed hospital, MidMichigan Medical Center - Clare, provides 24-hour emergency
room coverage, inpatient care, outpatient care and urgent care services. Specialized inpatient
units include, medical/surgical care, cardiac-monitored care, pediatrics, and a sleep diagnostics
center.

MidMichigan Medical Center - Clare
provides Outpatient surgery including general, gynecological ophthalmological, orthopedic and
podiatric surgeries. The medical center provides walk-in and occupational medicine care to area
residents. The Medical Center’s active medical staff consists of 18 physicians representing six
medical specialties; 94 percent of the physicians are board certified in their medical specialty.
The Medical Center is accredited by The Joint Commission and most recently received
Michigan’s Quality Improvement Organization (MPRO) 2019 Governor’s Award of Excellence for
outstanding achievement in Effective Reporting and Measurement in Outpatient Quality
Reporting Acute Care Hospitals.

MidMichigan Medical Center – Gladwin
A 25 licensed-bed critical access hospital providing general medical and surgical care for
inpatients and outpatient services along with a 24-hour emergency room. Our urgent care
services are provided at MidMichigan Health Park Gladwin, conveniently located on M-61 for
the community. The Medical Center campus features a waterfall in a garden-like setting
reflective of MidMichigan Health’s emphasis on humanistic care. The waterfall and courtyard
are enjoyed by Medical Center employees, patients and visitors. The quality of care at
MidMichigan Medical Center - Gladwin is independently verified through accreditation from
The Joint Commission. The Medical Center most recently was named one of the Top 100 Critical
Access Hospitals in the United States by The Chartis Center for Rural Health in 2019 and most
recently received the Michigan’s Quality Improvement Organization (MPRO) 2019 Governor’s
Award of Excellence for outstanding achievement in Effective Reporting and Measurement in
Critical Access Hospitals.

                                                                                                7
Michigan Medical Center - Gratiot
MidMichigan Medical Center - Gratiot, a 96 licensed-bed hospital located in Alma, has provided
care for Gratiot County and surrounding areas since 1955. More than 130 physicians and mid-
level practitioners serve on the active medical staff in 21 different medical specialties. The
hospital also provides an urgent care clinic and 24-hour emergency department. There are
more than 621 employees and 250 volunteers. Joint Commission accredited, the hospital most
recently received Michigan’s Quality Improvement Organization (MPRO) 2019 Governor’s
Award of Excellence for outstanding achievement in Effective Reporting and Measurement in
Outpatient Quality Reporting Acute Care Hospitals. The Medical Center received a B in patient
safety from The Leapfrog Group for the Spring 2018 Hospital Safety Score.
MidMichigan Medical Center - Midland
A 324 licensed-bed hospital located on 180 acres of wooded campus, MidMichigan Medical
Center - Midland is the flagship of the MidMichigan Health system. From its beginning in 1944,
the medical center has established itself as a leader in quality state-of-the-art health care. In
August 2018, MidMichigan Medical Center - Midland was named one of the top Best Hospitals
in Michigan by U.S. News & World Report - the only hospital in the Great Lakes Bay Region to
make the list. Accredited by The Joint Commission, the Medical Center recently received
Michigan’s Quality Improvement Organization (MPRO) 2019 Governor’s Award of Excellence for
outstanding achievement in Effective Reporting and Measurement in 8 Outpatient Quality
Reporting Acute Care Hospitals. In addition, the Medical Center was recognized as one of the
nation’s 2016 100 Top Hospitals® by Truven Health Analytics™, was one of a select few to earn
the 2016 100 Top Hospital’s Everest® Award and was recognized as one of the nation’s 50 Top
Cardiovascular Hospitals by Truven in 2017. The active medical staff consists of 166 physicians,
99 percent of whom are board certified. They represent 32 medical specialties providing a full
range of primary care as well as outstanding specialty care
MidMichigan Medical Center - Mt. Pleasant
MidMichigan Medical Center - Mt. Pleasant is a 128,000 square-foot facility conveniently
located on M-20 near I-127. The medical center features a 24/7 Emergency Department,
outpatient surgery center and a full range of outpatient services, including physician offices,
lab, imaging and cardiovascular testing. It is fully-equipped and credentialed to provide care for
all common emergency conditions, including heart attack, stroke and minor trauma. The
department’s trauma fast-scan ultrasound equipment can be used at the patient’s bedside,
with X-ray and CT scanning just a few feet away. An on-site laboratory enables fast turnaround
of test results. A telemedicine program enables patients to receive expert consultations from
neurologists and other specialists at Michigan Medicine for faster decision-making.
8MidMichigan Medical Center - West Branch
MidMichigan Medical Center - West Branch is an 88-bed acute care facility located on 44 acres
of rolling countryside in Northeast Michigan. It has three operating suites, a 24-hour emergency
department and a state-of-the-art imaging department. The Medical Center serves a broad
region, with 30 zip codes in Ogemaw, Oscoda, Roscommon, Arenac and Iosco counties.
MidMichigan Medical Center - West Branch has approximately 350 employees, 58 volunteers,
25 active staff physicians, as well as 12 associate staff physicians, 53 consulting staff physicians,
23 allied health professionals and 17 telemedicine physicians. A convenient location just off I-75
as well as a commitment to quality healthcare are just a couple of the reasons why
MidMichigan Medical Center - West Branch is a good choice for healthcare needs. The Medical
Center offers state-of-the-art diagnostic imaging, surgical specialties, rehabilitation programs,
educational courses specific to your condition and a revolutionary Wound Care Center. Also,
the campus features walking trails and gardens that can be enjoyed by Medical Center
employees, patients and visitors.
Community Served
Community Served will focus on MidMichigan Medical Center-West Branch’s Primary and
surrounding counties, including Ogemaw, Roscommon, Arenac, Iosco and Oscoda counties. The
community served is comprised of zip codes: 48635 (Lupton), 48654 (Rose City), 48661 (West
Branch), 48756 (Prescott), 48761 (South Branch), 48610 (Alger), 48658 (Standish), 48659
(Sterling), 48703 (Au Gres), 48749 (Omer), 48765 (Turner), 48766 (Twining), 48730 (East
Tawas), 48739 (Hale), 48743 (Long Lake), 48748 (National City), 48750 (Oscoda), 48763 (Tawas
City), 48770 (Whittemore), 48627 (Higgins Lake), 48629 (Houghton Lake), 48651 (Prudenville),
48653 (Roscommon), 48656 (St. Helen), 48619 (Comins), 48621 (Fairview), 48636 (Luzerne),
48647 (Mio).
Introduction/Framework
The Community Health Needs Assessment (CHNA), while a requirement every
three years under the Patient Protection and Affordable Care act for our tax-
exempt status, is an important reflection of MidMichigan Health’s mission, vision,
core values and the system’s goal to become a leader in our regions to improve
the health of our communities. Community is a foundational element in
9MidMichigan Health’s strategic plan and we believe that all people should have
the opportunity to make healthy choices for a long, prosperous life, despite an
individual’s socioeconomic status, education or background.
The CHNA, as a key component for identifying top health concerns in a given area,
will be vital in accomplishing the four objectives of the “Quadruple Aim”: Improve
health outcomes in the community, enhance patient experience, enhance
provider experience and reduce the cost of care.
The primary purpose for the Community Health Needs Assessment for
MidMichigan Medical Center-West Branch is to gain an understanding of the
health needs caused by disparities in social determinants of health (SDOH) as well
as strengths in the given service area. We do so by analyzing a large and specific
collection of data and community input in the region which includes Ogemaw,
Roscommon, Iosco, Oscoda and Arenac counties. With this understanding of the
needs in our communities, we will be equipped to develop a three year strategic
plan to improve the health outcomes in our communities and build health
improvement capacity for the future health of its residents.
Phase I: Planning
Planning for the CHNA strategy includes identifying resources and community
stakeholders within the Medical Center’s service area. The community Health
specialist participates in community collaborative groups that are comprised of
local organizations and community leaders who focus on the health of the
residents. These groups include local non-profit organizations and health
coalitions that collaborate to achieve mutual health related goals. Phase I includes
the development of a strategy and timeline to be approved by the MidMichigan
Health Eastern Region Leadership Team, who is being utilized as an internal
advisory committee, and the president of MidMichigan Medical Center-West
Branch.
Phase II: Data Collection/Analysis
Data collection will include both primary and secondary data from the West
Branch service area. Secondary data will include public health indicators that are
collected to determine the demographics and health status of each of the
counties serviced by MidMichigan Medical Center-West Branch. This data will be
10compared to benchmarks in the State of Michigan. A health indicator that fails to
meet the state benchmark will be identified as a need in the community. Primary
data will include the input of those representing the local communities. This local
input will be provided through a survey comprised of questions that are intended
to provide an overview of the perceived health needs of community members.
This survey will be provided through inpatient/outpatient service locations, as
well as through an outreach campaign in the community and with local
community stakeholders for comparison. Once data is collected, it will then be
analyzed to identify specific focus areas for the West Branch service area.
Secondary Data:
Over 200 indicators for each of the five counties were utilized to build the data platform for
MidMichigan Medical Center-West Branch’s service area. (Appendix B). Public Health data was
collected and was then compared to a benchmark. If an indicator was out of range of the
bench mark, it is indicated in red on the table. This data was categorized to determine areas of
focus where health issues existed.
Primary Data:
A 2021 Wellbeing Survey was conducted to understand the health needs and the vitality of the
communities served. The survey was presented to the CHNA Community Collaborative team
for approval and for final suggestions to ensure the survey met the needs of the HSCC and
other county agencies in each of the communities served.
The collaborative team then aimed to collect data form across each county. Efforts were made
to obtain a sample of data that was representative of each county, and each zip code. Data
collection occurred both online and via paper surveys. Surveymonkey.com was used to
administer the online survey and the link was sent via email to agencies, organizations and
email contact lists from each organization. The survey was also advertised on agency social
media pages and local newspapers. The survey was also administered at various locations
throughout each county and mailed to organizations with harder to reach populations with
limited access to internet. Participants completed the paper surveys at home and returned it in
a postage paid envelope. The sample generated a total of 334 survey responses for analysis.
This total included 213 online surveys, and 121 paper surveys.
11Phase III: Prioritizing Focus Areas
In phase III of the CHNA, we are utilizing specific analytic practices to determine
focus areas and decide our top priorities in order to develop an implementation
plan. Each indicator from primary and secondary data will be scaled and
categorized into a subset piece of data to determine where our needs are in our
community and how we can address them. The community health specialist will
work with internal and external sources to determine focus areas and provide a
communication document that can be reviewed. This data and focus area
prioritization will be presented to the MidMichigan Health Eastern Region
Leadership Team for suggestion and approval. When approved, it will be collected
and presented to the Board of Directors and placed on the MidMichigan Health
website for public view and comment.
PHASE IV: Develop Implementation plan/execution/PDCA
Once the data and focus areas are approved, the next step will be to develop a
comprehensive, three year implementation plan that outlines specific goals,
objectives and strategies to improve the health outcomes of the community.
Review of the focus areas and data analysis will determine what our goals will be,
and objectives will be created with those goals in mind and strategies to complete
Demographics
There are 20,952 residents in Ogemaw County. Of those, 18.5 percent are under 18 years of age
and 25.8 percent are 65 and older. Females make up 50.2 percent of the population while
males make up 49.8 percent of the population. The median age in Ogemaw County is 50.4 years
of age. Of the population, 94.4 percent is white, 2 percent is Hispanic, 0.3 percent is black or
African American and 1.0 percent is American Indian or Alaskan Native. In Ogemaw County, the
percentage of people who self-reported their health to be fair or poor was 15 percent.
12There are 15,041 residents in Arenac County. Of those, 18.2 percent are under 18 years of age
and 24.9 percent are 65 and older. Females make up 49.6 percent of the population while
males make up 50.4 percent of the population. The median age in Arenac County is 50 years of
age. Of the population, 94.5 percent is white, 2 percent is Hispanic, 0.5 percent is black of
African American and 1.2 percent is American Indian or Alaskan Native. In Arenac County, the
percentage of people who self-reported their health to be fair or poor was 16 percent.
There are 23,884 residents in Roscommon County. Of those, 14.7 percent are under 18 years of
age and 32.5 percent are 65 and older. Females make up 49.9 percent of the population while
males make up 50.1 percent of the population. The median age in Roscommon County is 56.2
years of age. Of the population, 94.5 percent is white, 2 percent is Hispanic, 0.5 percent is black
13or African American, and 1.0 percent is American Indian or Alaskan Native. In Roscommon
County, the percentage of people who self-reported their health to be fair or poor was 16
percent.
There are 8,276 residents in Oscoda County. Of those, 19.5 percent are under 18 years of age
and 27.2 percent are 65 and older. Females make up 48.7 percent of the population while
males make up 51.3 percent of the population. The median age in Oscoda County is 51.8 years
of age. Of the population, 95.2 percent is white, 2 percent is Hispanic, 0.5 percent is black or
African American, and 1.0 percent is American Indian or Alaskan Native. In Oscoda County, the
percentage of people who self-reported their health to be fair or poor was 15 percent.
14There are 25,081 residents in Iosco County. Of those, 16.4 percent are under 18 years of age
and 29.6 percent are 65 and older. Females make up 50.4 percent of the population while
males make up 49.6 percent of the population. The median age in Iosco County is 52.9 years of
age. Of the population, 93.4 percent is white, 2.4 percent is Hispanic, 0.7 percent is black of
African American, and 1.0 percent is American Indian or Alaskan Native. In Iosco County, the
percentage of people who self-reported their health to be fair or poor was 15 percent.
Determinants of Health
Determinants of health are the non-medical factors that incluence health factors and health
outcomes. They are the conditions in the environment in which people are born, work, live or
play that can affect a wide range of health and quality of life outcomes.
Economic Stability
ALICE is an acronym for Asset Limited, Income Constrained, Employed Households that earn
more than the Federal Poverty Level, but less than the basic cost of living for the county (the
ALICE Threshold). Combined, the number of ALICE and poverty-level households equals the
total population struggling to afford basic needs. The number of households below the ALICE
Threshold changes over time; households move in and out of poverty and ALICE status as
circumstances improve or worsen. The graphs below show the ALICE distribution and
unemployment rate by county for Ogemaw, Arenac, Roscommon, Oscoda, and Iosco counties,
according to the Michigan Department of Health and Human Services. Ogemaw County’s
15unemployment rate is 7.0 percent, which is slightly lower than in 2018, which was 9.7 percent.
Roscommon County also saw improvement in its unemployment rate from 11.3 percent in 2018
to now, 7.8 percent. Arenac County’s median household income is $42,290, which is $14,407
lower than the state of Michigan. Iosco County per capita income is $25,264. In Oscoda County,
73 percent of students are eligible for free lunch.
Education
The high school graduation rate in both Ogemaw County and Iosco County is 91.0 percent. The
high school graduation rate in both Arenac County and Oscoda County is 90.0 percent. The
high school graduation rate for Roscommon County is 81.0 percent, which is the same as the
16state of Michigan. Only 6.7 percent of Oscoda County’s population has a Bachelor’s degree. In
both Roscommon County (62.4 percent) and Oscoda County (66.7 percent), third graders are
not proficient in English, which is higher than Michigan’s percentage, 54.9. In all five counties,
over half of 3 and 4 year old’s are not enrolled in preschool.
Access to Care
Affordable, quality health care is essential to physical, social and mental health. It is important
to ensure that providers offer affordable care, be available to patients, that patients
understand the care they are receiving and that the community is able to obtain that care. In
addition, it is equally important for the community to be able to have access to other
preventative measures outside of the physical care they receive from a provider, such as access
to healthy and affordable food options and opportunities for regular physical activity that is
important for managing health.
Access to Health Services
The graphs below show the primary care provider rate in Ogemaw, Arenac, Roscommon,
Oscoda, and Iosco counties. Oscoda’s primary care provider rate is the highest of the five
counties at 4,140:1 compared to the Michigan rate of 1,280:1. Additionally, Oscoda’s mental
health provider rate is also the highest, at 2,070:1 compared to Michigan’s rate of 370:1. Having
a large patient to provider ration can cause barriers to health due to providers not accepting
new patients and creating long waiting periods of time to be seen. As shown in the graph
below, the non-physician primary care ratios are within the Michigan Benchmarks. It is worth
noting that this data is from 2019, the earliest data that is obtainable, and does not reflect the
recent work conducted by MidMichgian Medical Center-West Branch from 2019-2021. The
perception in the community is that there are no available appointments and long wait times to
see a provider. The dashboards at MidMichigan Health prove otherwise, showing
appointments available and the ability for current providers to see many more patients. This is
an indicator that provider engagement in the community is essential to eliminating
misconceptions and will make access to health services widely available.
17Healthcare Coverage and Health Literacy
Another key component to health is health insurance. Without it, many will be unable to
receive the services that they may need to maintain a healthy lifestyle and precent disease. The
rate of uninsured adults in all five of these counties is 9 percent or higher, compared to 7
percent for the state of Michigan. The rate of uninsured children was higher than Michigan for
4 out of the 5 counties, except for Iosco which had the same percentage as the state of
Michigan (3 percent). Additionally, the increasing rate of the ALICE population is also an
indication that there is an increase in the underinsured population as well. Given the ALICE
population’s economic status, they are likely to choose a less expensive coverage option with
limited coverage and higher deductibles, and also more likely to decline or not have available
any dental or vision coverage as well.
Another key component in addition to coverage is the cost of care. In the 2021 Wellbeing
Survey, over 40 percent of respondents stated that they postponed or did not receive care
within the last 12 months. The top three reasons for not receiving care were cost, covid-19
concerns and no appointment available. Relating to cost, nearly 54 percent of respondents
stated that they do not know about MidMichigan Health’s financial assistance policy.
Health Literacy or lack thereof, is an indication that patients and community members may not
understand the coverage they are choosing, or may not understand the care they are receiving.
This is an indication of a lack of access to education due to proximity to public libraries, media
centers and the limited availability of broadband internet access in the rural areas. Each of the
census tracts in the communities served by MidMichigan Medical Center-West Branch are in
the bottom two quartiles for health literacy, as shown on the map below.
1819
Percent of population with
                                                         broadband internet.

                                                         Lighter colors indicate areas with
                                                         lower percent of population with
                                                         broadband internet.

Health Behaviors
An individual’s behavior can play a role in health outcomes. For example, if an individual quits
smoking, his or her risk of developing heart disease is greatly reduced. Out of the 83 counties in
Michigan, Ogemaw ranked 72 for health outcomes, Arenac ranked 65, Roscommon ranked 75,
Oscoda ranked 82, and Iosco ranked 76. For health factors, Ogemaw ranked 80, Arenac ranked
76, Roscommon ranked 77, Oscoda ranked 79, and Iosco ranked 64. The data to follow is a
reflection on health behaviors of these five counties in the areas of health care screenings,
substance use, nutrition and exercise.

Preventative Care
Of the Medicare population for all five counties, less than 50 percent had a mammogram
screening in the past two years. Currently, the female vaccination rate for the Human
papillomavirus (HPV) in the state of Michigan is 45.1 percent. Iosco had the lowest rate of the

                                                                                                  20
five counties at 19.1 percent. For males, the rate for Michigan is 43.1 percent and Iosco again
had the lowest rate of the five counties at 23.7 percent.
Maternal Infant Health
The annual Kids Count report from the Annie E. Casey Foundation measures 16 indicators of
childhood well-being, from the rate of low birth weights and teen pregnancy to third-grade
reading abilities and the prevalence of single-parent families. Four of the counties in the West
Branch area were around 30 percent for the less than adequate prenatal care indicator, but
Iosco was much higher at 51 percent.
Maternal Tobacco use during pregnancy can cause tissue damage in the unborn baby and cause
lung and brain issues. Some studies also suggest a relationship between tobacco use and
miscarriage according to the CDC. Maternal tobacco use in Ogemaw county rated above 30
percent, while Iosco county reported above4 0 percent and Oscoda with the lowest rate at 29
percent, which is still more than twice the Michigan average of 14 percent.
Late or no prenatal care is already higher in Michigan than many other states with a rate of 14
percent, and counties such as Iosco have rates of late/no prenatal care near 45 percent. This
means that nearly half of all pregnant mothers in that particular county are not receiving
prenatal care until the third trimester of their pregnancy, or they aren’t receiving care at all.
Following Iosco County is Arenac (36 percent), Ogemaw (30 percent), Roscommon (31 percent)
and lastly Oscoda (29 percent).
21Substance Use
According to County Health Rankings, the percentage of adults who reported excessive drinking
are as follows, Ogemaw (18 percent), Arenac (18 percent), Roscommon (16 percent), Oscoda
(17 percent), and Iosco (17 percent). All were lower than Michigan, which is 20 percent. The
percentage of adults that reported cigarette smoking was, Ogemaw (19 percent), Arenac (18
percent), Roscommon (17 percent), Oscoda (17 percent), and Iosco (17 percent). All were lower
than Michigan except Ogemaw, which was the same (19 percent). The percentage of births to
mothers who smoked during pregnancy was almost double the Michigan rate for each county,
Ogemaw (30.6 percent), Arenac (33.9 percent), Roscommon (36.1 percent), Oscoda (30.7
percent), and Iosco (34.2 percent), compared to Michigan’s rate of 14.4 percent.
22Nutrition and Exercise
The food insecurity rate for all counties was the same as Michigan, at 14 percent, except for
Roscommon where it was 15 percent. Both Ogemaw (68 percent) and Arenac (70 percent) had
significantly lower percentages of access to exercise opportunities compared to Michigan (84
percent).
A lack of physical activity can lead to many risk factors for heart disease such as obesity, high
blood pressure, high cholesterol and type 2 diabetes. Regular physical activity has many
physical, mental and social benefits, however, many people in the MidMichigan Medical
Center-West Branch service area are not getting enough of it. Physical inactivity remains high
and is trending upwards in each of the counties assessed. Roscommon County has the highest
rate of physical inactivity with 38 percent, followed by Ogemaw (34 percent), Arenac, Iosco and
Oscoda (28 percent).
2324
Health Conditions

Many public health and health care interventions focus on changing individual behaviors such
as substance abuse, diet and physical activity. Positive changes in individual behavior can
reduce the rates of chronic disease in this country.

Chronic Conditions & Mortality Rates
All counties except Iosco county had a higher percentage of obesity than Michigan’s 31.2
percent average. Ogemaw and Oscoda Counties reported having the highest obesity rates in
the counties assessed, both over 39 percent. Oscoda reported having the highest diabetes
prevalence in all counties assessed with a rate above 15 percent. Heart disease, which has risk
factors associated with obesity and diabetes, remains the highest in mortality rates for all five
counties. Ogemaw having the highest rate of 265 per 100k, Arenac reporting a rate of 192,
Roscommon at 181, Isoco with a rate of 231 and Oscoda with a rate of 218.

                                                                                               25
Mental Health
Between 17-18 percent of people in Ogemaw, Roscommon, Arenac, Iosco and Oscoda counties
reported having frequent mental distress, higher than the Michigan average of 15%. Frequent
mental distress is defined as 14 or more days of poor mental health per month (age-adjusted).
Suicide is the tenth leading cause of death in the country. Suicide rates across Michigan have
risen by 33 percent, and for ages 15 to 24, it is now the second leading cause of death. Suicide
rates in Ogemaw (29), Oscoda (17), Iosco (31), Roscommon (30), are all far above the Michigan
average rate of 14 per 100,000. Arenac county (14), is the only county not above the Michigan
average of all of the counties assessed.
Mental health provider: Patient ratios in all counties remain high, particularly in Oscoda
(2070:1), Roscommon (1330:1) and Ogemaw (1230:1), compared to the Michigan average of
370:1, despite the high suicide rates, frequent mental distress and high rates of substance use
disorder hospitalizations. These five counties have been established as a “treatment desert”
for mental health services.
26Cancer Incidence
The four leading sites of new cancer cases per 100,00 population were female breas, male
prostate gland, lung/bronchus and colon and rectum. Roscommon and Arenac counties were two
of the top five counties in the state of Michigan for all invasive cancer incidence rate per 100,000
with 535 and 503 respectively.
27Prioritization Process
The community health needs were determined by collecting qualitative primary data and
identifying themes and trends in the data. Quantitative data was collected and compared to a
state benchmark, and those that compared poorly to that benchmark were prioritized as a health
issue. Once the focus areas were identified, prioritization began. Of the Indicators that were
identified, the community collaborative group was asked to choose their top three areas of focus.
Identified areas of focus were narrowed down to cardiovascular disease, obesity, substance use,
food insecurity, access to healthcare, mental health, cancer, prenatal/perinatal quality care,
diabetes, maternal tobacco use, chronic lower respiratory disease and broadband internet access.
These identified needs were then scored based on a modified Hanlon Method, the standard in
prioritizing community health needs. Because MidMichigan Medical Center-West Branch does
not have an equal market share in the counties assessed, a weighted average was used. Ogemaw
county weighing the most, followed by Roscommon, Arenac, Isoco and Oscoda counties.
28The prioritized health issues were then grouped based on similar indicators. For example,
cardiovascular disease, obesity, diabetes and many forms of cancer have similar modifiable risk
factors and can be grouped together as chronic diseases. The top priority areas that have been
identified by the MidMichigan Health Team and the CHNA community collaborative team, and
reviewed by the population health collaborative team, MidMichigan Collaborative Care
Organization board and the MidMichigan Medical Center-West Branch board on June 23, 2020
are as follows:
Chronic Disease Prevention & Treatment
Behavioral Health
Access to Care
Prenatal/Perinatal Quality
Final Steps
The written report will be provided in two parts. Part I will include the data collection,
evaluation, analsys, prioritization and focus area approvals. Part II will be the development of
the Community Health Improvement Plan. The Community Health Team and the CHNA
community collaborative team worked tirelessly to throughout the process to develop the final
product that provides an overview of the medical center, the community and the corresponding
data, data analysis and focus area prioritization for the community served by MidMichigan
Medical Center-West Branch. The 2021 Community Health Needs Assessment will serve as the
report to develop the 2022-2024 Community health Improvement plan. This process will will
outline evidence based strategies for the health improvement in each of the prioritized focus ares.
29Improvement Plan
Upon approval of the focus areas from the population health collaborative team, the
MidMichigan Collaborative Care Organization board and the MidMichigan Medical Center-
West Branch board, the process of developing the Community Health Improvement Plan will
begin. Along with the development of the plan, a process to track progress and continues
measurements will be conducted on a yearly basis to ensure outcome measures are being
strategically addressed. Plans will be modified as needed upon input from the community and
the internal and external teams that collaborate in the effort. A continues Plan, do, check, adjust
(PDCA) process will take place to report progress and make necessary changes.
Approval of the Community Health Needs Assessment focus areas for 2022-2024 took place on
June 23, 2021.
This report will be made publically available on www.midmichigan.org, along with the
Community Health Improvement Plan. This plan will also be filed with the Internal Revenue
Service using from 990 Schedule H.
30Part II: Community Health Improvement Plan
The MidMichigan Medical Center – West Branch Community Health Improvement Plan
for 2021-2024 was built upon previous plans to further reflect MidMichigan Health’s
Mission, Vision, and Core Values, as well as collaborative efforts with the community.
The underlying premise for each MidMichigan Health subsidiary in completing previous
plans was shared ownership for community health. While our previous CHNA’s helped us
identify focus areas for health improvement, the IRS legislation mandating collaborative
efforts provided an opportunity to revisit our needs assessment and strategic planning
processes. Part one of the Community Health Needs Assessment included a detailed
investigation of quantitative and qualitative data from which areas for health improvement
were chosen.
The following plan includes goals and evidenced based strategies to address three focus
areas for health improvement, approved by MidMichigan Medical Center - West Branch
Board of Directors on October 27, 2021. This document reflects input from designated
individuals in each community inclusive of, but not limited to, public health experts,
representatives of low-income and medically underserved populations, and those suffering
from chronic disease. The broadened scope from which we plan to function is inherent in
the strategies which include internal health improvement initiatives of MidMichigan
Medical Center – West Branch and MidMichigan Health, as well as collaborative efforts of
the hospital with public health, the University of Michigan, and our community partners.
The following pages outline the Community Health Improvement Plan for MidMichigan
Medical Center – West Branch.
3132
33
34
Appendix A

Acknowledgement

Thank you to the Community Health Needs Assessment Community Collaborative team and
community agencies that worked hard to complete this assessment.

Sterling Area Health center                    West Branch-Rose City Schools

Ausable Valley Mental Health                   Roscommon Schools

Upnorth Prevention

Catholic Human Services

Ogemaw Hills Free Health Clinic

District Health Department #2

Roscommon Community Foundation

Northeast Michigan Community Service
Agency

Ogemaw Couty Council on Aging

Department of Health and Human Services

Food Bank of Eastern Michigan

Arenac Community center

West Branch Chamber of Commerce

Compassionate care

Northern Michgian Children’s Assessment
center

Ten16

C.O.O.R. Intermediate School District

                                                                                      35
Appendix B
Oge Are Rosco Osc Michi
Indicator maw nac mmon oda Iosco gan Source Date
20,99 15,9 8,63 9,995,9
Population 24,448 25,893 15.00
County Health Rankings 2019
7 03 8
49.6 48.9
Female Population 50.2% 49.9% 50.4% 50.8% County Health Rankings 2019
% %
50.4 51.1
Male Population 49.8% 50.1% 49.6% 49.2% County Health Rankings 2019
% %
18.1 19.4
Population Age Under 18 18.6% 14.8% 16.6% 21.7% County Health Rankings 2019
% %
25.8 27.6
Population Age Over 65 26.3% 33.3% 30.1% 17.2% County Health Rankings 2019
% %
Demogra 96.0 96.7
Population White (Non Hispanic) 96.3% 96.2% 95.3% 74.9% County Health Rankings 2019
phics % %
Population Black or African American 0.4% 0.5% 0.7% 0.5% 0.8% 13.8% County Health Rankings 2019
Population Hispanic or Latino 2.3% 2.0% 2.1% 1.7% 2.4% 5.2% County Health Rankings 2019
Population American Indian or Alaskan
1.0% 1.4% 1.0% 1.0% 1.0% 0.7% County Health Rankings 2019
Native
Determi 21.0 22.0
Poor or Fair Health 22.0% 21.0% 21.0% 18.0% County Health Rankings 2019
nants % %
Health Factors 77 75 76 78 45 * County Health Rankings 2019
Health Outcomes 69 62 76 80 67 * County Health Rankings 2019
Drinking Water Violations No No No No No * County Health Rankings 2019
Environ 69.20 70.5
Access to Exercise Opportunities 99.40% 95% 90.80% * RWJF 2019
ment % 0%
US Department of
WIC- Authorized Food Store Access 1 2 * 1 4 * 2016
Agriculture; Food Atlas
Violent Crime Rate (per 100,000) 399 256 312 267 267 443 County Health Rankings 2019
Social Associations (per 10,000) 11.4 8.0% 13.0% 13.3 14.7 9.9% County Health Rankings 2019
Social 192.0 137. 161. 124.9
Children in Investigated Families, Ages 0-17 310.2% 259.2% Kids Count 2019
Environ % 6% 5% %
ment 16.8 28.6
Child Abuse Neglect Rate 16.8% 43.5% 30.2% 16.5% Kids Count 2019
% %
Confirmed Victims of Abuse or Neglect,
65 46 153 46 124 35,636 Kids Count 2019
Ages 0-17
36Children in Single Parent Households 4.2% 4.8% 4.9% 3.6% 4.0% 6.5% U.S Census Bureau 2019
People 65+ Living Alone 8.9% 8.5% 10.3% 9.6% 10.2% 8.1% U.S Census Bureau 2019
Disconnected Youth * 13% * 21% 7% 7% County Health Rankings 2019
12.4
Children in Out-of-Home Care, Ages 0-17 11.1% 8.8% 8.0% 8.3% 5.0% Kids Count 2019
%
Less than 9th Grade 2.9% 2.5% 2.4% 6.2% 2.1% 2.9% U.S Census Bureau 2019
10.4
9th to 12th Grade, No Diploma 11.2% 9.0% 7.7% 9.0% 6.3% U.S Census Bureau 2019
%
41.9 37.4
High School Graduate 38.2% 38.4% 38.3% 28.9% U.S Census Bureau 2019
% %
90.0 90.0
High School Graduation Rate 91.0% 81.0% 91.0% 81.0% County Health Rankings 2017
% %
22.8 27.2
Some College, No Degree 25.4% 26.7% 24.9% 23.4% U.S Census Bureau 2019
% %
11.2
Associate's Degree 10.1% 9.4% 8.3% 9.9% 9.4% U.S Census Bureau 2019
%
Bachelor's Degree 8.0% 8.7% 9.0% 6.7% 10.0% 17.7% U.S Census Bureau 2019
Educatio
n Graduate or Professional Degree 4.2% 3.8% 6.5% 3.9% 5.9% 11.4% U.S Census Bureau 2019
High School Dropouts 10.7% 9.8% 9.6% * 4.0% 7.8% Kids Count 2020
Students Not Proficient in Grade 3 English 33.1 66.7
53.6% 62.4% 51.9% 54.9% Kids Count 2019
(M-Step) % %
60.9 69.9
3 and 4 Year Olds Not in Preschool 53.9% 68.3% 63.4% 52.5% Kids Count 2019
% %
Students in Special Education 1.7% 2.9% 3.2% 2.7% 5.4% 4.1% Kids Count 2019
$40,3 $42, $42,3 $56,69 Michigan Department of
Median Household Income $42,054 $43,678 2019
73 290 35 7 Health and Human Services
$23,7 $24, $24,8 $31,71
Per Capita Income $25,807 $25,264 U.S Census Bureau 2019
87 328 89 3
17.2 15.4
Persons in Poverty 18.2% 15.3% 14.2% 13.0% U.S Census Bureau 2019
% %
Children Under 18 Living Below Poverty 24.0 28.0
27.0% 33.0% 28.0% 19% County Health Rankings 2019
Econom Level % %
y 11.6 American Community
Families Living Below Poverty Level 12.1% 11.8% * 10.4% 17.6% 2019
% Survey
American Community
People 65+ Living Below Poverty Level 10% 8% 7% 11% 8.0% 8.0% 2019
Survey
7.1 6.4
Unemployment Rate 7.0% 7.8% 6.4% 4% County Health Rankings 2018
% %
Food Stamp/SNAP Benefits in the Past 12 15.7 17.6 Centers for Disease Control
20.7% 17.8% 19.6% * 2016
Months % % and Prevention
37Students Eligible for Free Lunch Program 57% 60% 72% 73% 71% 50% County Health Rankings 2017
15.6 16.3
People with Disability, Under Age 65 17.3% 19.0% 16.8% 10.2% U.S Census Bureau 2019
% %
ALICE level households above poverty, but 29.8 28.6
27.8% 28.7% 23.8% 25.0% United Way 2019
less than basic cost of living % %
Severe Housing Problems 15% 11% 15% 17% 12.0% 15.0% County Health Rankings 2019
2,620: 3,01 4,14
Primary Care Provider Ratio 2,390:1 1,940:1 1,280:1 County Health Rankings 2019
1 0:1 0:1
792: 2,06
Other Primary Care Providers Ratio 873:1 955:1 1,003:1 944:1 County Health Rankings 2019
1 9:1
1,230: 500: 2,07
Mental Health Provider Ratio 1,330:1 510:1 370:1 County Health Rankings 2019
1 1 0:1
2,620: 2,14 4,14
Population of Dentist Ratio 2,390:1 1,790:1 1,340:1 County Health Rankings 2019
1 0:1 0:1
10.0
Uninsured Adults 9.0% 9.0% 9.0% 9.0% 7.0% County Health Rankings 2019
Access to %
Health Uninsured Children 4.0% 5.0% 4.0% 5.0% 3.0% 3.0% County Health Rankings 2019
Services
Uninsured Seniors 6.6% 6.5% 7.2% 7.7% 6.5% 5.4% U.S Census Bureau 2018
6,73 4,71 2,86 Centers for Medicare and
Medicare Insured * 2019
4 9 9,353 0 8,812 Medicaid Services
5,86 4,02
Preventable Hospital Stays 5,062 3,924 3,381 5,203 County Health Rankings 2019
7 4
Care 53.8 42.5
Medicaid Paid Births Single Year 56.7% 68.4% 58.0% 41.5% Kids Count 2019
Access % %
84.1 46.2
Fully Immunized Toddlers, Age 2 80.2% 74.8% 79.0% 73.9% Kids Count 2019
% %
People that Use Public Transportation to Get
0.2% 0.4% 0.9% 0.1% 0.2% 1.3% U.S Census Bureau 2019
to Work
People that Walk to Work 1.9% 2.6% 2.5% 2.8% 2.8% 2.2% U.S Census Bureau 2019
28.2 19.4
Mean Travel Time to Work (Minutes) 24.6% 24.9% 20.6% 24.6% U.S Census Bureau 2019
% %
Transpor 83.8 78.9
tation Driving Alone to Work 83.3% 77.0% 80.6% 82.3% U.S Census Bureau 2019
% %
Households Without Access to a Vehicle 6.1% 5.4% 7.1% 7.3% 6.1% 7.7% U.S Census Bureau 2019
Sepsis, unspecified organism 112 * * * * * MidMichigan Health
Top 10 Pnuemonia, unspecified organism 48 * * * * * MidMichigan Health
Inpatient
Bronchitis 45 * * * * * MidMichigan Health
MS-
DRGs Unspecified atrial fibrillation 44 * * * * * MidMichigan Health
Acute Kidney Failure 43 * * * * * MidMichigan Health
38Chronic obstructive pulmonary disease 41 * * * * * MidMichigan Health
Hypertensive heart and chronic kidney
38 * * * * * MidMichigan Health
disease with heart failure
Hypertensive heart disease with heart failure 26 * * * * * MidMichigan Health
Unilateral primary osteoarthritis, left knee 22 * * * * * MidMichigan Health
Unilateral primary osteoarthritis, right knee 18 * * * * * MidMichigan Health
Other 813 * * * * * MidMichigan Health
Breathing Problems * 166 * * * * MMR
Falls * 157 * * * * MMR
Traffice/Transportation/Accidents * 139 * * * * MMR
Unconscious/Fainting (Near) * 104 * * * * MMR
Sick Person (Specific Diagnosis) * 95 * * * * MMR
Top
MMR Chest Pain (Non-Traumatic) * 83 * * * * MMR
Nature
of Call - Convulsions/Seizures * 69 * * * * MMR
Arenac Unknown Problem (Man Down) * 66 * * * * MMR
Stroke (CVA) * 61 * * * * MMR
Pandemic Flu * 55 * * * * MMR
Cardiac or Respiratory Arrest/Death * 44 * * * * MMR
Hemorrhage/Lacerations * 44 * * * * MMR
24.2 25.8
Utility Assistance 30.9% 23.3% 22.4% * 211 2020
% %
Income Support/Assistance 2.0% 1.8% 3.7% 2.4% 1.8% * 211 2020
18.5 22.2
Housing 18.3% 17.9% 18.5% * 211 2020
% %
Food/Meals 13.3% 9.2% 8.8% 9.9% 8.6% * 211 2020
Top 10
Information Services 2.9% 3.3% 2.7% 2.4% 2.4% * 211 2020
Referrals
for 211 Legal, Consumer and Public Safety Services 3.7% 5.5% 5.3% 4.0% 3.3% * 211 2020
Transportation 1.6% 2.1% 2.3% 1.6% 3.1% * 211 2020
Clothing/Personal/Household Needs 2.9% 4.7% 2.0% 3.2% 2.4% * 211 2020
10.5 19.0
Health Care 17.7% 18.4% 18.3% * 211 2020
% %
Individual, Family and Community Support 2.9% 3.3% 2.9% 2.4% 2.4% * 211 2020
Diagnosed Diabetes Prevalence 17.0% 16.0 14.0% 19.0 18.0% 11.0% County Health Rankings 2019
39% %
Mammogram Screening (Medicare 50.0 37.0
42.0% 45.0% 46.0% 44.0% County Health Rankings 2019
Population) % %
54.0 42.0 MDHHS: Immunization
Pneumonia Vaccination (PPSV23 65+) 37.5% 64.9% 45.0% 49.5% 2020
% % Report Card
47.1 19.1 MDHHS: Immunization
HPV Vaccination - Females 37.4% 47.0% 49.8% 45.1% 2020
% % Report Card
45.2 23.7 MDHHS: Immunization
HPV Vaccination - Males 32.3% 46.2% 45.8% 43.1% 2020
% % Report Card
37.7 23.7 MDHHS: Immunization
Influenza Vaccination Rate 25.3% 42.0% 36.5% 31.4% 2020
% % Report Card
Births with Late or No Prenatal Care 4.8% 6.3% 2.8% 9.6% 7.3% 5.6% Kids Count 2019
37.5 51.0
Less than Adequate Prenatal Care 34.6% 28.5% 36.8% 32.2% Kids Count 2019
% %
18.0 17.0
Adult Smoking 19.0% 17.0% 17.0% 19.0% County Health Rankings 2017
% %
Parental Smoking 31% 14% Kids Count 2019
34.0 35.0
Adults who Reported Insufficient Sleep 35.0% 35.0% 35.0% 37.0% County Health Rankings 2017
% %
People Living with HIV (per 100,000) 77 38 65 84 50 189 County Health Rankings 2018
Sexually Transmitted Infections (per 313.
238.3 226 230.2 218.6 507.9 County Health Rankings 2019
100,000) 7
Percentage of High School Students who 38.4
38.4% 38.4% * MiPHY 2018
Ever Drank Alcohol %
Percentage of High School Students who 23.3
23.3% 23.3% * MiPHY 2018
Ever Tried Cigarette Smoking %
Percentage of High School Students who
Behavior 18.0
Used an Electronic Vapor 18.0% 18.0% MiPHY 2018
al Health %
Product During the Past 30 Days
Percentage of High School Students who 24.4
24.4% 24.4% * MiPHY 2018
Ever Tried Marijuana %
188. 157. Michigan Department of
Chlamydia Incidence Rate 114.3 191.5 159.2 504.40 2019
1 7 Health and Human Services
HIV Prevalence Rate (Per 100,000) 77 38 65 84 50 189 County Health Rankings 2019
18.0 17.0
Excessive Drinking 18.0% 16.0% 17.0% 20.0% County Health Rankings 2019
% %
14.0 14.0
Frequent Mental Distress 14.0% 14.0% 14.0% 14.0% County Health Rankings 2019
% %
19.81 22.5 17.8 20.87 Centers for Medicare and
Depression (Medicare Population) 20.11% 19.69% 2018
% 2% 1% % Medicaid Services
Births to Mothers who Smoked During 33.9 30.7
30.6% 36.1% 34.2% 14.4% Kids Count 2019
Pregnancy % %
40Percentage of Students who Ever had Sexual
Intercourse (County)
Percentage of Students who were Physically
Hurt on Purpose by Someone they were *Not Michigan Profile for Health 2017 -
9% 10% 9% 9% *
Dating or Going out with During the Past 12 available Youth 2018
Months
Number of Births per 1,000 Females,
23 27 29 33 39 20 County Health Rankings 2019
Age 15-19
Teen Pregnancy Rate (per 1,000) 32.7 29.4 Kids Count 2017
17.9
Repeat Teen Births, Age 15-19 * 23.3% * 22.7% 16.2% Kids Count 2019
%
29.7 29.7
Sexually Active Teens 29.7% MiPHY
% %
49.1
Child and Teen Deaths, Age 1-19 * * * * 26.3% Kids Count 2019
%
4.7
Teen Tobacco Use 4.7% 4.7% * MiPHY 2018
%
68.8 68.8
Teen Binge Drinking 68.8% * MiPHY 2018
% %
11.6 11.6
Teen Marijuana Use 11.6% * MiPHY 2018
% %
Percent of Middle School Students who 13.7 13.7
Teen
13.7% MiPHY 2018
are Obese % %
Health Percent of Middle School Students who 23.8 23.8
23.8% MiPHY 2018
are Overweight % %
Percent of High School Students who 19.9 19.9
19.9% MiPHY 2018
are Obese % %
Percent of High School Students who 14.4 14.4
14.4% MiPHY 2018
are Overweight % %
Percentage of Middle School Students
who Were Physically Active 55.0 55.0
55.0% * MiPHY
for at Least 60 Minutes Per Day on Five % %
or More of the Past Seven Days
Percent of High School Students who
Saw a Doctor for an Exam When They 69.0 71.0 69.0 *Not Michigan Profile for 2017 -
69.0% *
Were Not Sick or Injured in the Past % % % available Health Youth 2018
Year
Percent of Middle School Students who 66.7 68.9 66.7 *Not Michigan Profile for 2017 -
66.7% *
Saw a Dentist in the Past 12 Months % % % available Health Youth 2018
41Percent of High School Students who 71.4 76.6 71.4 *Not Michigan Profile for 2017 -
71.4% *
Saw a Dentist in the Past 12 Months % % % available Health Youth 2018
36.0 39.0
Adult Obesity 39.0% 34.0% 31.0% 32.0% County Health Rankings 2019
% %
Overweight Adults 43% 39% 41% 31% 34% 32% County Health Rankings 2019
31.0 28.0
Physical Inactivity 31.0% 33.0% 28.0% 23.0% County Health Rankings 2019
% %
Population with No Leisure Time Physical 31.0 28.0
31.0% 33.0% 28.0% 23.0% County Health Rankings 2016
Activity % %
13.0 12.0
Frequent Physical Distress 13.0% 13.0% 12.0% 14.0% County Health Rankings 2017
% %
12.0
Limited Access to Healthy Foods 0.0% 11.0% 1.0% 10.0% 6.0% County Health Rankings 2015
%
14.0 14.0
Food Insecurity 14.0% 15.0% 14.0% 14.0% County Health Rankings 2017
% %
Low Income and Low Access to a Grocery 12.2 US Department of
0.02% 11.4% 0.7% 9.91% * 2015
Store % Agriculture; Food Atlas
Nutrition
People 65+ with Low Access to a Grocery 7.19 0.51 US Department of
and 0.03% 5.94% 5.78% * 2015
Store % % Agriculture; Food Atlas
Exercise
70.0 91.0
Access to Exercise Opportunities 68.0% 99.0% 90.0% 85.0% County Health Rankings 2019
% %
4.92 0.29 US Department of
Children with Low Access to a Grocery Store 0.00% 3.69% 4.0% * 2015
% % Agriculture; Food Atlas
0.13 US Department of
Farmers Market Density 0.10% 0.04% 0.0% 0.16% * 2018
% Agriculture; Food Atlas
US Department of
Fast Food Restaurant Density (per 1,000) 0.84 0.79 0.75 0.73 0.71 * 2016
Agriculture; Food Atlas
0.26 0.36 US Department of
Grocery Store Density (per 1,000) 0.19% 0.17% 0.28% * 2016
% % Agriculture; Food Atlas
Food Environment Index 8.0% 6.9% 6.8% 8.1% 7.3% 7.1% County Health Rankings 2019
Children Eligible for Free or Reduced Price 58.8 75.6
67.6% 71.8% 67.9% 50.5% Kids Count 2020
Lunch % %
16.7 13.28 2015 -
SNAP Participants (% Pop) 20% 15% 17% 16% Community Commons
3.% % 2019
19.4 21.4 25.91 Centers for Medicare and
Kidney Disease 22.4% 26.8% 20.3% 2018
% % % Medicaid Services
22.5 17.8 20.87 Centers for Medicare and
Depression 19.8% 20.1% 19.7% 2018
Health Chronic % % % Medicaid Services
Conditio Conditio Centers for Medicare and
Schizophrenia/Other Psychotic Disorders 2.3% 2.8% 2.4% 1.2% 2.7% 3.64% 2018
ns ns Medicaid Services
Ischemic Heart Disease (Medicare 38.71 34.8 29.5 29.02 Centers for Medicare and
29.60% 30.41% 2018
Population) % 4% 1% % Medicaid Services
Stroke 2.79% 3.35 3.08% 3.08 3.04% 3.81% Centers for Medicare and 2018
42You can also read