CREATIVITY & CONNECTIVITY - January 2019 - Allied Properties REIT
←
→
Page content transcription
If your browser does not render page correctly, please read the page content below

CREATIVITY & CONNECTIVITY January 2019
This presentation may contain “forward looking” information about
future events or the REITs future performance. This information, by
its nature, is subject to risks and uncertainties that may cause actual
events or results to differ materially, including those described
under the heading “Risks and Uncertainties” in our most recently
filed AIF. Material assumptions that underpin any forward-looking
statements we make include those described under “Forward
Looking Disclaimer” in our MD&A for the third quarter of 2018.

                                   2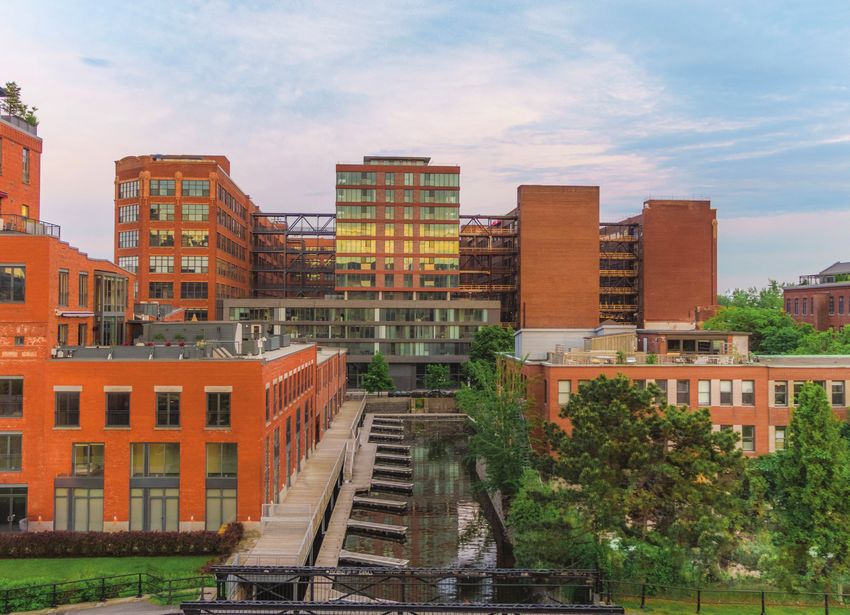
TABLE OF CONTENTS

Investment Highlights .  .  .  .  .  .  .  .  .  .  .  .  .  .  .  .  .  .  .  . 4
Strategy .  .  .  .  .  .  .  .  .  .  .  .  .  .  .  .  .  .  .  .  .  .  .  .  .  .  .  .  .  .  .  .  . 7
Rental Portfolio  .  .  .  .  .  .  .  .  .  .  .  .  .  .  .  .  .  .  .  .  .  .  .  .  . 21
Development Portfolio  .  .  .  .  .  .  .  .  .  .  .  .  .  .  .  .  .  . 37
Development Completions .  .  .  .  .  .  .  .  .  .  .  .  .  .  . 47
Risk Management  .  .  .  .  .  .  .  .  .  .  .  .  .  .  .  .  .  .  .  .  .  . 52
Corporate Social Responsibility .  .  .  .  .  .  .  .  .  . 57
Appendix .  .  .  .  .  .  .  .  .  .  .  .  .  .  .  .  .  .  .  .  .  .  .  .  .  .  .  .  .  . 60

INVESTMENT HIGHLIGHTS

–   At the forefront of urban intensification in Canada’s major cities

–   Fully internalized and entrepreneurial management team

–   Strong growth platform

–   Strong financial foundation

–   29% Compound annual growth rate on total assets

–   16.5% Average annual total return
PORTFOLIO GROWTH - TOTAL ASSETS (M)

                                                                                                                                  120M
                                                                                                                                  IPO

                                                                                                                                  6.4B
                                                                                                                                  Q3 2018

                                                                                                                                  29.2%
                                                                                                                                  CAGR
Values up to December 31st, 2009 are based on financial reporting prepared in accordance with previous Canadian GAAP standards.
Values after that date are reported in accordance with International Financial Reporting Standards (IFRS).
As at period ending September 30, 2018.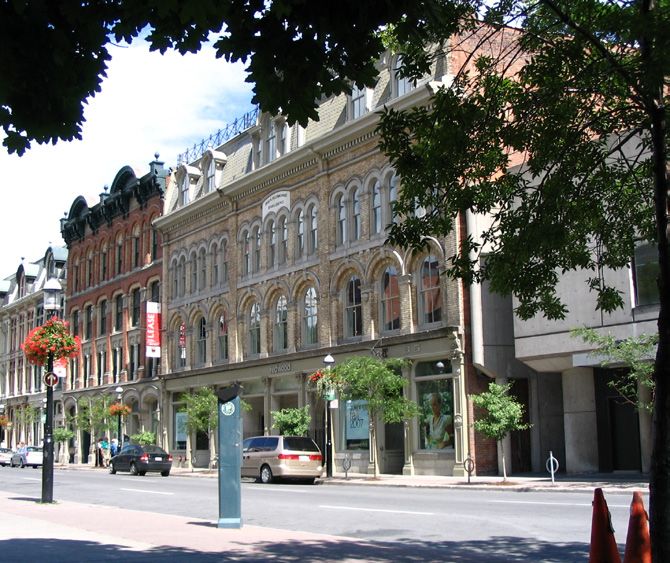
RETURNS TO UNITHOLDERS
                                              TOTAL RETURN INDEX

                                                                     16.5%
                                                                     AVERAGE
                                                                     ANNUAL
                                                                     TOTAL
                                                                     RETURN

Source: Bloomberg as of November 5, 2018.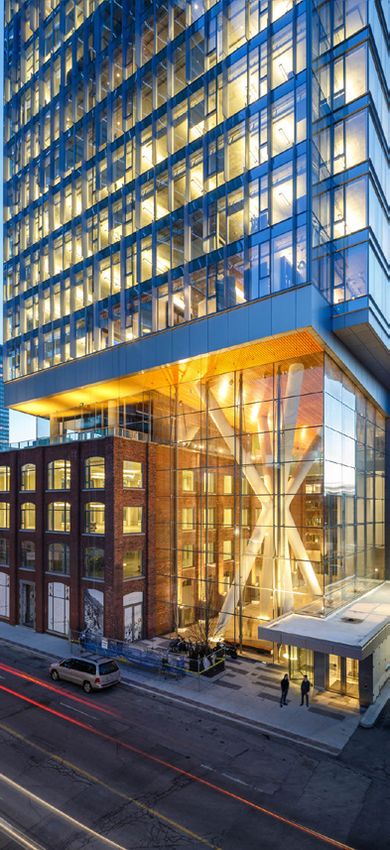
Strategy
CONSOLIDATION OF
     URBAN OFFICE PROPERTIES

– Close to core
– Distinctive
– Lower occupancy costs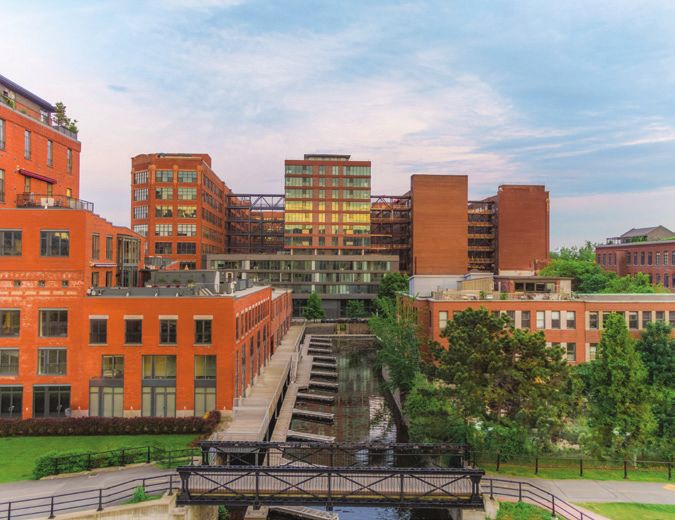
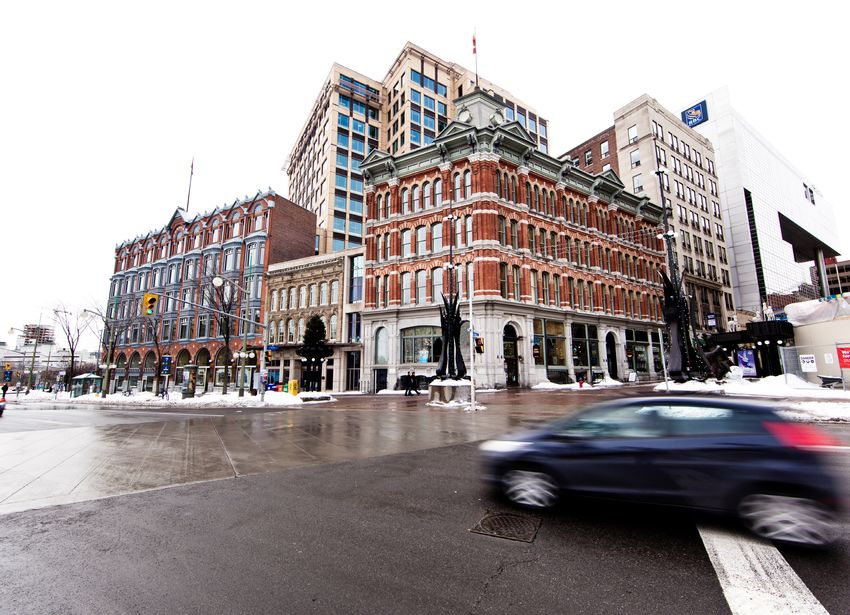
500-522 King West
Toronto
                    9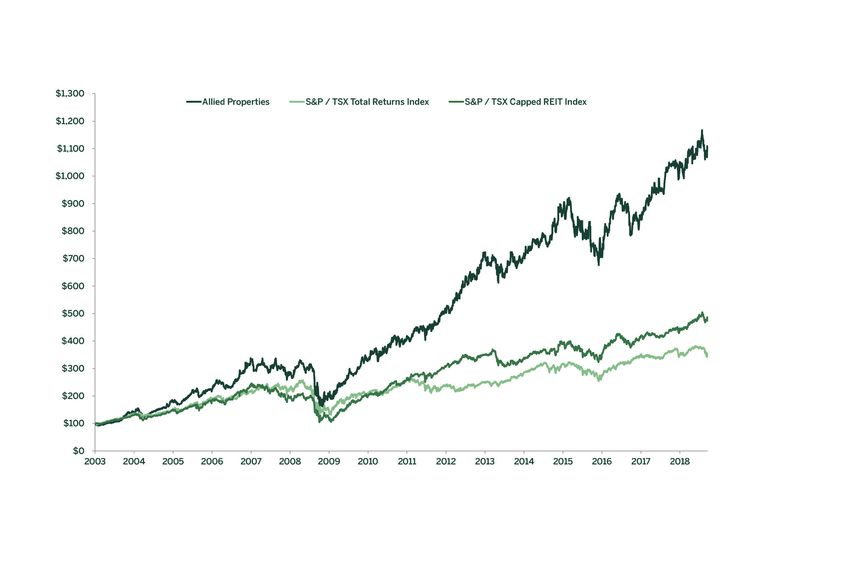
Nordelec
Montréal
The Chambers
Ottawa
               11
35-39 Front Street East Toronto
13
15
INTENSIFICATION OF URBAN
          OFFICE PROPERTIES

–   Underutilized land
–   Additional rental area
    with low land cost
–   High returns
Intensification
of QRC West
Toronto
18Intensification of QRC West Toronto
Intensification of
The Breithaupt Block
Kitchener
                  20
Rental Portfolio
RENTAL PORTFOLIO

                                               148
                                               PROPERTIES

                                               11.0M
                                               SQUARE-FEET

As of September 30, 2018.
TORONTO PORTFOLIO
COLLEGE ST.
REIT
JOINT VENTURE
N
DUFFERIN ST.
ANCILLARY PARKING
DUNDAS ST. W.
BAY ST.
UNIVERSITY AVE.
SPADINA AVE.
CHURCH ST.
SHERBOURNE ST.
PARLIAMENT ST.
JARVIS ST.
QUEEN ST. W.
RICHMOND ST. W.
RICHMOND ST. E.
STRACHAN AVE.
YONGE ST.
ADELAIDE ST. W.
Queen
Richmond
BATHURST ST.
KING ST. W. KING ST. E.
WELLINGTON ST. W.
Central St.Lawrence
FRONT ST. W. Business Market
King West
Entertainment District
King & Spadina
District
GARDINER EXPRESSWAY
LAKESHORE BLVD W.
QUEEN’S QUAY WEST4 KING & SPADINA
N
Toronto
1. 141 Bathurst 21. 552-560 King W
2. 159-161 Bathurst 22. 539 King W
3. 183 Bathurst 23. 544 King W
4. 241 Spadina 24. 555 Richmond W
5. 379 Adelaide W 25. 579 Richmond W
3
6. 383 Adelaide W 26. 589-591 Richmond W
7. 420 Wellington W 27. 662 King W
8. 425 Adelaide W 28. 80-82 Spadina
29
2 26 25 24 6 5 9. 425-439 King W 29. 96 Spadina
8 32 28
1 10. 441-443 King W 30. The Well
12
15 13 11. 445-455 King W 31. King Portland Centre
19
31 23 9
21 11 10 12. 460 King W 32. 387-391 Adelaide
34 14
20 18 16
35 22 13. 464-468 King W 33. 461 King Street W
27 33
17
7 14. 469 King W 34. 485 King
30
15. 478 King W 35. 642 King W
30
30
30 30
16. 489 King W
30
30 17. 495 King W
30
18. 499 King W
19. 500-522 King W
20. 511-529 King WRUE JE
AN-TA
LON O
.
N MONTRÉAL
AVE. DE LORIMIER
1
AVE. CHRISTOPHE-COLOMB
AVE. VAN HORNE
2
RUE BEAUBIEN E. PORTFOLIO
AVE. DU PARC
3 1. 400 Ave. Atlantic
4
5 2. 6300 Ave. Du Parc
Mile End
AVE. ST-JOSEPH E. 3. 5505 Boul. St-Laurent
6
4. 5455 Ave. De Gaspé
5. 5445 Ave. De Gaspé
Central RUE RACHEL E
6. 4446 Boul St-Laurent
BOUL. ST-LAURENT
Business
RUE D’IBERVILLE
AVE. PAPNIEAU
District
RUE ST-DENIS
7
7. 3575 Boul. St-Laurent
PINS
AVE. DES
RUE UNIVERSITY
RUE SHER
8 8. 3510 Boul. St-Laurent
BROOKE
9. 451-481 Rue Ste-Catherine
AUT 9 10. 425 Ave. Viger W
RUE PEEL
ORO
UTE
VILL
E-MA BOUL. RENÉ-LÉVESQUE E.
RIE 10
11. 480 Boul. St-Laurent
ER
AT
Old
W
Montréal
12. 85 Saint-Paul Rue W
AT
15 11
E.
12
AV
Griffintown 13
14
13. 740 Rue St-Maurice
RUE
ST.P
ATR
RUE
CEN
TRE
ICK
16
14. Cité Multimédia
15. 645 Rue Wellington
TON
ING
ELL
RUE
W
16. Le Nordelec
17. 8 Place Du Commerce
PO
NT
VI
CT
OR
IA
17URBAN WORKSPACE
TOP-TEN PROPERTIES
NORMALIZED APPRAISED
PROPERTY NAME LQA NOI FAIR VALUE CAP RATE PRINCIPAL USERS
CITÉ MULTIMÉDIA, MONTRÉAL $22,359 $374,690 5.25% Desjardins, Morgan Stanley, SAP Canada
QRC WEST, TORONTO 12,154 249,180 4.25% eOne, Sapient Canada
LE NORDELEC, MONTRÉAL 11,924 213,570 5.77% Babel Games, Gsoft, Yellow Pages Media
5455 DE GASPÉ AVENUE, MONTRÉAL 7,694 119,880 5.75% Attraction Media, Framestore, Ubisoft
555 RICHMOND WEST, TORONTO 7,465 133,290 4.75% Good Life, Sentinelle, Synaptive
THE CHAMBERS, OTTAWA 6,201 141,780 — National Capital Commission
VINTAGE I & II, CALGARY 5,704 81,870 5.25% Royal & Sun Alliance
THE TANNERY, KITCHENER 5,416 87,530 5.75% Communitech Corp., Desire 2 Learn
5445 DE GASPÉ AVENUE, MONTRÉAL 5,182 80,000 6.00% Sun Life Assurance Company of Canada, Ubisoft
BOARDWALK REVILLON, EDMONTON 5,026 71,320 6.25% Edmonton Public School Board, Legal Aid
TOTAL $89,125 $1,553,110 5.27%NETWORK DENSE
URBAN DATA CENTRES
NORMALIZED APPRAISED
PROPERTY NAME LQA NOI FAIR VALUE CAP RATE PRINCIPAL USERS
151 FRONT STREET WEST, TORONTO $31,837 $490,590 5.50% Bell, Telus, Rogers, Zayo, TorIX, Equinix, Cologix
250 FRONT STREET WEST, TORONTO 13,341 293,000 6.25% Cloud Service Provider, AWS
905 KING STREET WEST, TORONTO 3,619 89,200 6.25% Cloud Service Provider, Beanfield, Cologix
TOTAL $48,797 $872,790 5.83%CONNECTIVITY
Source: PeeringDB.com
28INTERNET TRAFFIC ON TORIX Source: TorIX Website
NOI BY SEGMENT                                    NOI BY USE

                                                 18.1%                           18.1%
                                                 URBAN DATA CENTRES              URBAN DATA CENTRES

                                                                                             8.1%
                                                                                             RETAIL
                                                            11.6%
                                                            WESTERN
                                                                                            4.8%
                                                                                            PARKING

           45.0%
           CENTRAL                                25.3%
                                                  EASTERN               69.0%
                                                                        OFFICE

For the period ending September 30, 2018.
See definition appendix for definition of NOI.
LEASE MATURITIES As of September 30, 2018. This slide contains forward looking information.
LEASE MATURITIES - EASTERN CANADA

As of September 30, 2018.
This slide contains forward looking information.
LEASE MATURITIES - CENTRAL CANADA

As of September 30, 2018.
This slide contains forward looking information.
LEASE MATURITIES - WESTERN CANADA

As of September 30, 2018.
This slide contains forward looking information.
LEASE MATURITIES - URBAN DATA CENTRES

As of September 30, 2018.
This slide contains forward looking information.
TOP-TEN USERS

USER                                       SECTOR     % RENTAL REVENUE (Q3 2018)

                                                                                   49%
CLOUD SERVICE PROVIDER              Data Centre/IT                        3.6%

UBISOFT                                 Gaming/IT                         2.9%

EQUINIX                             Data Centre/IT                        2.7%

COLOGIX                             Data Centre/ IT                       2.4%
                                                                                   2003
NATIONAL CAPITAL COMMISSION,

                                                                                   19.4%
A CANADIAN CROWN CORPORATION           Government                         1.5%

MORGAN STANLEY                            Financial                       1.3%

COGECO DATA SERVICES INC.      Telecommunications                         1.3%

ALLSTREAM                      Telecommunications                         1.3%     Q3 2018
ENTERTAINMENT ONE              Media/Entertainment                        1.2%

BELL CANADA                    Telecommunications                         1.2%

		                                                                       19.4%
Development Portfolio
DEVELOPMENT PIPELINE

                                                                                                                                                ESTIMATED

                                                                                                           Unscheduled                    GLA               NOI

                                                                                                           UNION CENTRE                1,129,000             TBD
                                                                                                           KING & PETER                 790,000             TBD

                                                                                                           LE NORDELEC                  250,000             TBD

                                                                                                           ADELAIDE & SPADINA           245,000             TBD
                                ESTIMATED

2019                             GLA          NOI
                                                                                                           BREITHAUPT PHASE III* 145,000                     TBD

TELUS SKY*                   218,000        $8.0M                                     ESTIMATED
                                                                                                           QRC WEST, PHASE II           90,000              TBD

KING-PORTLAND CENTRE* 136,320               $4.7M     2021                          GLA            NOI     COLLEGE & MANNING*            30,300             $1.1M

			                          354,320      $12.7M       ADELAIDE & DUNCAN* 228,000                 $9.9M                               2,679,300         $1.1M+

                                                              ESTIMATED                                                                                                     ESTIMATED
                                                                                                                                                   2023
                                                                                                                    ESTIMATED
                         2020                                                      2022
                                                        GLA               NOI                                 GLA               NOI                                   GLA               NOI

                        425 VIGER                    300,000        $6.5M          THE WELL*               746,000         $ 4 0. 1 M
                                                                                                                                                   KING & SPADINA* 115,000         $5.5M

                        THE LOUGHEED                   92,600         TBD          KING & BRANT            130,000              TBD

                        400 WEST GEORGIA**           220,800        $9.0M
                                                                                   			 876,000                             $40.1M+

                        			                           613,400      $15.5M+

*Co-ownership

** Allied is currently providing financing on this Westbank development. Subject to placement of
permanent financing, Allied intends to acquire a 50% undivided interest based on total development cost.

Estimated NOI is based on stabilized occupancy.
TELUS Sky Calgary
King Portland Centre
Toronto
                  40
Adelaide & Duncan Toronto
The Well
Toronto
           42
King & Spadina
Toronto
43400 West Georgia Vancouver
425 Viger
Montréal
            45
King & Brant
Toronto
46Development Completions
QRC WEST, TORONTO
This was a pioneering, large-scale intensification project that involved the integratation of two restored heritage
buildings with a new, mid-rise office structure. The project commenced in 2010 and was completed in 2015. It is
comprised of 346,643 square feet of GLA and is fully leased.
DEVELOPMENT ECONOMICS INVESTMENT
LAND COSTS $11,000
HARD & SOFT COSTS 104,000
VALUE
STABILIZED UNLEVERED YIELD VALUE CREATION AS %
CAPITALIZED INTEREST & NOI ON COST FAIR VALUE CREATION OF COST
OPERATING COSTS 15,000
TOTAL DEVELOPMENT COSTS $130,000 $12,150 9.3% $249,180 $119,180 91.7%
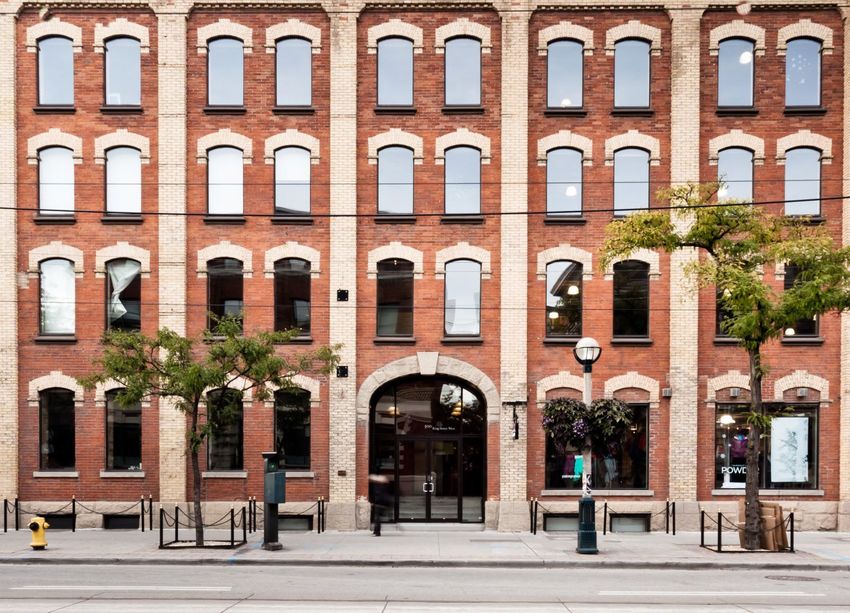
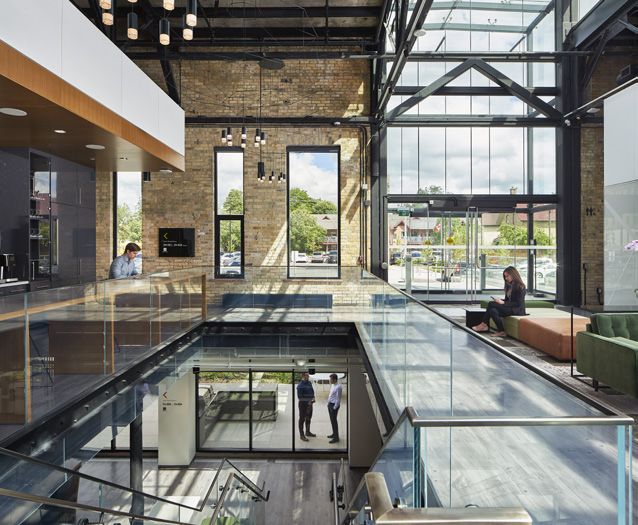
The fair value is provided by our external appraiser, which is calculated based on the discounted cash flow model.THE BREITHAUPT BLOCK, KITCHENER
Allied acquired an undivided 50% interest in the property in 2010 and immediately put it into development,
completing the first phase in 2014 and the second phase in mid-2016. The property is an equal two-way joint
arrangement between Allied and Perimeter Development Corporation. It is comprised of 226,810 square feet of
GLA (Allied's share 113,405 square feet) and is fully leased.
DEVELOPMENT ECONOMICS INVESTMENT
LAND COSTS $4,000
HARD & SOFT COSTS 18,470
VALUE
STABILIZED UNLEVERED YIELD VALUE CREATION AS %
CAPITALIZED INTEREST &
NOI ON COST FAIR VALUE CREATION OF COST
OPERATING COSTS 2,550
TOTAL DEVELOPMENT COSTS $25,020 $1,950 7.8% $44,070 $19,050 76.1%
The fair value is provided by our external appraiser, which is calculated based on the discounted cash flow model.180 JOHN STREET, TORONTO
Allied acquired the property in 2015. The property was redeveloped and leased in its entirety to Spaces. The project
was completed in 2017. It is comprised of 45,631 square feet of GLA and is fully leased.
DEVELOPMENT ECONOMICS INVESTMENT
LAND COSTS $8,700
HARD & SOFT COSTS 17,500
VALUE
STABILIZED UNLEVERED YIELD VALUE CREATION AS %
CAPITALIZED INTEREST &
NOI ON COST FAIR VALUE CREATION OF COST
OPERATING COSTS 1,300
TOTAL DEVELOPMENT COSTS $27,500 $1,600 5.8% $29,690 $2,190 8.0%
The fair value is provided by our external appraiser, which is calculated based on the discounted cash flow model.189 JOSEPH, KITCHENER
189 Joseph was purchased as part of The Tannery in 2012. The building stood vacant, and was slated to be
demolished before Allied proposed the redevelopment and secured Deloitte as the user. The project commenced in
late-2015 and was completed mid-2017. It is comprised of 26,373 square feet of GLA and is fully leased.
DEVELOPMENT ECONOMICS INVESTMENT
LAND COSTS $230
HARD & SOFT COSTS 10,890
VALUE
STABILIZED UNLEVERED YIELD VALUE CREATION AS %
CAPITALIZED INTEREST &
NOI ON COST FAIR VALUE CREATION OF COST
OPERATING COSTS 240
TOTAL DEVELOPMENT COSTS $11,360 $720 6.3% $13,150 $1,790 15.8%
The fair value is provided by our external appraiser, which is calculated based on the discounted cash flow model.Risk Management
DEVELOPMENT

– 15% constitutional limitation
 on development
– Pre-leasing requirement
– Partial monetization
– Financial management
– Joint venture relationships
BALANCE SHEET

                       – Low leverage
                       – Long-term, fixed-rate debt
                       – Debt ratio 27.6%
                       – Interest coverage ratio at 3.1x
                       – Debt to EBITDA ratio 6.4x

Debt in “debt ratio” refers to total debt.
See definition appendix for definition of total debt and EBITDA.
DEBT MATURITY CHART This chart summarizes the principal payments in regards to Allied's various obligations as at September 30, 2018.
UNENCUMBERED ASSETS
Corporate Social Responsibility
CORPORATE SOCIAL RESPONSIBILITY

    “The cities we build have to be sustainable and conducive to human wellness, diversity and creativity.
        Put differently, they have to elevate and inspire the humanity in all of us.” - MICHAEL EMORY

             Sustainability +                          Benchmarking of Portfolio-wide                  CSR Report + GRESB Reporting +
CURRENT      Occupant Engagement Program
                                           2018        Energy & Water Usage                     2020   Aligning with ESG Indices

                                                                            Waste to
                                                                            be added
                                                                            in 2019

                                           2019        Materiality Assessment, Sustainability
                                                       on Website + Investment in ECMs
CORPORATE SOCIAL RESPONSIBILITY
Appendix Definitions
CERTAIN DEFINITIONS AND NON-IFRS MEASURES
Certain defined terms used in this investor presentation have the following meaning:

“EBITDA”
EBITDA is a non-IFRS financial measure and should not be considered as an alternative to net income or net income and
comprehensive income, cash flow from operating activities or any other measure prescribed under IFRS. EBITDA does not have
any standardized meaning prescribed by IFRS. As computed by us, EBITDA may differ from similar computations reported by
other Canadian real estate investment trusts and, accordingly, may not be comparable to similar computations reported by such
organizations. Management considers EBITDA to be a useful measure for the purpose of evaluating debt levels and interest coverage.
For a full explanation of EBITDA and a reconciliation to IFRS please see Allied REIT Q3 2018 MD&A “Other Financial Performance
Measures”.

“INTEREST”
Interest is defined as interest expense and other financing costs including capitalized interest.

“NOI”
NOI is a non-IFRS financial measure and should not be considered as an alternative to net income or net income and comprehensive
income, cash flow from operating activities or any other measure prescribed under IFRS. NOI does not have any standardized meaning
prescribed by IFRS. As computed by us, NOI may differ from similar computations reported by other Canadian real estate investment
trusts and, accordingly, may not be comparable to similar computations reported by such organizations. Management considers NOI to
be a useful measure of performance for rental properties. For a full explanation of NOI and a reconciliation to IFRS please see Allied REIT
Q3 2018 MD&A “Net Operating Income (“NOI”).
“TOTAL DEBT”
Total debt is a non-IFRS financial measure and does not have any standard meaning prescribed by IFRS. As computed by us, total
debt may differ from similar computations reported by other Canadian real estate investment trusts and, accordingly, may not be
comparable to similar computations Reported by such organizations. Management considers total debt to be a useful measure for
evaluating debt levels and interest coverage. For a full explanation of total debt and an illustration of the calculation of total debt,
please see Allied REIT Q3 2018 MD&A “debt”.

“TOTAL RETURN”
Total return is based on $100 in units invested on February 6th, 2003 and ending on November 5, 2018, assuming the re-investment of
all cash distributions of the trust on the day of the distribution.
ALLIED PROPERTIES REIT
134 PETER STREET, SUITE 1700   TORONTO, ONTARIO   M5V 2H2   T 416.977.9002   F 416.306.8704   alliedreit.com
You can also read