Decarbonising Transport in Northern Ireland - The Northern ...
←
→
Page content transcription
If your browser does not render page correctly, please read the page content below
Research and Information Service
                           Research Paper

                                                      7 October 2020

                                                      Des McKibbin

            Decarbonising Transport in
                Northern Ireland
                                                         NIAR 289-20

   This paper provides an overview of potential policies for decarbonising road and rail
    transport in Northern Ireland in support of UK wide commitments to reach net zero
       Green House Gas (GHG) emissions by 2050. It has been prepared for the NI
    Assembly Infrastructure Committee to inform their discussion on potential areas of
                                          inquiry.

      Paper 57/20                                                                                            7 October 2020

   Research and Information Service briefings are compiled for the benefit of MLAs and their support staff. Authors are available to
discuss the contents of these papers with Members and their staff but cannot advise members of the general public. We do, however,
       welcome written evidence that relate to our papers and these should be sent to the Research and Information Service,
       Northern Ireland Assembly, Room 139, Parliament Buildings, Belfast BT4 3XX or e-mailed to RLS@niassembly.gov.uk
NIAR 289-20 Research Paper
Executive Summary
Policy Framework
Tackling climate change requires an international effort and as such both the UK and
the EU are parties to the United Nations Framework Convention on Climate Change
(UNFCCC).
Both the UK and EU have signed up to international climate change obligations, such
as the Kyoto Protocol and the Paris Agreement.
The 2015 Paris Agreement, a successor to the Kyoto Protocol, has been signed by 194
states and the European Union
The UK has ratified the Paris Agreement separately from the EU and has committed to
upholding its Paris Agreement obligations post Brexit.
The Climate Change Act 2008 (2008 Act) originally established long term statutory
targets for the UK to achieve an 80% reduction in GHG by 2050 against a 1990
baseline. In 2019, the UK Government amended the 2008 Act by introducing a target
for at least a 100% reduction of GHG emissions (compared to 1990 levels) in the UK
by 2050. The 2019 amendment order applies to the whole of the UK.
Transport has become the largest contributor to UK domestic GHG emissions,
contributing 28% of UK domestic emissions in 2018. Within transport, road transport is
the largest emitter of GHG with cars the largest contributor in this subsector.
The UK Government is developing a transport decarbonisation plan (TDP) that will
seek to deliver net zero emissions across all transport modes by 2050.
Already the UK Government has published ‘Road to Zero’, a strategy aimed at
“effectively zero emissions from road transport by 2040”. It is based around the
decarbonisation of road vehicles, eventually ensuring almost every car and van is zero
emission by 2050. Again the objectives of this policy apply across the UK.
Northern Ireland must contribute to UK commitments around emissions and
decarbonising the road transport sector. To do this, the Committee for Climate change
recommends policy focuses on:
encourage shifts to active travel and public transport.
addressing the financial and non-financial barriers to electric car uptake.
Northern Ireland Assembly, Research and Information Service 1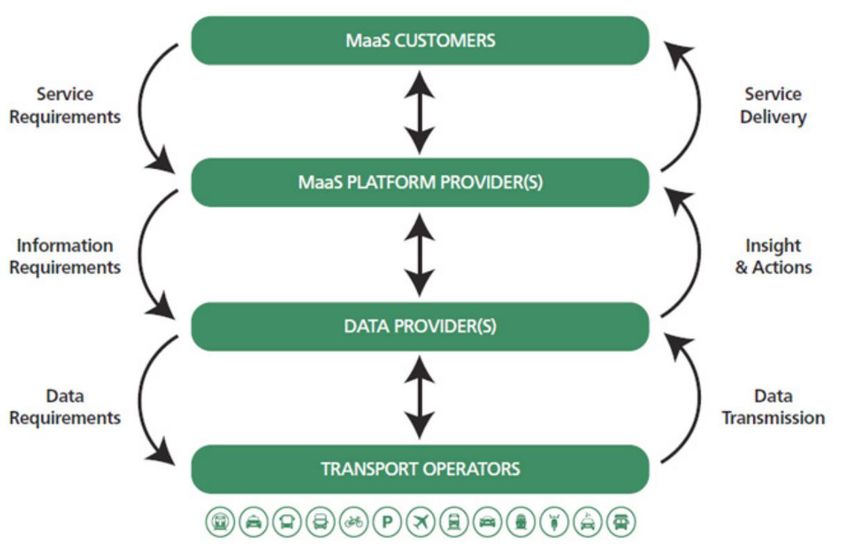
NIAR 289-20                                                                        Research Paper

      Policies to promote ultra-low emission vehicles

      The Committee on Climate Change (CCC)’s net zero technical report notes that, in
      order to achieve the net zero target, sales of non-zero emission cars, vans and
      motorcycles are likely to need to end by 2035.

      Currently ultra-low emission vehicles (ULEVs) account for less than 1% of licensed
      vehicles in the UK.

      The CCC also suggests public concerns about charging infrastructure reliability are a
      barrier to uptake for consumers and something which the NI Executive could address.
      It estimates Northern Ireland may require between 30 to 35 public rapid chargers on
      major roads, and 800 to 950 public top-up chargers. The current network consists of
      337 public charge points of which approx. 17 are rapid chargers.

      The vast majority of HGVs will also need to be either electric or hydrogen powered by
      2050 in order to reach net zero. However, there are significant challenges around
      developing zero-emissions vehicles and development of fuelling infrastructure that
      must be addressed.

      Translink has developed a strategy that aims to deliver a zero emission bus and rail
      fleet by 2040. Translink is currently piloting a small fleet of Fuel Cell Electric Vehicles,
      with funding from the DfI and the Office of Low Emission Vehicles (OLEV). Current
      Hydrogen gas costs and the capital investment in terms of vehicles and infrastructure is
      a barrier to roll out.

      Translink has indicated that to upscale the use of electricity and hydrogen as a bus fuel
      an average annual requirement of 120 vehicles per annum is required. This will require
      circa £41.6m between over the next ten years. The rail fleet programme will require
      over £40m per annum.

      Travel behaviour in Northern Ireland

      Northern Ireland is highly car dependent with over 70% of all journeys made by car. In
      general, public transport and walking/cycling have higher modal shares in larger urban
      areas, and as settlement size reduces so too does their modal share.

      Over one third of the NI population live in rural areas, often returning to urban areas
      daily for work. This is apparent with the high levels of peak period congestion in and
      around Belfast and some of the larger towns and cities in NI.

      Travel behaviour has not changed significantly in NI over the past 20 years. Public
      transport journeys have risen slightly. However, this was in line with population growth
      and no modal shift had occurred. Investment in rail services, Belfast’s metro, and rapid
      transit have been successful in increasing passenger numbers but Ulsterbus, which is
      responsible for carrying the highest number of passengers, had seen journey numbers
      fall.

Northern Ireland Assembly, Research and Information Service                                     2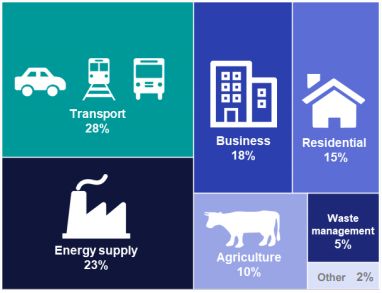
NIAR 289-20                                                                      Research Paper

      The COVID-19 pandemic had an immediate impact on demand for public transport and
      reduced travel and transport demand in general. Northern Ireland’s lockdown began at
      the end of March by which time public transport patronage had fallen to around 10% of
      2019 levels. By mid-August they had returned to less than 50% of the previous year’s
      levels.

      Policies to achieve modal shift

      The absolute minimum requirement of both public transport systems and active travel
      interventions is that they provide comfort, accessibility and safety. With this in place
      policies can be developed that can encourage modal shift. This paper looks at three
      approaches described broadly as push, pull and nudge measures. Case study
      evidence is used to demonstrate that an integration of these three approaches is often
      necessary to achieve long term and sustainable modal shift.

Northern Ireland Assembly, Research and Information Service                                      3
NIAR 289-20 Research Paper Northern Ireland Assembly, Research and Information Service 5
NIAR 289-20                                                                                                        Research Paper

Contents

1          Policy Framework ................................................................................................. 9

1.1        The Paris Agreement.............................................................................................. 9
1.2        UK legislation ......................................................................................................... 9

           1.2.1 Net zero ....................................................................................................... 10
1.3        Transport decarbonisation plan ............................................................................ 10
1.4        Road to zero ......................................................................................................... 11
2          Travel behavior in Northern Ireland .................................................................. 13

2.1        Car dependence ................................................................................................... 13
2.2        Rurality ................................................................................................................. 14

           3.2.1 Travel to work .............................................................................................. 14
2.3        Public Transport use............................................................................................. 16
           3.3.1 Impact of COVID-19 on travel behaviour ..................................................... 17
3          Policies to promote ultra-low emission vehicles. ............................................ 18
3.1        Freight sector ....................................................................................................... 19
3.2        Decarbonising public transport ............................................................................. 20
4          Policies to achieve modal shift.......................................................................... 21
4.1        ‘Push’ Interventions .............................................................................................. 22
           4.1.1 Road user charging ..................................................................................... 22
           Case study 1: London Congestion Charge (LCC) ................................................. 23
           Case study 2: Workplace parking levy .................................................................. 27
4.2        ‘Pull’ Interventions ................................................................................................ 28
           5.2.1 Sustainable Travel Towns............................................................................ 29
           5.2.2 Local Sustainable Transport Fund ............................................................... 29
           Case Study 3: Nottingham .................................................................................... 31
           5.2.3 Mobility as a Service (MaaS) ....................................................................... 36
           Case study 4: MaaS in Greater Manchester ......................................................... 38
           5.2.4 Tax incentives.............................................................................................. 45

           Case study 7: Qualified Transportation Plan (USA) .............................................. 45
           5.2.5 Workplace travel schemes ........................................................................... 47

Northern Ireland Assembly, Research and Information Service                                                                           7
NIAR 289-20 Research Paper
4.3 ‘Nudge’ interventions ............................................................................................ 48
5.3.1 Behavioural Insights in Policy ...................................................................... 48
5.3.2 Designing transport specific nudges ............................................................ 52
Northern Ireland Assembly, Research and Information Service 8NIAR 289-20 Research Paper
1 Policy Framework
Tackling climate change requires an international effort and as such both the UK and
the EU are parties to the United Nations Framework Convention on Climate Change
(UNFCCC). Both the UK and EU have signed up to international climate change
obligations, such as the Kyoto Protocol and the Paris Agreement. During the (Brexit)
transition period, the UK must continue applying and implementing EU law that falls
within the scope of the Withdrawal Agreement.1 However, the level of the UK’s
involvement, future cooperation and alignment with EU climate change efforts remains
subject to ongoing negotiation.2
1.1 The Paris Agreement
The 2015 Paris Agreement, a successor to the Kyoto Protocol, has been signed by 194
states and the European Union. The UK has ratified the Paris Agreement separately
from the EU.3 The Agreement aims to respond to the global climate change threat by
keeping a global temperature rise this century well below 2 degrees Celsius above pre-
industrial levels and to pursue efforts to limit the temperature increase even further to
1.5 degrees Celsius.4
The UK Government has confirmed it remains committed to the Paris Agreement and
that (post Brexit) it will continue to be bound by the Paris Agreement as an individual
party under international law. The Government’s post-Brexit guidance states:
“The UK will also remain a Party to international climate change
agreements, including the Paris Agreement. Its commitment to them will
remain as strong as ever and will be unaffected by leaving the EU.”5
1.2 UK legislation
The UK has domestic legislation and policies in place to reduce greenhouse gas
(GHG) emissions. The Climate Change Act 2008 (2008 Act) originally established long
term statutory targets for the UK to achieve an 80% reduction in GHG by 2050 against
a 1990 baseline (translated into five-yearly carbon budgets). Northern Ireland does not
currently have any separate climate change legislation, but GHG from Northern Ireland
contribute to the UK total under the 2008 Act, and it has a key role to play in meeting
the UK’s obligations under the Paris Agreement.6
1
Suzanna Hinson and Sara Priestley, Brexit: Energy and Climate Change, House of Commons Library, June 2020
2
Ibid.
3
UK Government, UK ratifies the Paris Agreement, 18 November 2016, accessed 30 September 2020
4
UNFCCC, The Paris Agreement, accessed 27 September 2019
5
Department for Business, Energy & Industrial Strategy, Meeting climate change requirements from 1 January 2021,
September 2020
6
Committee on Climate Change, Reducing emissions in Northern Ireland, February 2019
Northern Ireland Assembly, Research and Information Service 9NIAR 289-20 Research Paper
1.2.1 Net zero
In 2019, the UK Government amended the 2008 Act by introducing a target for at least
a 100% reduction of GHG emissions (compared to 1990 levels) in the UK by 2050.7
This is otherwise known as ‘net zero’ emissions. The 2019 amendment order applies to
the whole of the UK. However, Scotland (net zero by 2045) and Wales (95% emissions
reduction by 2050) have their own targets which reflect local circumstances. Northern
Ireland does not currently have its own long-term target for emissions but is included
within UK targets.8
It is known as a net zero target because some emissions can remain if they are offset
(i.e. by removal from the atmosphere and/or by trading in carbon units). If met, this
target would effectively mean the UK would end its contribution to global emissions by
2050.9
1.3 Transport decarbonisation plan
The UK Government is developing a transport decarbonisation plan (TDP). The
ultimate aim of the plan will be to achieve net zero emissions across all transport
modes by 2050.10 The TDP will be based on six strategic priorities to deliver net zero
emissions:
Accelerating modal shift to public and active transport;
Decarbonisation of road vehicles;
Decarbonising how we get our goods;
Place based solutions;
Establish UK as a hub for green technology and innovation; and
Reducing carbon in a local economy.11
The TDP consultation document notes that transport has become the largest
contributor to UK domestic GHG emissions, contributing 28% of UK domestic
emissions in 2018. Transport emissions are 4% higher than in 2013 and are only 3%
lower than in 1990.12 Transport emissions include freight and passenger transport, both
for private and business purposes.
7
The Climate Change Act 2008 (2050 Target Amendment) Order 2019
8
Committee on Climate Change, Net Zero – The UK’s contribution to stopping global May 2019warming,
9
Sara Priestley, Net zero in the UK, House of Commons Library, December 2019
10
Department for Transport, Decarbonising transport: setting the challenge, March 2020
11
Ibid.
12
Department for Business, Energy & Industrial Strategy, 2018 UK greenhouse gas emissions: final figures – statistical release,
May 2020.
Northern Ireland Assembly, Research and Information Service 10NIAR 289-20 Research Paper
Figure 1: Contribution (%) to UK greenhouse gas emissions in 2018, by sector
Source: DfBEIS
Since 2005 national transport emissions have decreased, even though there has been
an increase in both the number of passenger vehicles and the vehicle kilometres
travelled. This is due to lower petrol consumption by passenger cars outweighing an
increase in diesel consumption, and improvements in fuel efficiency of both petrol and
diesel cars.13
1.4 Road to zero
Within transport, road transport is the largest emitter of GHG with cars the largest
contributor in this subsector. The UK Government’s ‘Road to Zero’ Strategy set out
long-term measures to reach “effectively zero emissions from road transport by 2040”,
based around the use of carbon free fuels. The Government intends to:
See at least 50%, and as many as 70%, of new car sales and up to 40% of new van
sales being ultra-low emission by 2030;
End the sale of new conventional petrol and diesel cars and vans by 2040;
Ensure that by 2040 that the majority of new cars and vans sold to be 100% zero
emission and all new cars and vans to have significant zero emission capability; and
By 2050 ensure almost every car and van to be zero emission. 14
13
Department for Business, Energy & Industrial Strategy, 2005 to 2018 UK local and regional CO2 emissions: statistical
release, June 2020
14
Office for low emission vehicles, The Road to Zero, July 2018
Northern Ireland Assembly, Research and Information Service 11NIAR 289-20 Research Paper
Source: Department for Business, Energy & Industrial Strategy
1.5 Policy recommendations for Northern Ireland
The CCC points out that the UK Government has a central role in setting vehicle
standards, subsidising biofuels and setting road and fuel tax rates which will be key
policy levers towards decarbonised transport sector. The CCC suggests policy in
Northern Ireland can have a significant impact on demand reduction policies and
encouraging the uptake of electric vehicles through policies that address the financial
and non-financial barriers. Reducing demand for road based trips will require policies
that encourage behaviour shifts to active travel and public transport. 15
15
Committee on Climate Change, Reducing emissions in Northern Ireland, February 2019
Northern Ireland Assembly, Research and Information Service 12NIAR 289-20 Research Paper
2 Travel behaviour in Northern Ireland
2.1 Car dependence
Northern Ireland has a highly car dependent society. Over 70% of all journeys in NI are
by car whereas only 26% of all journeys which are made by walking, cycling or public
transport. 87% of journeys of one mile or over are made in a car.16
Figure 4: Number of journeys made by car and as a percentage of total journeys
800 100
Percentage (%) of journeys by private
Number of journeys by private vehicle
90
700
72 74 76 77 76 75 75
80
600 73
70
500 60
vehicle
50
400 700 690 681 691 689 678 671 658 40
300 30
20
200
10
100 0
2000-2002 2005-2007 2009-2011 2010-2012 2012-2014 2013-2015 2014-2016 2015-17
Number of journeys Percentage of journeys
Source: Department for Infrastructure: TSNI Headline Report 2015-17 and TSNI in-depth report 2010-12
Northern Ireland’s car dependence is reflected in the high levels of car ownership and
licensed drivers:
There are almost one million licensed cars in NI (944,000);17
This equates to 6478 licensed cars per 10,000 of the eligible population (17+)18.
This is a higher rate than in Scotland, England and Wales (figure 5);
81% of households have access to at least one car (a rise from 74% in 2004-06);
81% of men (17%) and 71% of women (17+) had a full car driving licence in 2016;
42% of 17-20 year olds had a full car driving licence in 2016 (up from 27% in 2004-
06);19
16
ibid.
17
Department for Transport, Table VEH0105, accessed 17 November 2018.
18
calculated using: NISRA, 2017 Mid-Year Population Estimates for Northern Ireland, population by sex and single year of age
(1991-2017), accessed 12 December 2018
Excel (1.1 MB)
19
Department for Infrastructure, Travel Survey for Northern Ireland in-depth report 2014 – 2016, table 1.2: Basic Travel
Statistics, November 2017.
Northern Ireland Assembly, Research and Information Service 13NIAR 289-20 Research Paper
Figure 5: Licensed cars per 10,000 population Scotland, England, Wales and Northern Ireland
7000 6475.9
5988.6 6090.4
Licenses per 10,000 population
6000 5530.4
5000
4000
3000
2000
1000
Scotland England Wales Northern Ireland
Source: ONS, MYE2: Population estimates: Persons by single year of age and sex for local authorities in the UK, mid-2017
and DfT, Vehicle Licensing Statistics: Table VEH0105
2.2 Rurality
In general, public transport and walking/cycling have higher modal shares in larger
urban areas, and as settlement size reduces so too does their modal share.20
Therefore, one reason for the reliance on private transport in NI is the large and
growing rural population:
Over one third of the population (36%) live in rural areas.21
The rural population is growing at a faster rate than the urban population, increasing
by 18% between 2001 and 2017, compared to a 6% growth in urban areas.22
Within this time there has been an above average population increase in rural areas
located within an hour from Belfast suggesting many commute there for work.23
Counter-urbanisation, where people move from towns and cities to more rural areas,
has been identified as a significant and cross-cutting policy issue in NI.24 In terms of
transport, it is arguably most apparent in the high levels of peak period congestion in
and around Belfast and some of the larger towns and cities in NI as people travel in out
to work.
2.2.1 Travel to work
For those who work, getting to and from there generates the highest number of trips
per year:
Those who work make on average 298 commuting journeys per year;
20
S Cooke and R Behrens, Correlation or cause? The limitations of population density as an indicator for public transport
viability in the context of a rapidly growing developing city, Transportation Research Procedia, World conference on transport
Research, 10-15 July 216
21
Northern Ireland Statistics and Research Agency (NISRA), Settlement 2015 Documentation, accessed 25 October 2018.
22
NISRA, Mid-year estimates - population change, January 2019
23
ibid.
24
DRD (2010) RDS 10 Year Review (Consultation) Page 15 (para 2.5)
Northern Ireland Assembly, Research and Information Service 14NIAR 289-20 Research Paper
this accounts for 16% of all journeys and 22% of the total distance travelled.25
A large proportion of these journeys are over distances which would make it difficult to
walk and cycle in large numbers while restricted access to public transport, particularly
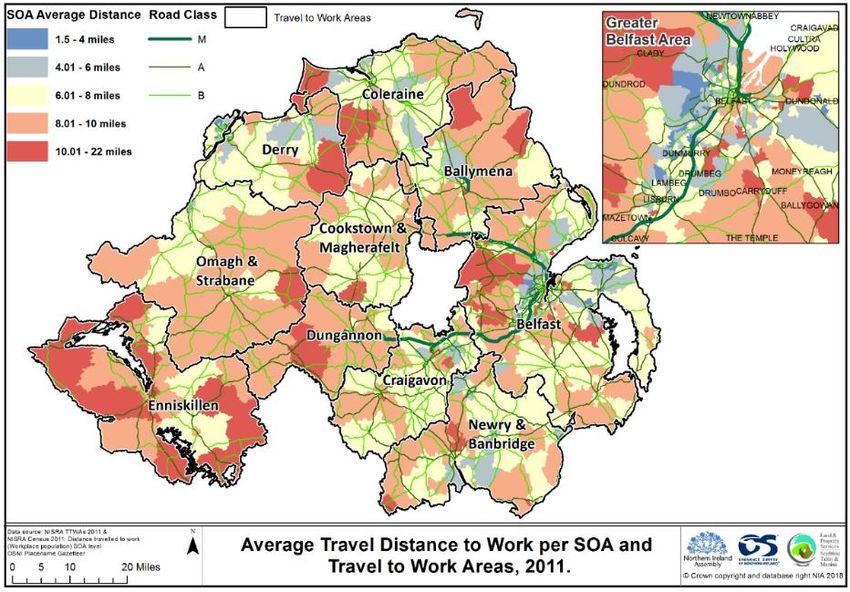
in the more rural west, may explain high levels of car dependence. Map one shows the
average travel distance to work (TDTW) and travel to work areas (TTWAs) for major
settlements in NI.26
Map 1: Average Travel Distance to Work and Travel to Work Areas, 2011
This shows large pockets of the working population, particulalrly in the West and North
were travelling more than eight miles to work. Indeed, across NI, it is only in larger
urban settlements where average travel to work disatnces are less than six miles.
Census data also tells us that even within more urban areas and/or among those who
live closer to work, there are also high levels of car use. For example:
40% of NI’s working population live within 5km of work - 70% drive, 23% walk or
cycle while 7% use public transport.
Of those who travel less than 2km 59% drive, 38% walk or cycle and 3% use public
transport.27
25
Department for Infrastructure, Travel Survey for Northern Ireland: Report 2015-17, July 2018
26
Northern Ireland Statistics and Research Agency (NISRA), Travel to work areas, accessed 25 October 2018.
27
Table DC7701NI: method of travel to work by distance travelled to work
Northern Ireland Assembly, Research and Information Service 15NIAR 289-20 Research Paper
2.3 Public Transport use
Increasing public transport use and active travel have been long term policy objectives
since the publication of the first Regional Transportation Strategy (RTS) in 2002. The
effectiveness of the approach taken to achieve this objective was examined by the NI
Audit Office in 201528 The NIAO review included analysis of performance, in terms of
realising targets for modal shift and increased passenger numbers.
The report noted that while overall public transport journeys had risen slightly, this was
in line with population growth and no modal shift had occurred (see figure 6). It noted
that significant investment in rail services and Belfast metro had been successful in
increasing passenger numbers but that Ulsterbus, which is responsible for carrying the
highest number of passengers, had seen journey numbers fall.
Figure 6: Ulsterbus/Metro/NIR passenger journeys and PT journeys per capita: 2001-02 to 2018-19
Ulsterbus/Metro/NI Rail passenger journeys and Public Transport Journeys per capita: 2001-02 to 2018-19
Source: Department for Infrastructure
This is reflected in modal share statistics from the Travel Survey. This shows that the
proportion of journeys made in private vehicles in 2017 (74%) is at the same level as in
2007.29
Figure 7: Journeys per person per year NI by main mode
100
Share of journeys per year
80
60
40
(%)
20
0
2005-2007 2010-2012 2014-2016 2015-2017
Private vehicle Walk/Cycle Public Transport
Source: Department for Infrastructure
The report concluded that commuters were now less likely to use public transport to get
to and from work than a decade ago, causing increasing peak time congestion on
Belfast’s arterial routes. The report indicated that a re-balancing of funding between
28
NI Audit Office, DRD: the effectiveness of public transport in Northern Ireland, April 2015.
29
DfI, Travel Survey NI 2016-2018 in-depth report, February 2020
Northern Ireland Assembly, Research and Information Service 16NIAR 289-20 Research Paper
roads and public transport was needed in order to achieve modal shift targets in what is
a car dependent society.
In response to the NIAO report the NI Assembly’s Public Accounts Committee
suggested that while more innovation was required in the planning and delivery of
public transport services the vision and leadership to integrate this with interventions
designed to restrict private transport is also necessary.30
Where there has been investment in public transport there have been notable
increases in patronage. For example:
Translink has seen patronage increase by over 75% on the routes now operated
under the Glider brand on the Belfast Rapid Transit System.
It is estimated that on the Glider bus corridors a modal shift of between 8% has
occurred from the private car since 2018.
NI Railways new trains were introduced in 2003/04 and 2012/13. Since then rail
patronage has increased by 232%. 31
2.3.1 Impact of COVID-19 on travel behaviour
The COVID-19 pandemic had an immediate impact on demand for public transport and
reduced travel and transport demand generally. Immediately after Northern Ireland’s
lockdown began at the end of March public transport patronage had fallen to around
10% of 2019 levels. This began to recover as lockdown measures eased. However,
there remains uncertainty when or if this will return to previous levels.
Figure eight shows, patronage remained just below 50% (46%) on both NIR and Met,
as of August 16. Ulsterbus, which carries the largest proportion of passengers, has
seen its numbers recover to 33% of 2019 levels.
Figure 8: Patronage (%) NIR, Metro and Ulsterbus 1 Mar – 16 Aug, as compared to 2019
100
80
60
46
40
20 33
0
NIR Metro Ulsterbus
30
Public Account Committee, Report on DRD: The Effectiveness of Public Transport in Northern Ireland, June 2015.
31
Translink, Energy Strategy Call for Evidence CfE0055, June 2020
Northern Ireland Assembly, Research and Information Service 17NIAR 289-20 Research Paper
Source: Department for Infrastructure
The NI Executive continue to advise people to work from home where possible, while
the BBC report only 5% of office-based staff in Belfast have returned to their
workplaces full time.32 Indeed, the lockdown has been described as the ‘world’s mass
homeworking experiment’33 with organisations being having to adapt quickly to remote
working.34
It could be argued that much of this drop off is temporary as people continue to work
from home only until restrictions are lifted. However, academics have suggested there
is growing evidence working practices may have altered permanently, requiring a
acknowledgement in current transport policy:
Professor Greg Marsden pointed out that the UK Government road investment plans
are based on the assumption of 1% traffic growth per year – meaning 35% by 2055.
However, he argued that post-COVID-19, an actual fall in traffic was more likely. He
said:
"The likely drop in traffic levels post the COVID-19 crisis means that we
should delay the road expansion programme and focus instead on
rebuilding public transport and switching more of our vehicles to zero
emissions."35
If remote working practices continue they will have a significant impact on the demand
for travel, given as discussed, travel to work accounts for so many of our journeys.
However, the long-term impacts of the pandemic on the demand for travel and modal
choice remain to be seen.
3 Policies to promote ultra-low emission vehicles.
Given the dependence on private transport in NI, it is apparent that switching to zero
emission vehicles will be critical if NI is to contribute to the UKs net zero commitments.
The Committee on Climate Change (CCC)’s net zero technical report notes that, in
order to achieve the net zero target, sales of non-zero emission cars, vans and
motorcycles are likely to need to end by 2035.36 As a result there have been
widespread calls for the Government to accelerate the uptake of electric vehicles (EVs
and to phase out conventional petrol and diesel engine vehicles earlier.37
Data from the Department for Transport (DfT) highlight the scale of the challenge
associated with decarbonising road transport by 2050. Out of approximately 39.4
32
John Campbell, Coronavirus: Only 5% of Belfast employees have returned to workplaces, BBC News Online, 1 September
2020
33
Andrew Hill and Emma Jacobs, ‘How is the world’s mass homeworking experiment going?’, Financial Times, 30 March 2020
34
Reuters, Zoom’s daily participants, April 2020
35
Roger Harrabin, Coronavirus will transform UK work and travel, says AA, 3 April 2020, accessed 27 September 2020
36
Committee on Climate Change, Net Zero – Technical Report, May 2019
37
Noel Dempsey and Suzanna Hinson, Electric vehicles and infrastructure, House of Commons Library, March 2020
Northern Ireland Assembly, Research and Information Service 18NIAR 289-20 Research Paper
million licensed vehicles in the UK at the end of 2018, around 0.2 million (0.5%) were
ultra-low emission vehicles (ULEVs).38 Of the approximately 1.2 million licensed
vehicles in Northern Ireland,39 just over 3,600 (table 2) were ULEVs (0.3%).
Table 1: Licensed ultra-low emission vehicles (ULEVs) at the end of 2020 Q2, by body type and region,
United Kingdom
Buses
All Goods Other
All cars HGV and Total
motorcycles vehicles vehicles
coaches
England 263,625 3,121 11,278 334 649 4581 283,588
Wales 6,108 82 379 5 1 51 6,626
Scotland 17,181 139 745 8 27 177 18,277
Northern
3,511 32 127 1 0 2 3,673
Ireland
The CCC suggests the NI Executive can support greater uptake of ULEVs by
addressing the shortage of charging infrastructure. It notes that public concerns about
charging infrastructure reliability has been identified as a barrier to uptake of EV.
Therefore, the CCC suggests:
“Northern Ireland may require between 30 to 35 public rapid chargers on
major roads, and 800 to 950 public top-up chargers. Northern Ireland has
470 charging points as of June 2018, a share of 2.8% of UK charging
points”.
3.1 Freight sector
The CCC has also indicated that the vast majority of HGVs will also need to be either
electric or hydrogen powered by 2050 in order to reach net zero. However, there are
significant challenges around developing zero-emissions vehicles and development of
fuelling infrastructure.40 According to the Chartered Institute of Logistics and Transport
(CILT):
“…at present, there are no feasible ultra-low emission or electric HGV’s on
the market that provide businesses with options based on their business
model and vehicle requirements”.41
The Freight Transport Association (FTA) points out that Northern Ireland has no public
fuelling infrastructure for CNG or Hydrogen whilst there is also limited electric charging
points meaning businesses will not invest in these technologies. The FTA suggests,
38
ONS, Road transport and air emissions, September 2019
39
DfT, Vehicle Licensing Statistics: 2019 Quarter 1 (Jan - Mar), April 2019
40
Committee on Climate Change, Net Zero – The UK’s contribution to stopping global warming, May 2019
41
CILT, Energy Strategy Call for Evidence Response CfE0031, June 2020
Northern Ireland Assembly, Research and Information Service 19NIAR 289-20 Research Paper
“significant investment in refuelling or recharging infrastructure across the
Strategic Road Network would be required. Goods vehicles including vans
travel nationwide delivering goods and services and they would need the
certainty to know that wherever they were needed, they would be able to
successfully and efficiently refuel or recharge their vehicle, with limited
down time.”
The CCC accepts that HGVs will be harder to decarbonise, but that a hydrogen/EV
based switchover is possible is possible if there is appropriate investment in
infrastructure.42
3.2 Decarbonising public transport
Translink has developed a strategy that aims to move from the current diesel
dominated public transport fleet to a zero emission fleet by 2040.43 Translink is
currently involved in a pilot scheme to introduce a small fleet of Fuel Cell Electric
Vehicles in 200. The pilot will see the Energia Group supply renewably-sourced
hydrogen fuel from an on-shore North Antrim windfarm to power three Hydrogen
fuelled double decker buses supplied by Wrightbus.44 The project, which is supported
by funding from DfI and the Office of Low Emission Vehicles (OLEV) will cost £4.7m,
including the delivery of the first ever Hydrogen refuelling station of its kind in Ireland.
According to Translink, current Hydrogen gas costs and the capital investment in terms
of vehicles and infrastructure is a barrier to roll out.45 Translink has modelled the capital
investment for upgrading the bus fleet to zero emission, estimating it would require 120
vehicles annually at a funding requirement of circa £41.6m between 2019 and 2030.46
The rail fleet programmes will require the procurement of 150 extra vehicles between
2019 and 2030 to provide the estimated capacity to keep pace with passenger growth.
This equates to an average annual funding requirement of £40.1m per annum up to
2030 for new rolling stock and traction improvements on existing rolling stock.
According to Translink’s assessment of the environmental improvements achieved by
its Fleet Strategy shows that by 2030, the proposed bus fleet would emit approximately
61% less CO2, 90% less NOx and 91% less PM, compared with the emissions from
the 2019 fleet.
Translink has pointed it out that while initial investments are high they are likely to
reduce as zero-emission technologies become more mature and the increased
demand for them give rise to economies of scale. Furthermore, it points out that while
the adoption of zero-emission technologies requires significant capital investment,
42
Committee on Climate Change, Net Zero – The UK’s contribution to stopping global warming, May 2019
43
Translink, Energy Strategy Call for Evidence CfE0055, June 2020
44
Energia Group, Energia Group to provide renewable hydrogen for NI public transport, 29 January 2020, accessed 30
September 2020
45
Translink, Energy Strategy Call for Evidence CfE0055, June 2020
46
Ibid.
Northern Ireland Assembly, Research and Information Service 20NIAR 289-20 Research Paper
these vehicles could provide a circa £5m annual saving in operational costs in terms of
fuel and maintenance (i.e. an annual saving of over 9%); and could be regarded as
“invest to save” programme.47
4 Policies to achieve modal shift
An individual’s choice of transport mode is influenced by a number of factors. Social
norms, habitual and automatic behaviour and quality of public transport infrastructure
have been identified as particularly important.48 Analysis of a range of studies by Batty
(2015) looking at what qualities attract people to public transport found that comfort,
accessibility, speed, seamlessness of journey, safety, security, affordability and
reliability are fundamentals, without which modal shift will not occur.49 Similar factors,
particularly speed, convenience and safety are also key determinants of active travel
uptake, much more so than factors such as weather, age or gender.50
Providing the type of quality infrastructure that encourage modal choice can be broadly
as ‘pull’ factors i.e. the types of qualities that might attract people to alter their travel
behaviour. They are largely delivered through investments in infrastructure and
services. In contrast there are conditions under which car usage can be made either
unattractive, difficult or impossible to undertake, with users effectively ‘pushed’ to
change behaviour. This approach often, though not always, struggles to gain public
support, and hence political support is rarely forthcoming.
It is argued that neither approach works in isolation and implementing a combination of
‘pull’ and ‘push’ policies is the most effective way to change travel behaviour.51 It is
therefore likely that significant and sustainable modal shift will require a range of
interventions.
While there is a significant body of evidence that demonstrate the benefits of push and
pull interventions, there is growing recognition that the human decision making process
is often more complex. Behavioural sciences and particularly behavioural economics
attempt to explain peoples’ behaviour. According to the theory, by examining the role of
psychological, social, and emotional factors have in the decision making process non-
intrusive interventions, referred to as ‘nudges’, can be designed to modify behaviour.
The remainder of this paper will look at a range of push, pull and nudge policies that
have been employed elsewhere to achieve modal shift.
47
ibid
48
House of Lords Science and Technology Select Committee, 2nd Report of Session 2010-12, Behaviour Change, HL Paper
179, July 2011.
49
Paul Batty, et al., Challenges and opportunities in developing urban modal shift, Travel Behaviour and Society vol. 2, 2015,
pp. 109–123
50
Danique, Ton, et al. Cycling or walking? Determinants of mode choice in the Netherlands, Transportation Research Part A:
Policy and Practice Volume 123, May 2019, Pages 7-23
51
Federal Ministry for Economic Cooperation and Development, Transportation Demand Management, April 2009
Northern Ireland Assembly, Research and Information Service 21NIAR 289-20 Research Paper
4.1 ‘Push’ Interventions
4.1.1 Road user charging
Road user charging is by no means a new concept, with records of toll roads dispersed
throughout history.52 The basic principle has been implemented in various ways under
terms including road pricing, congestion charging, road tolling and variable pricing.53
These schemes can be organised into the following categories:
Economists view the concept in terms of simple market economics; roads users, like
the users of any other valuable and limited resources, should pay all the costs arising
from their use.54 55 However, from a practical point of view, the challenge lies in how to
implement the concept, “not only in terms of developing technically efficient charging
mechanisms, but also in gaining political acceptance as a valid policy instrument”56 due
to the general perception that the public are opposed to such measures.57
Critics of road pricing point to the likelihood of certain undesired distributional effects,
for example it may disproportionally affect commuters and/or those with no alternative
but to drive and therefore pay the charge.58 However, there is evidence to suggest that
the way in which the scheme is designed is critical and if implemented correctly can
ultimately produce equitable outcomes.59
The literature suggests that a lack of public support and the unwillingness of politicians
to introduce unpopular mechanisms such as a congestion charge is the main reason
these schemes are so rare.60 However, there is evidence from cities such as
Stockholm and London that while there is often initial resistance acceptance grows out
of familiarity when the benefits begin to be realised.61 Some experiences with both
planning and introducing congestion charges are discussed here.
52
Louise Butcher, Roads: national road pricing, House of Commons Library, August 2010
53
Waafa Saleh, Road user charging: Theory and practice, Transport Policy, vol. 12(5), pp. 373-376.
54
Waafa Saleh, Road user charging: Theory and practice, Transport Policy, vol. 12(5), pp. 373-376.
55
Matthew Gibson and Maria Carnovale, The effects of road pricing on driver behaviour and air pollution, Journal of Urban
Economics, vol. 89, July 2015, pp.62–73
56
Yang, Hai and Huang, Hai-Jun, Mathematical and Economic Theory of Road Pricing, Emerald Group Publishing Limited 2005.
57
Stephen Jess and Maria Börjesson, Understanding attitudes towards congestion pricing: a latent variable
investigation with data from four cities, Transportation Letters, vol. 11 (2), pp. 63-77.
58
Benjamin Bureau an Matthieu Glachant, Distributional effects of road pricing: Assessment of nine scenarios for Paris,
Transport Research Part A: Policy and Practice, volume 42 (7), pp. 994-1007.
59
Andrew Koh, et al. Road user charging and implications for transport policy: Findings from the CURACAO project. In: General
Proceedings of the 12th World Conference on Transport Research Society. July 2010.
60
G Santos, et al. 2008. London Congestion Charging. Brook.-Whart. Pap. Urban Aff., pp. 177–234.
61
Jonas Eliasson and, Lina Jonsson (2011) The unexpected ‘‘yes’’: Explanatory factors behind the positive attitudes to
congestion charges in Stockholm, Transport Policy, vol. 18, pages 636–647
Northern Ireland Assembly, Research and Information Service 22NIAR 289-20 Research Paper
Case study 1: London Congestion Charge (LCC)
Transport for London introduced an area-based congestion charging scheme for
London in February 2003. The charge is an ‘area licence’ that allows drivers entering
the 21km2 charging zone (see below) to drive there throughout the day between 07:00
and 18:30. The charge has risen gradually from £5 in 2003 to £11.50 today, residents
from inside the zone receive a 90% discount.62
It cost around £162 million to set up the LCC scheme (2005 prices). Areas of
expenditure included traffic management methods, communications and public
information on the scheme, systems set up and management.63 Initially it was thought
that all vehicles that travel into London would have to be fitted with electronic in-vehicle
transponder units. That would have added both cost and complexity therefore a simpler
collection and enforcement mechanism, using cameras and ANPR technology was
chosen. 64 The Gross income for the LCC was around £230m in 2017/18, operating
costs totalled £74m leaving net revenues of £156m, which are hypothecated to
transport schemes in London.65
A cost benefit analysis of the LCC in 2007, reported in the Fifth Annual Impacts
Monitoring Report, suggested that the identified benefits exceeded the cost of
operating the scheme by a ratio of about 1.5 with the original £5 charge, rising to about
1.7 when the price increased to £8. This takes account of the net effects on public
accounts, for example, indirect impacts on tax revenue. The more traditional resource–
based estimates give benefit: cost ratios of around 2.0:1 and 2.5:1 with the £5 and £8
charge.66
Figure 7: London Congestion Charging Scheme in Relation to London
Central London
Congestion Charging
Scheme
North South Circular
The Greater London
boundary
The M25
Source: Defra
62
Transport for London, Residents’ discount, accessed 09 December 2018.
63
Transport for London, Central London Congestion Charging Scheme: ex-post evaluation of the quantified impacts of the
original scheme, June 2007
64
UK Air, Detailed Assessment of London Congestion Charging
65
Transport for London, Annual Report and Statement of Accounts 2017-18, July 2018.
66
Transport for London, LCC Impacts Monitoring – Fifth Annual Report, June 2007.
Northern Ireland Assembly, Research and Information Service 23NIAR 289-20 Research Paper
The LCC is considered to have been successful in relieving congestion in central
London with TfL data showing that car traffic entering the congestion charging zone
(CCZ) fell by 39 per cent between 2002 and 2014.67
There are other notable benefits from the LCC:
It has enabled capacity previously allocated to private motor vehicles to be
reallocated largely to bus lanes and pedestrian routes making these (bus and
walking) more attractive;
There has been a road safety impact with fewer car trips resulting in fewer injuries;
50-60% of the displaced car trips transferred to public transport, 20-30% divert
around the zone, and 15-25% have made other adaptations, such as changing the
timing of trips;68
The LCC represents around five per cent of TfL’s income;
Over £1.7 billion has been raised in total from the scheme since 2003/04.
The revenue raised is spent on improving transport in line with the Mayor’s
Transport Strategy.69
Future of London Congestion Charge
Traffic levels in the CCZ have fallen since its introduction. Despite this, congestion
levels have returned to similar levels seen before the scheme. This is due to a
redistribution of road space in Central London, with more space allocated for walking,
cycling and bus priority. TfL has stated that without the Charge, congestion in central
London would be significantly worse.70
The London Assembly (LA), while acknowledging the success of the LCC, has
described it as a ‘blunt instrument [..] too narrow in scope’.71 It suggests London needs
a way of charging people for road usage that is better targeted at the places congestion
occurs, at the times it occurs, recommending reform of the LCC so it no longer requires
drivers to pay one daily flat rate.72 The LA further recommends that the Mayor develops
proposals for a ‘wider, single and simple’ road pricing scheme for London that charges
drivers according to how much, when and where they drive.73 It suggests that many
drivers that have a relatively low impact on congestion may pay less than they do
67
London Assembly, Written evidence submitted to the House of Commons Transport Select Committee Urban congestion
inquiry, February 2017.
68
UK Air, Detailed Assessment of London Congestion Charging
69
London Assembly, Written evidence submitted to the House of Commons Transport Select Committee Urban congestion
inquiry, February 2017.
70
Transport for London, Written evidence submitted to the House of Commons Transport Select Committee Urban Congestion
inquiry, January 2017
71
London Assembly, Written evidence submitted to the House of Commons Transport Select Committee Urban congestion
inquiry, February 2017
72
ibid.
73
ibid.
Northern Ireland Assembly, Research and Information Service 24NIAR 289-20 Research Paper
today, while others contributing most to congestion would be disincentivised from doing
so.74
The Mayor of London’s 2018 Transport Strategy notes that in order to meet targets for
80 per cent of travel in London to be either walking, cycling or public transport, the way
road users pay for roads must change. The strategy suggests that while the LCC
approach was effective in its time, technological developments could facilitate a new
approach where road charges take better account of the impacts and context of
individual journeys”.75 The Mayor suggests a ‘per mile’ charge which takes into account
distance, time, congestion, emissions and road danger in an integrated way will be
developed by TfL.76
Key success factors
Combing pull measures, in the form of improved bus services and active travel
infrastructure, was critical to acceptance of the LCC push measure. London’s ‘BusPlus'
policy, also known as the London Bus Initiative, was introduced at the same time. In
addition to increased capacity, BusPlus delivered improvements in reliability, service
quality, journey times, accessibility and information along key routes in and around
central London. Providing this suitable alternative saw the number of passengers
entering the central charging zone by bus increased by 37 per cent by 2007. TfL
estimates up to half this growth reflected displaced car travellers with the remainder
reflecting wider improvements to bus services.77
Figure 8: Passenger journeys on local bus services by region in GB 1990/91 to
3,000 2016/17
Passenger journeys
2,000
1,000
0
1990/91
1991/92
1992/93
1994/95
1995/96
1996/97
1997/98
1999/00
2000/01
2001/02
2002/03
2003/04
2004/05
2005/06
2006/07
2007/08
2008/09
2009/10
2010/11
2011/12
2012/13
2013/14
2014/15
2015/16
2016/17
1993/94
1998/99
London English metropolitan areas
Transferability
The evidence has shown that congestion charging is an effective means of reducing
congestion in certain urban centres. However, it is a policy that is not universally
acceptable and its success as a driver of modal shift appears to be highly dependent
74
ibid.
75
Mayor of London, Mayor’s Transport Strategy, March 2018
76
Mayor of London, Mayor’s Transport Strategy, March 2018
77
Transport for London, LCC Impacts Monitoring – Fifth Annual Report, June 2007.
Northern Ireland Assembly, Research and Information Service 25NIAR 289-20 Research Paper
on the existence of a highly functional public transport system that offers an alternative
to car use.
Congestion in many towns and cities, including Belfast, is largely restricted to a small
number of peak hours each day and a limited number of roads. Even though some of
these roads experience severe congestion, the question would remain as to whether it
is bad enough to introduce such an extreme and potentially contentious measure.
A House of Commons Transport Select Committee has previously questioned the cost-
effectiveness of local congestion charging schemes, in cities other than London. It
suggested the local authority has to be confident that it will capture sufficient revenue
to cover both the costs of the scheme's infrastructure, administration and enforcement,
and to pay for the improved public transport services that would ensure the urban
areas remained easily accessible. The committee noted that part of the risk associated
with local charging schemes is whether an individual city would be able to withstand
the economic impact of trade diverting to other neighbouring cities that did not have a
congestion charge, and with out-of-town shopping centres and business parks, which
already provide strong competition.
4.1.2 Car parking charges
Copenhagen plans to reach zero carbon emissions by 2025, primarily through
decarbonising and expanding the public transport fleet and providing more bike lanes.
In 2017, 85% of municipal vehicles were electric, hydrogen, or hybrid-powered. By
2020, the city plans to have 500 electric charging points and four hydrogen filling
stations.78 Copenhagen is regarded as one of the most cycle friendly cities in the
world.79
In addition to the pull of its comprehensive public transport and cycling provision
Copenhagen has employed restrictive parking measures as a central component of its
broader modal shift policy. The literature suggests that the availability and cost of car
parking can significantly influence modal choice.80
Copenhagen’s parking strategy focuses on reducing incoming commuter traffic,
increasing both the size of the charging area and the rates applied. This measure
reduced inner-city car traffic by 6% from 2007-09. A further measure to limit access to
parking for commuters, introduced in 2009, was to assign much of the inner city car
parking capacity to residents and local businesses via a permit scheme.81 While there
is still some parking available to visitors/commuters the cost has proven to be a
deterrent. The City of Copenhagen reported that its policy led to:
78
Deloitte, City Mobility Index, March 2019
79
ibid
80
Hakim Hammadou and Claire Papaix, Policy packages for modal shift and CO2 reduction in Lille, France, Vol. 72, December
2018, Pages 242-247
81
City of Copenhagen, Impacts of Copenhagen’s Parking Strategy, June 2014
Northern Ireland Assembly, Research and Information Service 26NIAR 289-20 Research Paper
a 40% reduction in private vehicles parking during the morning rush hours;
a fall in the proportion commuting by car from 22% to 16%;
the proportion commuting by train rising from 24% to 33%; and
the proportion using bus and bicycle or walking remaining largely static. 82
Numerous empirical studies have shown that the cost of parking significantly affects
individuals’ travel choices. In a study of UK employers that had implemented workplace
travel plans, Cairns et al. (2010) found that organisations which had constrained
workplace parking or increased its cost reduced the modal share of driving to work by
an average of 25 percent. This was more than double the reduction achieved by
organisations that attempted to reduce driving without changing their parking
practices.83
The availability of convenient, guaranteed or free parking is a major factor influencing
people’s decision to drive to work. In Northern Ireland 91% of rural commuters and
75% of urban commuters drive, while 80% of this total do so alone in a single
occupancy vehicle. This places a huge strain on road capacity during peak travelling
times and is a major cause of congestion and emissions.
Case study 2: Workplace parking levy
Under the Transport Act 2000 local traffic authorities in England and Wales, outside
London, were given powers to introduce a Workplace Parking Levy (WPL).84 This
policy is intended to provide local authorities with a means to manage transport
demand whilst also providing hypothecated funding for transport investment.85 To date,
Nottingham is the only local authority area to have sought and obtained approval for a
scheme, which began 1 April 2012.86 Some of the key characteristics of the scheme
are listed below:
The levy is an annual charge of £387 per parking place for employers with 11 or
more spaces for 2017-18.
Every workplace parking space is licensed, and employers with 10 or fewer spaces
receive a 100 per cent exemption, creating a complete database of parking spaces
in the city.
Annual increases in the charge are linked to increases in inflation.
Disabled parking spaces and ‘blue light’ services are exempt.
The levy raises £9 million a year which is used to fund improvement to public
transport in the city and costs around £500,000 a year to run.
82
ibid,
83
Cairns, et al., Understanding successful workplace travel initiatives in the UK. Transport Research Policy Practice, vol. 44 (7),
pages 473–494.
84
Louise Butcher, Roads: Workplace Parking Levy, March 2012
85
Simon Dale, et al., Evaluating the impact of a workplace parking levy on local traffic congestion: The case of Nottingham UK,
Transport Policy, vol. 59, July 2017, pages 153-164
86
Louise Butcher, Roads: Workplace Parking Levy, March 2012
Northern Ireland Assembly, Research and Information Service 27NIAR 289-20 Research Paper
All funds are ring-fenced for transport improvements, including the tram and bus
network and the redevelopment of Nottingham Rail Station.
The city has used the money to bid for other sources of match funding in investment
into the city: for every £1 raised, £3-4 of other funding is levered in. The Department
for Transport (DfT) matched £221 million of local funding that included the WPL with
£432 million for the extension of the city’s tram network
It achieves 99 per cent compliance from employers and about half of firms pass the
costs of the levy down to their employees.87
According to ‘Centre for Cities’ (CfC), public transport usage in Nottingham is among
the highest of any city in the UK.88
A similar scheme in Perth (Australia) had a significant impact on modal share.
Richardson 2010 presents figures which show that in the 10 years’ period following the
implementation of a WPL, public transport’s share of commuter trips rose from 35% to
over 50% (1999-2009), while overall public transport use grew by 67%. While this
certainly demonstrates a positive modal shift, it should be noted it took place during a
rapid expansion of Perth’s population and economy.
4.2 ‘Pull’ Interventions
In 2004, the Department for Transport published ‘Smarter Choices: Changing the Way
We Travel’, which reviewed the evidence available at that time on the effect and scale
of implementation of smarter choice measures. These were widely described as ‘soft’
transport policy measures, as opposed to ‘hard’ measures such as physical
improvements to transport infrastructure or operations. They included:
workplace travel plans;
school travel plans;
personalised travel planning;
public transport information and marketing;
travel awareness campaigns;
car clubs;
car sharing schemes;
teleworking;
teleconferencing, and
home shopping. 89
87
Naomi Clayton, et al., Nottingham Workplace Parking Levy, December 2017
88
Core Cities, accessed 20 April 2019
89
Sally Cairns, et al., Smarter Choices – Changing the Way We Travel, July 2004.
Northern Ireland Assembly, Research and Information Service 28You can also read