Ant DESIGNED BY ANT STUDIO IN INDIA - SWITCH-Asia
←
→
Page content transcription
If your browser does not render page correctly, please read the page content below
ant

DESIGNED BY ANT STUDIO IN INDIA
The Vicious Circle
                                OZONE LAYER DEPLETION

                                  GLOBAL WARMING

                  HIGH ENERGY                              RISE IN
                 CONSUMPTION                            TEMPERATURE

                                                          CLIMATE
                  EMISSIONS                               CHANGE

                 HEAT ISLAND

                                  INCREASE IN AIR
                                 COOLING DEMAND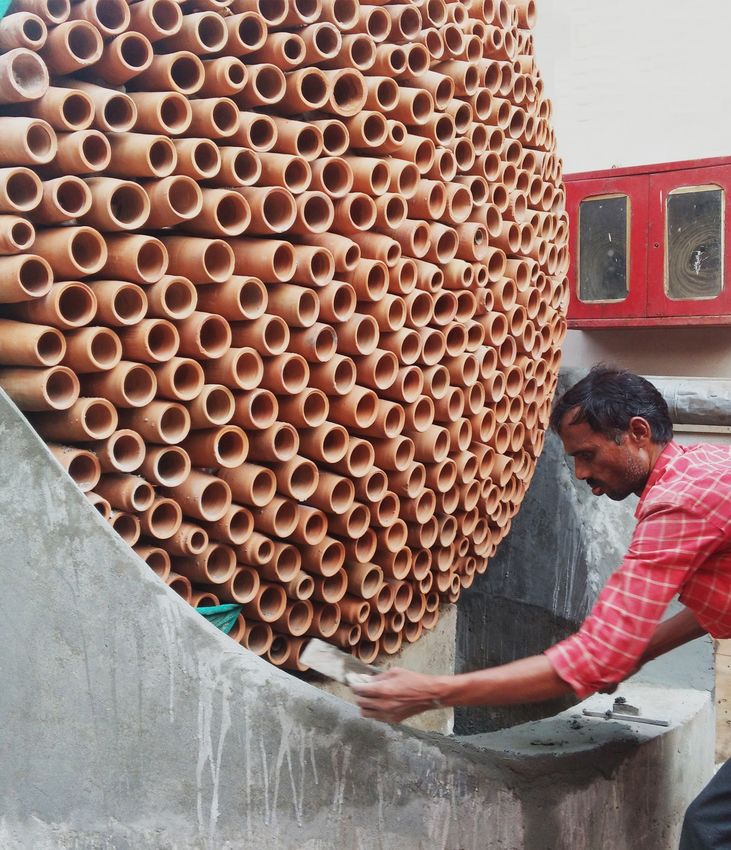
what do we do?
Cooling transends human comfort
As of 2016 data centres consume nearly
  30 billion kwh electricity in the USA

                      *https://www.datacenterknowledge.com/archives/2016/06/27/heres-how-much-
                                                              energy-all-us-data-centers-consume
Legal cannabis farming for
medicinal purposes alone consumes
power worth 3 billion USD
https://www.sciencedirect.com/science/article/pii/S0301421512002285Less is More
Environmental Effect
                                               Energy use in cooling account
                                               for “ around 10% of Global
                                               CO2 emissions already. “

Air-Cooling Systems 40%
   [Air Conditioners,

  Air Coolers & Fans]

                          Energy Consumption
                                INDIA

                               60% Other
Volume Consumption of Room Air-Conditioner
YoY %
Room Air Conditioner Volume in Millions
31% 30%
25% 23% 7.7
20% 20% 22%
6.7 15%
15% 12% 5.8
7% 5.2
3% 15%
4.0 12%
3.3 3.5
2.9 2.7 2.8
2.5
1.9 2.0 -14%
1.3 1.5 -5%
1.1
FY05 FY06 FY07 FY08 FY09 FY10F Y11 FY12 FY13 FY14 FY15 FY16 FY17 FY18 FY19 FY20
IMAGE SOURCE : MOSL Industry 2018Market Scenario
2 Bn USD
66%
“The global market is expected to
608 Mn USD reach USD 6.9 Million by 2022, at
?
8% a CAGR of 5.3% between 2016 and
3.74 Bn USD
4%
2022.”
- the gaurdian, 2018
Air Conditioners Air Coolers Fans Personal Cooler
IMAGE SOURCE : MOSL Industry 2018
Market Share of Air Cooling Systems in IndiaAir conditioning Personal Cooling
Personal Cooling
LOW ENERGY
CONSUMPTION
PERSONEL
COOLING
ZERO MICROCLIMATE
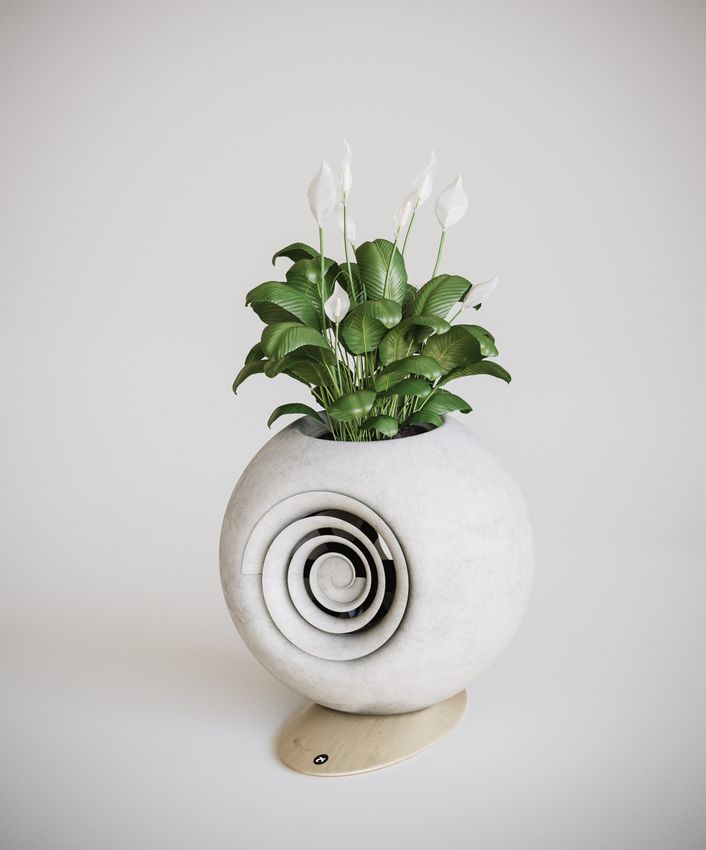
EMISSIONS CONTROLEther
Ether
Ether
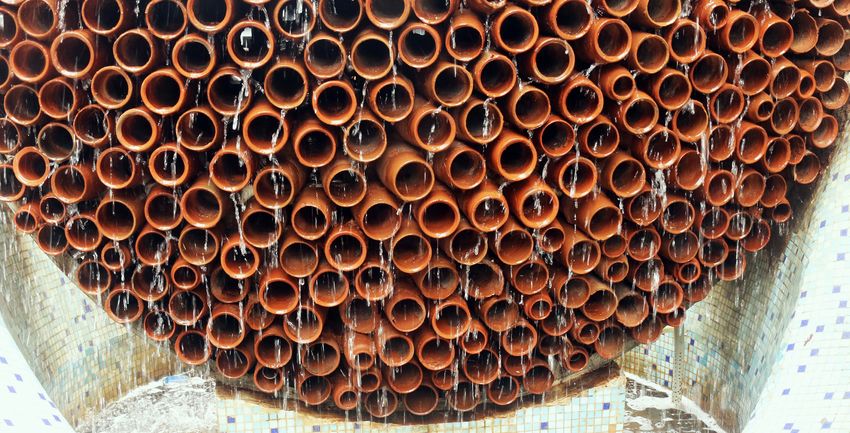
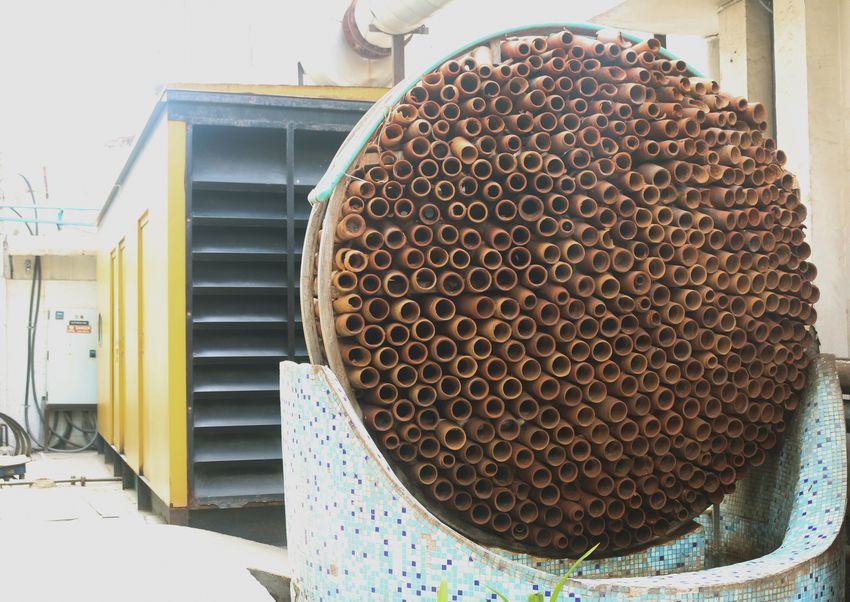
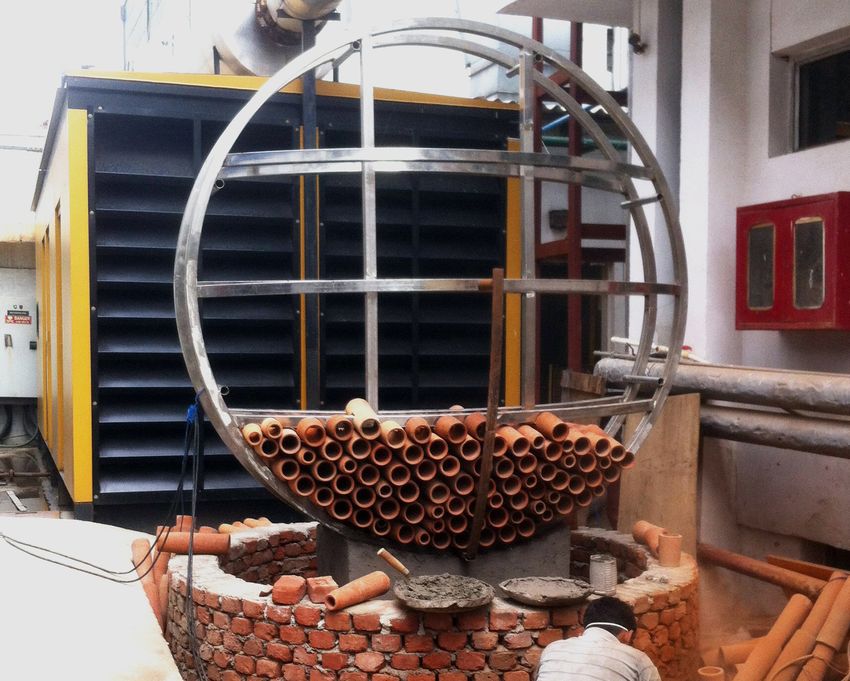
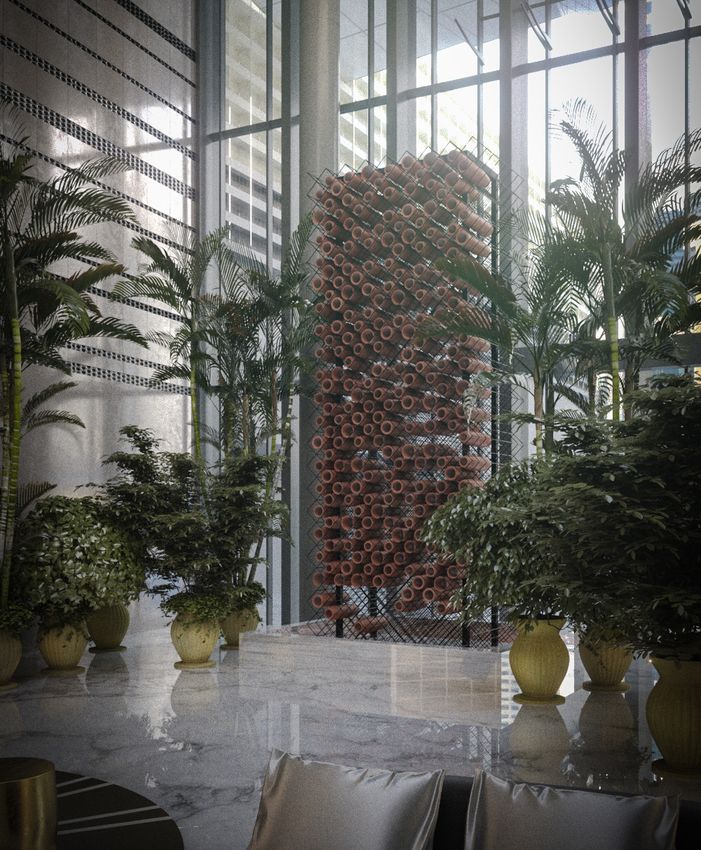
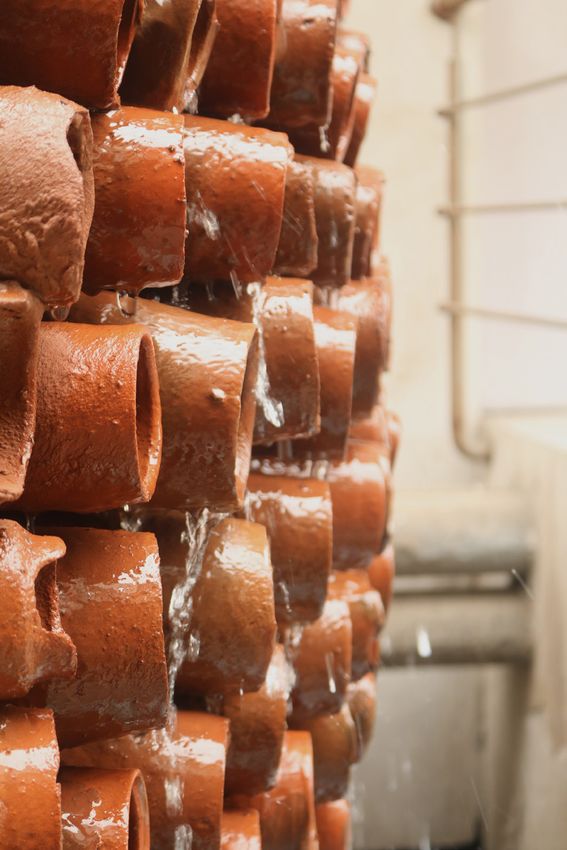
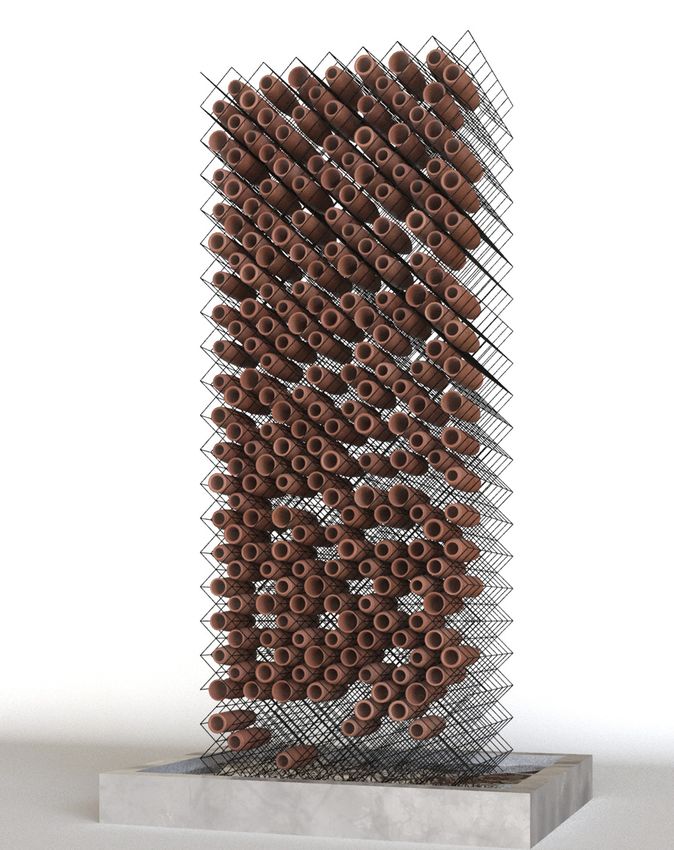
Ether

Inspired from traditional evaporative cooling.
Ether
Ether
Art ability
Cool Purified Air Efficient & Green Smart Humidification Smart Device
Why Personal Cooling

            The global personal cooling device market is expected to reach
            USD 6.9 Million by 2022 from USD 4.8 Million in 2015, at a CAGR
            of 5.3% between 2016 and 2022. The base year considered for
            the study is 2015 and the forecast period is between 2016 and
            2022.
Mentors
MR. MUKUL ROHATGI - EX ATTORNEY JOURNAL OF INDIA, LEGAL ADVISE
MR. VIJAY JAIN, EX- FIXED LINE PRESIDENT, RELIANCE JIO, BUSINESS ADVISOR
DR. DEVENDRA KUMAR - HOD, CERAMICS ENGINEERING DEPARTMENT IIT BHU, DOMAIN EXPERT
DR. SUNITA SHREEDARAN - SKS LAW ASSOCIATES, INTELLECTUAL PROPERTY
MR. VINOD SHARMA - DIRECTOR, DEKI ELECTRONICS PVT LTD, BUSINESS ADVISORTeam
Aishwarya Kaura is a keen observer and loves exploring with various materials with earth/nature topping
the list. As a creative practitioner she aspires to create spaces that are practical, sustainable solutions to
urban requirements by enhancing one’s experience.
Alexandre Pineau is a young designer who is currently working on the frugal aspect of technology, system
design and lifecycle assessment of the product Coolant. He proaches design to investigate ways to reduce
carbon footprint and bridge the ecological imbalance that exists.
Anu Thakur is a senior architect and uses a creative approach to solve the problem and is energetic and
eager to learn new skills. She has an experience in working as a part of a team as well as individually.
Bhavya Bhatt is a fourth year law student, an ardent writer who is currently exploring avenues in Content
Writing and law. She aims for a full-fledged career in Public International Law specialized in Space law and
Aviation.She is currently working on Intellectual Property Rights research with regard to the coolant.Dhirendra Singh has done his Masters in management and has around 10 years exposure in strategic consulting for global MNC in infrastructure planning and PPP transaction advisory of mega projects. He is supporting CoolAnt in Strategic planning and Business planning. Mukul Singh is a mechanical and an automation engineer with a passion for Race machines. He is a critical thinker and lets his work speak for himself. He is working on Research, Experimentation, Design Evaluation for the CoolAnt. Sagar Ashok and Sudhanshu kumar With an experience of nearly 35 years, Mr Sagar is head of the op- erations. They are a part of resources, implementation and operations for the Coolant, executing on field, installing the beehives. Samreen Sultan is a community architect and an Urbanist.She has an inclination towards solving real time urban issues and challenges. She is currently researching on ideal cooling solutions and water purification techniques for the Coolant to bring clean and accessible water for all. Shubham Kumar is Not-so -stereotype Mechanical Engineer. Pliers, pluctrums and pens are his deathly hallows. His work includes Product Research & Development inclusive of Design, Analysis and testing for the Coolant.
art | nature | technology
Hotter Summers,
Cooler Demand!

According to the IMD forecast, most parts of
India are witnessing warmer than-normal tem-
peratures in the summer season.
Viable Entry Points

High and rising temperature levels are lead-
ing to greater demand for cooling solutions.

54% i.e. 143m of Indian households live in
hot and dry climatic conditions and 4% live
in moderate climatic conditions.

                                               Cold
                                               COLD

                                               Composite
                                               HOT DRY

                                               Hot dry
                                               WARM HUMID

                                               Warm humid
                                               COMPOSITE

                                               Temperate
                                               TEMPERATE
Mean Temperature Anomaly
Temperature Upsurge April - June ‘18
1.07
0.99
1.04
0.71
1.07
High and rising temperature levels are leading to
0.43
1.08 -0.01
1.17
greater demand for cooling solutions. 1.06
0.53
0.23
0.25 0.26
0.53
With a large population, hot climate, and growing 0.50 0.59 0.22
0.09
energy demand, India has the highest unmet cool- 0.35
0.33
ing demand in the world. 0.32 0.16
0.23 0.28
0.16
0.20 0.09
-0.5
0.0
0.05 >0.01 to < 0.5
0.09 >=0.5 to < 1.0
>= 1.0Households with Air-Conditioners
18 .9 %
26.9 %
16.8%
29.4%
6.1% 8.2%
4%
10.5 % 3.7% 8.3 % 7.4 %
4.9 %
8.5 %
10 %
7.9 %
18.9 %
6.8 %
4.3 %
14.4 %
10 %
IMAGE SOURCE : India Census, MOSL 2011Air-Conditioners Sales w.r.t BEE Star Rating
6% 1-2 Star Fixed 5% 3 Star Fixed
22% 5 Star Fixed
35%
AC’s Star Rating AC’s Star Rating
Sales : FY17 Sales : FY18 Inverter
12% Inverter
3 Star Fixed 60% 5 Star Fixed 60%Market Share
5% Other Brands
5% Other 11% Daikin India
Carrier Media 6%
Bajaj 15%
Samsung 7%
11% Lloyd Electric
50% Symphony Hitachi 11% Room Airconditioner
Air Cooler
12% Blue Star
Kenstar 30%
LG 16%
21% Voltas
IMAGE SOURCE : MOSL Industry 2016“The sustainability train has left the station.Get on board or get left behind… Those who fail to bet on the green economy will be living in a grey future.” - António Guterres, UN secretary general, 2017
Ether

Ergonomic and aesthetic design.
Evapolar
My Chill
Plus +
IDI Personal Mini
Air-Cooler
Cool Shirt Rev’it
IMAGE SOURCE : Google Images.
You can also read