Development of a COVID-19 Web Information Transmission Structure Based on a Quadruple Helix Model: Webometric Network Approach Using Bing ...
←
→
Page content transcription
If your browser does not render page correctly, please read the page content below
JOURNAL OF MEDICAL INTERNET RESEARCH                                                                                                        Zhu & Park

     Original Paper

     Development of a COVID-19 Web Information Transmission
     Structure Based on a Quadruple Helix Model: Webometric Network
     Approach Using Bing

     Yu Peng Zhu1,2, PhD; Han Woo Park2,3,4, PhD
     1
      Blockchain Policy Research Center, Cyber Emotions Research Institute, Yeungnam University, Gyeongsan-si, Republic of Korea
     2
      Department of Media and Communication, Yeungnam University, Gyeongsan-si, Republic of Korea
     3
      Interdisciplinary Graduate Programs of Digital Convergence Business, Yeungnam University, Gyeongsan-si, Republic of Korea
     4
      Interdisciplinary Graduate Programs of East Asian Cultural Studies, Yeungnam University, Gyeongsan-si, Republic of Korea

     Corresponding Author:
     Han Woo Park, PhD
     Department of Media and Communication
     Yeungnam University
     214-1 Dae-dong
     Gyeongsan-si
     Republic of Korea
     Phone: 82 53 810 2275
     Email: hanpark@ynu.ac.kr

     Abstract
     Background: Developing an understanding of the social structure and phenomenon of pandemic information sources worldwide
     is immensely significant.
     Objective: Based on the quadruple helix model, the aim of this study was to construct and analyze the structure and content of
     the internet information sources regarding the COVID-19 pandemic, considering time and space. The broader goal was to determine
     the status and limitations of web information transmission and online communication structure during public health emergencies.
     Methods: By sorting the second top-level domain, we divided the structure of network information sources into four levels:
     government, educational organizations, companies, and nonprofit organizations. We analyzed the structure of information sources
     and the evolution of information content at each stage using quadruple helix and network analysis methods.
     Results: The results of the structural analysis indicated that the online sources of information in Asia were more diverse than
     those in other regions in February 2020. As the pandemic spread in April, the information sources in non-Asian regions began
     to diversify, and the information source structure diversified further in July. With the spread of the pandemic, for an increasing
     number of countries, not only the government authorities of high concern but also commercial and educational organizations
     began to produce and provide significant amounts of information and advice. Nonprofit organizations also produced information,
     but to a lesser extent. The impact of the virus spread from the initial public level of the government to many levels within society.
     After April, the government’s role in the COVID-19 network information was central. The results of the content analysis showed
     that there was an increased focus on discussion regarding public health–related campaign materials at all stages. The information
     content changed with the changing stages. In the early stages, the basic situation regarding the virus and its impact on health
     attracted most of the attention. Later, the content was more focused on prevention. The business and policy environment also
     changed from the beginning of the pandemic, and the social changes caused by the pandemic became a popular discussion topic.
     Conclusions: For public health emergencies, some online and offline information sources may not be sufficient. Diversified
     institutions must pay attention to public health emergencies and actively respond to multihelical information sources. In terms
     of published messages, the educational sector plays an important role in public health events. However, educational institutions
     release less information than governments and businesses. This study proposes that the quadruple helix not only has research
     significance in the field of scientific cooperation but could also be used to perform effective research regarding web information
     during crises. This is significant for further development of the quadruple helix model in the medical internet research area.

     (J Med Internet Res 2021;23(8):e27681) doi: 10.2196/27681

     https://www.jmir.org/2021/8/e27681                                                                  J Med Internet Res 2021 | vol. 23 | iss. 8 | e27681 | p. 1
                                                                                                                       (page number not for citation purposes)
XSL• FO
RenderX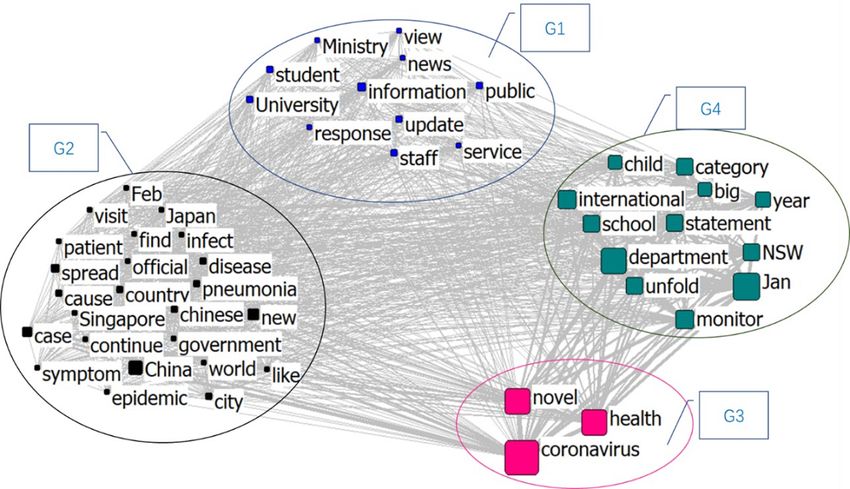
JOURNAL OF MEDICAL INTERNET RESEARCH                                                                                                   Zhu & Park

     KEYWORDS
     quadruple helix model; COVID-19; structural analysis; content analysis; network analysis; public health; webometrics;
     infodemiology; infoveillance; development; internet; online health information; structure; communication; big data

                                                                           COVID-19 has had a strong impact on the media system [10-12].
     Introduction                                                          People have created significant numbers of online documents
     Background                                                            by utilizing new media sources such as Facebook and Twitter
                                                                           [13-15]. In fact, governments in some countries have used these
     Since the first reported case of COVID-19 in late 2019, the           forms of new media to build platforms to help combat the virus
     disease rapidly spread to become a pandemic in March 2020.            [16]. For example, due to the COVID-19 outbreak in Wuhan
     An infectious disease caused by a pathogen generally spreads          in February 2020, and the shortage of medical resources and
     to a living host, and it is easily transferable from the infected.    services, Weibo, one of the largest new media companies in
     As of January 7, 2021, over 87 million people have been infected      China, cooperated with the local government to set up a citizen
     with the virus in 190 countries and regions worldwide since the       assistance platform on which citizens with real-name
     outbreak of COVID-19 in February 2020, resulting in a global          identification could ask for help. This new mode of interaction
     catastrophe [1].                                                      is difficult to create with traditional media. To deal with the
     Social disasters, including infectious diseases, must be controlled   COVID-19 pandemic that is currently threatening the world, it
     through a process of actual data–based analysis [2]. Real-time        is evident that the greater the number of internet information
     assessment is critical for disaster monitoring; special attention     sources, the stronger the social immune system.
     must be paid to rapid analysis using relevant social and cultural     Therefore, in this study, we collected information sources with
     data at both the macro and micro scales. The core of                  high online presence through big-data techniques in countries
     sociocultural data analysis is to understand, identify, and even      with confirmed COVID-19 cases. Additionally, the information
     predict the risk of transmission. Thus, a system needs to be          related to COVID-19 in three stages (from February to April to
     constructed to collect data based on the disaster type or area,       July 2020) was analyzed in detail, and the morphology and trend
     and to support the spontaneous decision-making process.               of the web big data in these first 6 months of the pandemic are
     Without this system, the public would face an information             discussed. From these large-scale online big data, the
     overload, as they would feel burdened dealing with an enormous        information dissemination trends of educational institutes,
     amount of information in critical situations [3].                     enterprises, and government, and their contents were analyzed.
     In today’s knowledge-based society, information production            In the case of an emergency or a disaster, this study can
     goes beyond traditional media organizations and involves many         systematically explain the multielement spiral structure of the
     entities. In particular, with the increased popularity of             information transmission source in the cyberspace of major
     smartphones, the amount of online information produced by             countries, which has high academic and social value.
     individuals and organizations has grown exponentially. As the         In general, based on the quadruple helix and network analysis
     information production process becomes increasingly complex,          method, this study constructed and analyzed the structure and
     traditional media companies face a situation in which the             content of internet information sources of COVID-19
     so-called legacy media’s usage time has decreased and is now          considering time and space. The aim was to determine the status
     competing with various sources [4]. Search engines and web            and limitations of web information transmission and online
     portals are catering to a wider range of user needs than              communication structure in public health emergencies.
     traditional alternatives [5]. Low cost is an important reason that    Moreover, based on the content revealed, valuable suggestions
     internet information channels have more advantages than               are proposed to contribute to the internet communication of
     traditional information channels [6]. This phenomenon is              future public health events.
     especially obvious when significant events occur. The same is
     true for the information about COVID-19. Fear, anger, and other       Online Information Sources
     emotions also lead people to believe and spread online                With the rapid growth of the internet, web data analysis (often
     information available through nontraditional media, regardless        called “webometrics”) has become important, and its
     of whether it is fake [7]. This implies that not only individual      quantitative vastness and content diversity have been increasing
     media and informal organizations but also a large number of           accordingly. As mobile phones, tablets, and other mobile
     formal organizations such as governments, academic institutions,      terminals have been growing in popularity, people usually use
     and formal public organizations have started using online media       these terminals to obtain information instead of traditional
     to produce and disseminate information. However, sensitivity          media. Although some mainstream media outlets have their
     to fake news is also often influenced by political ideology [8].      own web feeds, people generally use digital feeds from search
     In some countries, citizens do not support direct government          engines such as Bing or Google to obtain information. Therefore,
     control of the news, and are more concerned with information          the study and analysis of comprehensive network information
     sources in cooperation with the media and other                       is often more objective than the study of specific news media,
     nongovernmental organizations [9]. Therefore, web media               and more comprehensive information can be collated. For
     represent a strong competitor to traditional media in terms of        example, Thelwall [17] used Wikipedia data collected by Bing
     both production and services.                                         to study public interest in astronomy. Park et al [18] used Twitter
                                                                           and YouTube to analyze the spread of the Occupy Wall Street

     https://www.jmir.org/2021/8/e27681                                                             J Med Internet Res 2021 | vol. 23 | iss. 8 | e27681 | p. 2
                                                                                                                  (page number not for citation purposes)
XSL• FO
RenderX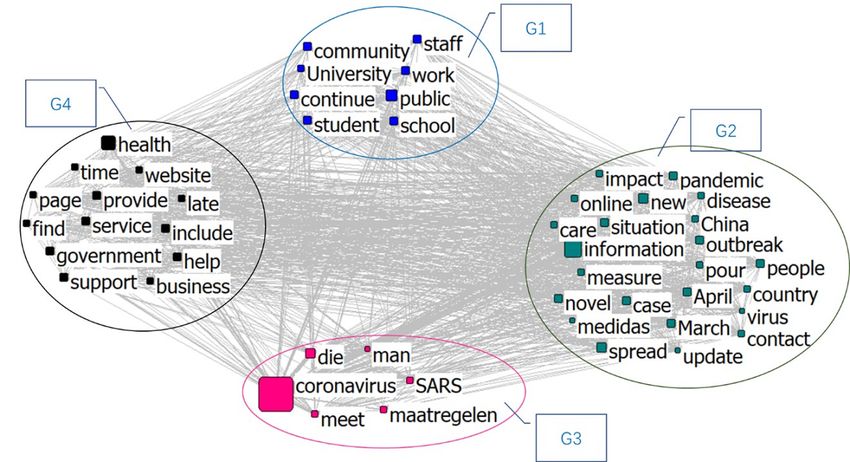
JOURNAL OF MEDICAL INTERNET RESEARCH                                                                                                 Zhu & Park

     movement. Park and Lim [19] analyzed North Korean
     propaganda changes using YouTube media data. Cho and Park
                                                                         Methods
     [16] used network activity information about the agriculture,       Data Collection
     forestry, and fishery departments to discuss the use of internet
     innovation by government organizations. This literature indicates   Data were collected using Webometric Analyst 4.1 through
     that analysis and research on web sources have drawn useful         Bing, which is one of the most widely used search engines that
     conclusions in many areas to date.                                  is available in most countries and regions, including Mainland
                                                                         China. In addition to Google, the Bing search engine is also
     There has also been substantial research regarding online sources   often used to carry out scientific research [27-29]. Although
     of information at the time a disaster occurs. Jung and Park [20]    Google is the world’s largest search engine, it is not available
     used webometric methods to track and analyze the information        in some regions, including mainland China. Since web page
     networks of various organizations during the Gumi chemical          data from China were very important for this study, we used
     spill in South Korea. They found that the flow of information       the Bing platform for data collection. Website and domains
     between agencies had an impact on mobilizing emergency              obtained through the search application programming interface
     facilities and planning specific emergency responses. Online        service of Bing were analyzed. In February 2020, the most
     sources of information can also help alleviate the damage caused    widely used COVID-19 keyword in the world was
     by disasters. Allaire [21] studied the Bangkok floods and found     “coronavirus.” Therefore, the keyword for the data collected
     that social media users were obtaining real-time updates that       on February 12 was “coronavirus.” After February, the terms
     could help to reduce their losses. Park [22] analyzed YouTube       “COVID-19” and “2019-nCOV” were also widely used.
     social activities during the 2016 South Korean earthquake, and      Therefore, we chose “COVID-19 OR Coronavirus OR
     found that YouTube became a channel to raise public crisis          2019-nCOV” for the keyword searches performed on April 17
     awareness and promote safety strategies. Kim et al [23] also        and July 22, 2020. Data were collected in real time, instead of
     elaborated on the role of social media in relaying information      collecting all information during a certain period. In other words,
     during disasters. By studying data from online information          the data for these three time points (February 12, April 17, and
     sources during the 2017 storms in the United States, it was found   July 22, 2020) are the results of real-time relevant searches on
     that the flow of information across the network was controlled      Bing for that day. Instant messages were not limited to the time
     by many types of users. Song et al [24] studied the differences     of publication, and they may contain previously published
     and the range of emotions people felt toward local online           information that is still highly popular. In addition, instant
     channels, including publishing boards, Twitter, cafes, blogs,       messages can reflect the actual state of the internet data at that
     and news, that delivered information related to MERS (Middle        time.
     East Respiratory Syndrome) [24]. Some scholars also analyzed
     the network information source data regarding COVID-19. For         The time of the first collection was in the initial stage of the
     example, Park et al [25] collected Twitter data and found that      outbreak, the time of the second collection corresponded to the
     monitoring public dialog and rapidly spreading media news can       stage at which the number of new diagnoses had leveled off
     help professionals make complex and rapid decisions. However,       after spreading worldwide, and the time of the third collection
     web page data in internet information sources are often more        corresponded to the stage when the number of newly diagnosed
     stable than those in a social media environment [26]; therefore,    patients increased sharply as a second wave. For February, we
     we adopted web page data for analysis.                              collected data for all 28 countries and regions with confirmed
                                                                         cases, with a total of 9149 data points. For April 17, we collected
     To grasp and respond to the situation of worldwide disasters        data from 29 countries and regions with over 7000 confirmed
     such as COVID-19, we collected and analyzed the network             cases and obtained 14,768 data points. For July 22, we collected
     information source data of countries with a large number of         data of over 70,000 people who received a diagnosis in 30
     confirmed cases to understand how the disaster-related              countries and regions, and obtained 14,483 pieces of data. Our
     information provided by multiple sources changes over time.         data were collected from the top countries with the highest
     We identified three time periods (February, April, and July         number of diagnoses per stage, not only from English-speaking
     2020), and performed a detailed analysis of the differences in      countries. To ensure consistency, we only analyzed the English
     information sources at these times. We also studied the structure   data on the webpage.
     of national cyberspace information sources. Through these
     analyses, we identified the structural evolution of web             Quadruple Helix
     information publishers and clearly revealed the dynamic changes     Quadruple helix is a research method based on triple helix,
     of information content in each period.                              which was proposed in 1995 [30]. Researchers studied the
                                                                         development of the knowledge-based economic structure
     Research Questions                                                  through the spiral relationships among universities, industries,
     Our primary research questions were as follows: (1) What are        and the government. At first, the triple helix model was used
     the structures and form of the COVID-19 web-mediated network        to explain the interaction among academia, government, and
     among countries? (2) Are there differences in the keywords and      industries, and was often used in research related to knowledge
     topics of COVID-19–related online information at different          production [31]. However, with the development of the triple
     stages?                                                             helix theory, more elements were considered. In 2009,
                                                                         Carayannis and Campbell [32] introduced elements representing
                                                                         the public into the spiral model, such as the civil society and

     https://www.jmir.org/2021/8/e27681                                                           J Med Internet Res 2021 | vol. 23 | iss. 8 | e27681 | p. 3
                                                                                                                (page number not for citation purposes)
XSL• FO
RenderX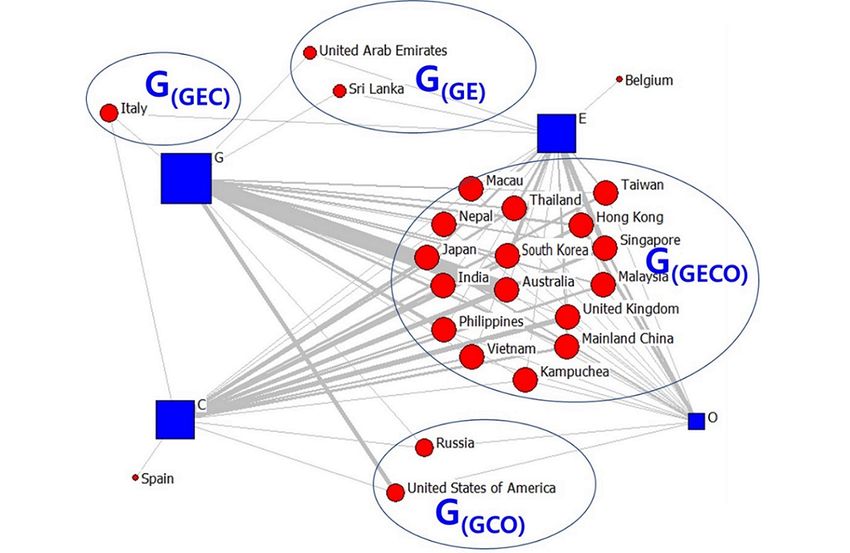
JOURNAL OF MEDICAL INTERNET RESEARCH                                                                                                  Zhu & Park

     media, thereby forming a quadruple helix model; they added a         betweenness centrality, eigenvector centrality, closeness
     research method at the level of new technologies and social          centrality, and others [37-40]. The centrality index used in this
     needs. In 2010, Carayannis and Campbell [33] added the natural       study was degree centrality. Degree indicates the direct
     environment factor and constructed the quintuple helix model.        relationship between the nodes [39,40]. In this study, the degree
     Based on this factor, the relationship between innovation and        was mainly used to determine whether the governments,
     sustainable development can be discussed. During cooperation         education institutions, nonprofit organizations, and commercial
     and communication between various organizations, when one            organizations of different countries have similar information,
     kind of organization occupies a dominant position, it can be         and to observe the helix degree of different countries and the
     considered that this organization is separated from the collection   four fields. Although betweenness centrality is an important
     of various organizations, and the relationships among different      indicator for evaluating the influence of a mediating effect, the
     organizations can be studied and explained through the               link between countries in this study is common information
     quadruple, quintuple, or n-tuple helix concept [31]. This spiral     without mediating phenomena; thus, it was not used for this
     structure does not always exist only in the academic,                analysis. In addition, the eigenvector centrality is an index to
     government, and industrial dimensions.                               evaluate the importance of each node connected to other nodes.
                                                                          However, in this study, based on the importance of government,
     We collated the second top-level domain (TLD) data, which
                                                                          education, public authorities, and companies, it was considered
     were categorized as data from commercial organizations,
                                                                          to be less important to evaluate the significance of the connected
     educational institutes, governments, and nonprofit organizations.
                                                                          countries’ eigenvector centrality. Closeness centrality is an
     A total of 38,399 domains were collected. To better classify the
                                                                          indicator of the shortest distance, and was also considered to
     effective levels, we first sorted all of the collected second TLD
                                                                          be of little significance for this study. However, the degree
     data. After frequency analysis, the second TLD data that had
                                                                          centrality index can judge the strength of direct connections
     an occurrence frequency higher than 1% (91/9149; 148/14,767;
                                                                          between countries and domains. In other words, the more
     145/14,483) were selected for classification. From 15,813 data
                                                                          countries connected in a field, the stronger the influence of this
     units, we extracted four levels, namely governments, commercial
                                                                          field. Therefore, only degree centrality was used for this
     enterprises, educational institutes, and nonprofit organizations.
                                                                          analysis.
     We used the quadruple helix model to analyze the structural
     dynamics of the four institutional levels at different periods in    We used UCINET6 for network analysis and network
     detail. For convenience in figures, we abbreviate government         visualization, including triple helix network analysis and content
     domains such as “.gov,” “gob,” and “.go” collectively as “G”         analysis. In the content analysis, we used the convergence of
     (governments); educational domains such as “.edu” and “.ac”          iterated correlations (CONCOR) method to cluster the semantic
     as “E” (educational institutes); commercial domains such as          network in which words are regarded as nodes and cooccurrence
     “.com” and “.co” as “C” (commercial organizations); and “.org”       between words forms a tie. CONCOR is a method of performing
     and “.or” nonprofit domains as “O” (nonprofit organizations).        repeated cross-node correlation analyses to identify the
                                                                          appropriate level of similarity [41]. In other words, we first
     Network Analysis                                                     organized the relationships among words into matrices, thus
     A network analysis method was used to analyze the structure          forming a network of relationships among words. We then
     of the quadruple helix in detail. Network analysis is a method       calculated the correlation coefficients between the rows and
     of quantitative analysis of nodes and connections in a network.      columns in the matrix and carried out the same calculation for
     When individuals and organizations act as nodes, the connection      the obtained correlation coefficient matrix. After repeated
     between them acts as a link. Through the quantitative results of     calculations, a correlation coefficient matrix consisting of only
     the structure, the characteristics and nature of the network         1 and –1 was obtained, which was thus divided into two
     composed of these entities can be analyzed [34]. Network             categories. We then performed the same calculation for both
     analysis has been widely used in social science research such        categories again and obtained four different clusters.
     as in social media use, knowledge dissemination, and
     organizational cooperation [35,36]. Although nodes have the          Results
     same properties in a one-mode network, nodes differ in
     two-mode networks. Thus, in the one-mode network, nodes are          The hit counts and domains for each country (or region) are
     the institutional components of a quadruple helix: government,       compiled and listed in Tables 1-3 for the three time periods,
     private/business, educational institutions, and nonprofit            respectively. We standardized the number of hits and domain
     organizations. By contrast, the two-mode network focuses on          names for the three months (February, April, and July), with
     the relationship between the analyzed countries and the four         the maximum value set to 100 and the rest being the ratio of
     institutional types. Centrality indices are important quantitative   the original value to the maximum value multiplied by 100.
     indices in network analysis, including degree centrality,

     https://www.jmir.org/2021/8/e27681                                                            J Med Internet Res 2021 | vol. 23 | iss. 8 | e27681 | p. 4
                                                                                                                 (page number not for citation purposes)
XSL• FO
RenderX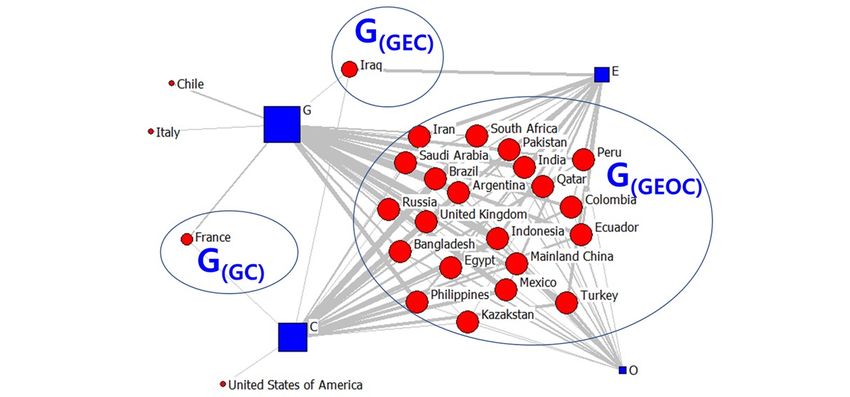
JOURNAL OF MEDICAL INTERNET RESEARCH                                                                             Zhu & Park

     Table 1. Hit counts and domains for February (N=28).
      Country                                          Hit counts   Domains
      Australia                                        100.00       100.00
      Canada                                           32.46        53.23
      Italy                                            24.69        67.93
      United Kingdom                                   23.93        33.08
      Germany                                          21.05        43.98
      France                                           18.30        33.46
      Spain                                            13.66        44.61
      Belgium                                          10.41        38.91
      Japan                                            7.29         81.62
      India                                            5.99         33.33
      Mainland China                                   5.61         47.40
      Singapore                                        5.34         69.84
      Malaysia                                         4.10         28.77
      United States                                    3.11         64.39
      Hong Kong (China)                                2.26         68.44
      United Arab Emirates                             2.22         7.73
      South Korea                                      1.63         32.07
      Taiwan                                           1.29         35.61
      Philippines                                      1.29         29.91
      Sweden                                           1.10         58.17
      Sri Lanka                                        0.83         10.65
      Vietnam                                          0.70         40.18
      Finland                                          0.61         19.90
      Russia                                           0.42         47.02
      Thailand                                         0.18         41.70
      Macau                                            0.16         14.45
      Nepal                                            0.06         5.83
      Cambodia                                         0.02         7.35

     https://www.jmir.org/2021/8/e27681                                       J Med Internet Res 2021 | vol. 23 | iss. 8 | e27681 | p. 5
                                                                                            (page number not for citation purposes)
XSL• FO
RenderX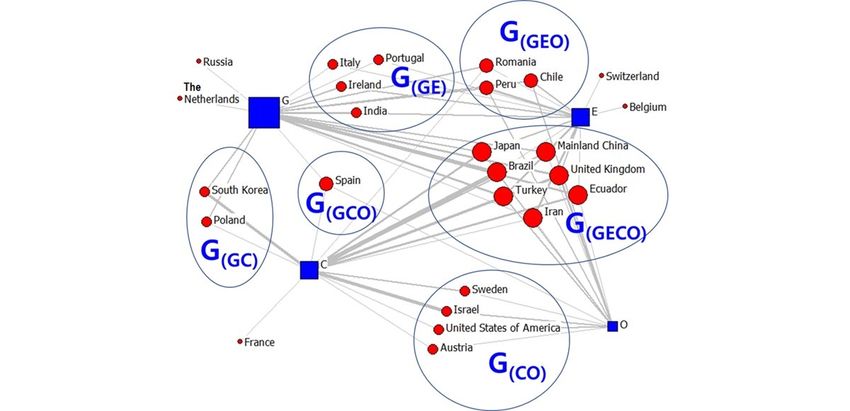
JOURNAL OF MEDICAL INTERNET RESEARCH                                                                               Zhu & Park

     Table 2. Hit counts and domains for April (N=29).
      Country                                            Hit counts   Domains
      Canada                                             100.00       81.26
      France                                             69.96        79.83
      England                                            61.98        58.84
      Germany                                            53.23        83.51
      Brazil                                             51.71        88.14
      Italy                                              46.01        75.92
      US                                                 32.78        99.88
      Sweden                                             31.67        100.00
      Belgium                                            30.61        44.13
      Japan                                              30.42        61.80
      Austria                                            21.48        41.04
      Netherlands                                        20.95        93.24
      Spain                                              18.17        59.43
      Turkey                                             18.10        49.23
      Chile                                              16.73        55.63
      India                                              16.35        43.06
      Switzerland                                        13.92        67.50
      Denmark                                            13.50        84.82
      Russia                                             9.16         27.05
      Portugal                                           9.13         54.09
      Ireland                                            8.33         45.20
      Korea                                              6.39         46.74
      Peru                                               5.86         31.55
      Mainland China                                     4.18         35.11
      Poland                                             3.84         75.56
      Romania                                            3.31         49.11
      Ecuador                                            2.95         41.28
      Israel                                             2.67         41.64
      Iran                                               0.36         46.38

     https://www.jmir.org/2021/8/e27681                                         J Med Internet Res 2021 | vol. 23 | iss. 8 | e27681 | p. 6
                                                                                              (page number not for citation purposes)
XSL• FO
RenderX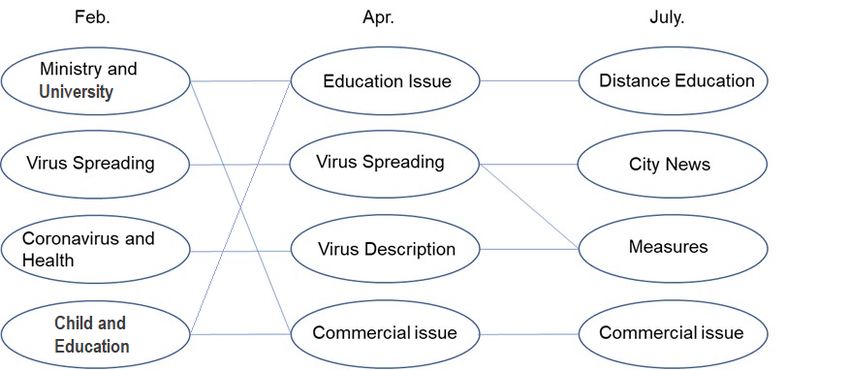
JOURNAL OF MEDICAL INTERNET RESEARCH                                                                                              Zhu & Park

     Table 3. Hit counts and domains for July (N=30).
      Country                                           Hit counts      Domains
      United Kingdom                                    100.00          3.18
      Canada                                            47.74           87.18
      France                                            46.76           81.88
      Mainland China                                    36.35           49.18
      Brazil                                            33.40           92.00
      Germany                                           32.22           4.59
      Italy                                             24.56           94.24
      Argentina                                         15.11           81.06
      Mexico                                            13.67           89.06
      Spain                                             11.00           4.47
      South Africa                                      8.47            57.65
      India                                             7.52            84.82
      Turkey                                            7.43            71.41
      United States of America                          6.35            3.41
      Russia                                            6.25            81.76
      Colombia                                          4.20            68.00
      Peru                                              4.01            41.18
      Sweden                                            3.61            83.88
      Chile                                             2.85            77.53
      Ecuador                                           1.80            58.59
      Indonesia                                         1.53            100.00
      Pakistan                                          1.07            57.65
      Philippines                                       1.02            61.41
      Egypt                                             0.73            30.59
      Iran                                              0.57            58.47
      Bangladesh                                        0.47            42.47
      Kazakhstan                                        0.26            44.82
      Saudi Arabia                                      0.15            32.94
      Qatar                                             0.05            35.06
      Iraq                                              0.02            25.41

     Table 1 shows that the countries with the highest hit counts in    large “G” in the figures denotes “group.” For example,
     February were Australia, Canada, Italy, the United Kingdom,        G(GEOC) means the group in which G (government), E
     and Germany. Table 2 shows that the countries with the highest     (education), O (nonprofit organizations), and C (commercial
     hit counts in April were Canada, France, and the United            organizations) appear simultaneously.
     Kingdom. Table 3 shows that the countries with the highest hit
                                                                        As seen in Figure 1, most of the COVID-19–related messages
     counts in July were the United Kingdom, Canada, and France.
                                                                        released in February were from the government, educational,
     In February, there were more domains in Australia, Japan, and
                                                                        or commercial sectors, with relatively few messages from the
     Singapore. In April, more domains were observed in Sweden,
                                                                        nonprofit sector. We divided the countries into several groups
     the United States, and the Netherlands. In July, more domains
                                                                        based on areas. Among all groups, the countries and regions
     were found in Indonesia, Italy, and Brazil.
                                                                        that received information from these four areas the most
     Following these results, we analyzed publishing organizations.     included mainland China, Hong Kong, Macao, Australia, and
     We visualized the countries involved in the high-frequency         Vietnam. Asian countries accounted for 88% (14/16) of these
     second TLD data as a two-mode network. The data revealed 23        countries. Information from Italy was primarily from the
     countries in February, 26 countries in April, and 26 countries     government and educational enterprises. In Sri Lanka and the
     in July. The visualization results are shown in Figures 1-6. The   United Arab Emirates, information was mainly from the

     https://www.jmir.org/2021/8/e27681                                                        J Med Internet Res 2021 | vol. 23 | iss. 8 | e27681 | p. 7
                                                                                                             (page number not for citation purposes)
XSL• FO
RenderX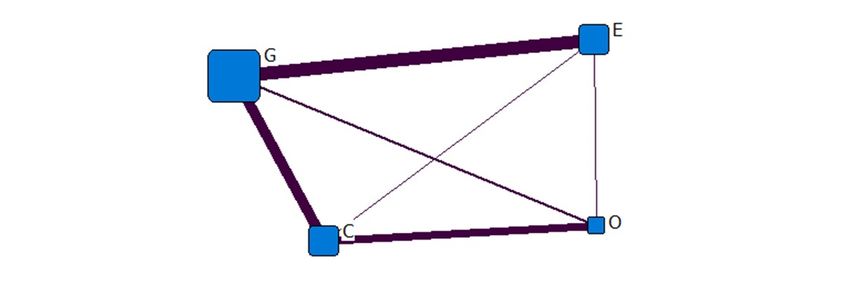
JOURNAL OF MEDICAL INTERNET RESEARCH                                                                                                       Zhu & Park

     government and educational institutes. In the United States and         Figure 2 shows the institutional network diagram of the
     Russia, information was from the government and the                     COVID-19–related information released in February 2020. The
     educational and commercial sectors. In the United States,               connection between nodes represents the simultaneous release
     government agencies were primarily concentrated in California.          of COVID-19–related information by these institutions. The
     Spain reported more commercial agencies, whereas Belgium                width of the connection line represents the frequency of
     reported the most information from the educational field. In            coreleases, and the wider the line, the more simultaneous the
     general, Asian countries were more diverse regarding the online         releases. The bold line between G and C indicates that the
     information shared on COVID-19 in February than other                   government and commercial area released the most information
     regions. This could be because most of the confirmed                    simultaneously, followed by the government and educational
     COVID-19 cases were diagnosed during this period in Asia,               sector, and then the commercial and educational sector. Within
     and various regions of the continent were considered to be more         the framework of the quadruple helix model, the government
     sensitive than others [42].                                             and the educational and commercial institutions were the leading
                                                                             producers of COVID-19–related information, and they played
                                                                             a prominent role.
     Figure 1. Two-mode quadruple helix structure in February 2020. Large "G" refers to the group. G: government domains; E: educational institute
     domains; C: commercial domains; O: nonprofit organization domains.

     Figure 2. One-mode quadruple helix structure in February 2020. G: government domains; E: educational institute domains; C: commercial domains;
     O: nonprofit organization domains.

     https://www.jmir.org/2021/8/e27681                                                                 J Med Internet Res 2021 | vol. 23 | iss. 8 | e27681 | p. 8
                                                                                                                      (page number not for citation purposes)
XSL• FO
RenderX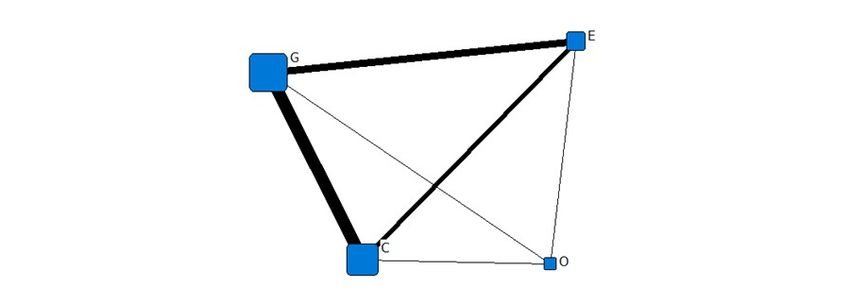
JOURNAL OF MEDICAL INTERNET RESEARCH                                                                                                          Zhu & Park

     As seen in Figure 3, April’s COVID-19 messages were primarily              Poland, government and commercial sectors released more
     from the government and the educational and commercial                     information. In Russia and the Netherlands, most information
     sectors, and relatively little information was provided by the             was shared by government agencies, while in Switzerland and
     nonprofit sector, as was the case in February. The number of               Belgium, educational institutions were the primary sources of
     countries and regions that received information from all four              COVID-19–related information. In France, the information was
     areas simultaneously was the largest. The areas in which                   primarily shared through the commercial sector. In general, the
     COVID-19 information was released in these countries were                  online information shared about COVID-19 during April and
     relatively diverse, including mainland China, the United                   February was quite different in terms of both countries and
     Kingdom, Brazil, and Japan, with Asian countries accounting                institutions. Non-Asian countries diversified their fields as
     for less than half. This is significantly different from the               COVID-19 became a pandemic.
     situation in February because, at this stage, COVID-19 became
                                                                                Figure 4 shows the institutional network diagram of the
     a pandemic and was no longer concentrated in Asia. Information
                                                                                COVID-19–related information released in April. The
     from Romania, Peru, and Chile was primarily from the
                                                                                government and the educational sector released the most
     government and the educational and nonprofit sectors. In Spain,
                                                                                information at this time. The relationship between the
     information was mostly from the government and the
                                                                                government and commercial sector, and that between
     commercial and nonprofit sectors. Portugal, Italy, India, and
                                                                                commercial and nonprofit organizations was also closer. In
     Ireland received information primarily from the government
                                                                                April, the government and the educational and commercial
     and educational sector. Countries where commercial and
                                                                                institutions were still the leading producers of information,
     nonprofit agencies released more information included Israel,
                                                                                playing a prominent role in information dissemination.
     the United States, Austria, and Sweden. For South Korea and
     Figure 3. Two-mode quadruple helix structure in April 2020. Large "G" refers to the group. G: government domains; E: educational institute domains;
     C: commercial domains; O: nonprofit organization domains.

     Figure 4. One-mode quadruple helix structure in April 2020. G: government domains; E: educational institute domains; C: commercial domains; O:
     nonprofit organization domains.

     https://www.jmir.org/2021/8/e27681                                                                    J Med Internet Res 2021 | vol. 23 | iss. 8 | e27681 | p. 9
                                                                                                                         (page number not for citation purposes)
XSL• FO
RenderX
JOURNAL OF MEDICAL INTERNET RESEARCH Zhu & Park
The two-mode diagram of the COVID-19 information release Figure 6 shows the institutional network diagram representing
in July shows that most countries were delivering information the COVID-19–related information released in July. The number
from a diverse range of sectors (Figure 5). The proportion of of concurrent announcements made by the government and
individual areas and of countries and regions that received commercial sector remained the highest, followed by the
information from only two areas was lower than that in the government and educational sector, and then the commercial
previous phases. The countries and regions that received and educational sectors. In the three stages, the government and
information from all four sectors the most included mainland the educational and commercial institutions were the leading
China, Russia, Turkey, and the Philippines. In April, the producers of information and played a prominent role.
COVID-19 pandemic continued to spread around the world,
We collated the degree centralities in four helices and found
and the geographic distribution of information was also seen
that the commercial sector in February had the highest degree,
globally, and not just in Asia. Information from Iraq was
followed by the government and educational sector, and finally
primarily from the government and commercial and educational
the nonprofit organizations (Figure 7). In April, the biggest area
organizations. Information in France was from the government
of degree centrality was again the commercial sector, followed
and nonprofit sectors. Government agencies in Chile and Italy
by the government, nonprofit organizations, and finally
provided relatively more information. In the United States,
educational organizations. In July, the government ranked first,
information from the government and educational sector
commercial organizations ranked second, educational
decreased, while information from commercial sectors increased.
organizations were third, and the nonprofit sector fourth. Thus,
Less information was collected from Bing in the United States
the government and commercial organizations played a
in July. Most regions of the world and many industries were
significant role in the COVID-19 information network, whereas
affected by the pandemic in July. The structure of the network
the role of the nonprofit sector was relatively small.
for information-publishing organizations also developed from
the coexistence of double, triple, and quadruple helices to the
main structure of quadruple helices.
Figure 5. Two-mode quadruple helix structure in July 2020. Large "G" refers to the group. G: government domains; E: educational institute domains;
C: commercial domains; O: nonprofit organization domains.
https://www.jmir.org/2021/8/e27681 J Med Internet Res 2021 | vol. 23 | iss. 8 | e27681 | p. 10
(page number not for citation purposes)
XSL• FO
RenderXJOURNAL OF MEDICAL INTERNET RESEARCH Zhu & Park
Figure 6. One-mode quadruple helix structure in July 2020. G: government domains; E: educational institute domains; C: commercial domains; O:
nonprofit organization domains.
Figure 7. Degrees of the three stages. G: government domains; E: educational institute domains; C: commercial domains; O: nonprofit organization
domains.
We performed a text analysis and CONCOR analysis for the Table 4 indicates that in February, people paid the most attention
content of the information shared. For the content analysis, we to the affected areas (China), health, departments, international,
deleted non-English and scrambled characters during data and news. In April, the content was focused on information
cleaning. There was a total of 9149 documents in February, and regarding deaths, health, the pandemic, and public. In July, the
8889 remained after cleaning. There were originally 14,768 content was focused on information regarding the pandemic,
documents in April, 14,766 of which remained after cleaning. health, and news. These remained the top concerns in July 2020,
The number of documents in July was 14,484 and 13,087 whereas words such as “online,” “service,” “university,” and
remained after cleaning. Word preprocessing was first performed “government” were also highly ranked at this time. To
using Python (the Spacy package) and the results were manually summarize, the main content in February was dominated by
collated. We identified the 50 most frequently found words information and news about the outbreak; in April, information
during each of the three months, which are compiled in Table was primarily regarding the public and the pandemic; and in
4. July, various online services were used to address the problems
caused by the pandemic.
https://www.jmir.org/2021/8/e27681 J Med Internet Res 2021 | vol. 23 | iss. 8 | e27681 | p. 11
(page number not for citation purposes)
XSL• FO
RenderXJOURNAL OF MEDICAL INTERNET RESEARCH Zhu & Park
Table 4. The 50 most frequent words of the three stages.
Rank February April July
Words Standardized frequency Words Standardized frequency Words Standardized frequency
1 coronavirus 100.00 coronavirus 100.00 coronavirus 100.00
2 country 59.30 information 24.96 information 36.79
3 China 30.18 die 21.70 pandemic 24.33
4 novel 28.57 health 12.09 health 22.67
5 health 27.90 virus 9.96 online 18.62
6 Jan 21.14 pandemic 8.22 service 17.20
7 international 19.88 public 7.64 virus 14.21
8 year 19.53 update 6.88 university 12.67
9 department 17.85 country 6.69 government 12.24
10 news 16.35 pour 6.62 news 12.12
11 world 16.00 school 6.60 provide 11.88
12 school 15.91 service 6.58 case 11.28
13 new 15.24 meet 5.91 July 10.49
14 visit 14.22 spread 5.69 new 9.98
15 statement 13.62 April 5.53 development 9.73
16 spread 13.30 government 5.24 education 9.46
17 patient 12.65 March 5.16 ministry 9.46
18 NSW 12.44 SARS 4.92 update 9.46
19 case 10.78 China 4.91 June 9.43
20 epidemic 10.37 situation 4.86 world 9.22
21 response 9.04 help 4.52 country 8.98
22 Japan 8.92 case 4.51 China 8.49
23 student 8.92 work 4.51 support 8.49
24 find 8.81 student 4.48 work 8.31
25 official 8.81 new 4.47 help 8.28
26 category 8.72 continue 4.36 business 8.19
27 university 8.52 provide 4.36 time 7.83
28 staff 8.40 novel 4.13 public 7.59
29 information 7.98 outbreak 4.13 spread 7.35
30 symptom 7.87 community 4.01 March 7.29
31 child 7.43 care 3.91 student 7.29
32 like 6.96 support 3.91 include 7.26
33 continue 6.82 online 3.88 Pakistan 7.10
34 city 6.71 people 3.75 SARS 7.04
35 public 6.67 website 3.75 India 6.86
36 Feb 6.59 maatregelen 3.67 Indonesia 6.77
37 ministry 6.12 include 3.64 community 6.71
38 disease 5.98 medidas 3.53 website 6.56
39 big 5.97 time 3.52 year 6.50
40 monitor 5.95 business 3.38 measure 6.47
41 pneumonia 5.83 impact 3.23 continue 6.44
https://www.jmir.org/2021/8/e27681 J Med Internet Res 2021 | vol. 23 | iss. 8 | e27681 | p. 12
(page number not for citation purposes)
XSL• FO
RenderXJOURNAL OF MEDICAL INTERNET RESEARCH Zhu & Park
Rank February April July
Words Standardized frequency Words Standardized frequency Words Standardized frequency
42 update 5.75 man 3.11 disease 6.41
43 government 5.36 find 3.08 national 6.41
44 service 5.33 university 3.07 people 6.35
45 unfold 5.07 page 3.06 find 6.32
46 view 4.81 contact 3.02 medidas 6.32
47 Singapore 4.63 disease 2.98 home 6.26
48 cause 4.60 staff 2.94 social 6.14
49 infect 4.58 late 2.93 South 6.14
50 Chinese 4.29 measure 2.92 read 6.08
To further assimilate valuable information, we constructed the departments, public authorities, and schools. Group 2 is named
semantic network of high-frequency words and used CONCOR “Virus Spreading,” which primarily includes confirmed cities,
analysis for clustering. Furthermore, we obtained a visualization patient symptoms, and the spread of the infection. Group 3 is
diagram of the clustering network in the three stages. “Coronavirus and Health” and Group 4 is “Child and
Education.” Most of the information in Group 4 is related to
Group 1 in Figure 8 is named “Ministry and University,” which
“NSW (New South Wales, Australia) education” and “child,”
contains information on services provided by the government
and it showed the highest frequency in February.
Figure 8. Semantic network in February 2020.
Figure 9 shows the semantic network for April. Group 1 is a characteristics of the virus. Group 4 is “Commercial Issue,”
school and student-related group named “Education Issue.” which includes words such as “business,” “government,”
Group 2 is “Virus Spreading,” including information about the “service,” and “help,” and is related to the social change brought
outbreak and the spread of the pandemic. Group 3 is “Virus about by the pandemic.
Description,” which contains information related to the
https://www.jmir.org/2021/8/e27681 J Med Internet Res 2021 | vol. 23 | iss. 8 | e27681 | p. 13
(page number not for citation purposes)
XSL• FO
RenderXJOURNAL OF MEDICAL INTERNET RESEARCH Zhu & Park
Figure 9. Semantic network in April 2020.
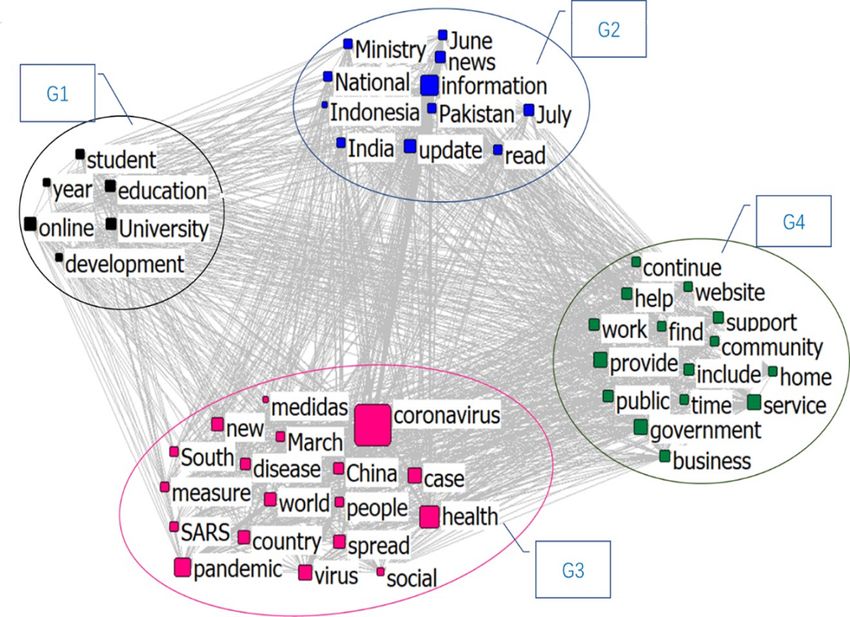
In July, the semantic network was also divided into four groups, taken, and is therefore named “Measures.” The last group is
as shown in Figure 10. Group 1 is “Distance Education,” which “Commercial Issues,” which includes information regarding
contains information about online education. Group 2 is “City “business,” “services,” “government,” “provide,” “community,”
News,” which contains information about the cities affected by and similar.
the pandemic. Group 3 contains information about the measures
Figure 10. Semantic network in July 2020.
https://www.jmir.org/2021/8/e27681 J Med Internet Res 2021 | vol. 23 | iss. 8 | e27681 | p. 14
(page number not for citation purposes)
XSL• FO
RenderXJOURNAL OF MEDICAL INTERNET RESEARCH Zhu & Park
The clustering topics of the three stages are sorted in Figure 11. business and society was still an important topic. Information
The results show that the information in February was mainly about cities related to the outbreak also continued to appear in
regarding the response of the government and educational the news.
institutes, such as the impact on schools after the virus began
In general, education became a prominent topic of discussion
spreading, and the spread of the virus and health issues became
in all three stages. With time, the basic information regarding
prominent topics. In addition, since the spread of COVID-19
the virus and its transmission became popularized, and people
was at an early stage in February, information reports in some
began to pay more attention to information about measures to
places were also relatively prominent. By April, the disease had
prevent its spread. Since the beginning of the pandemic, the
become a pandemic. At this stage, besides information, the
situation has changed in terms of business, government policy,
spread of the virus, the description of the related characteristics
and other public issues. Society has also changed. We compared
of the virus, and the changes of the commercial environment
the results of content analysis with the results of the quadruple
became prominent topics. By July, the focus in education shifted
helix structure and found that the content analysis also confirmed
to distance education. As the pandemic could not be fully
the form of the quadruple helix structure. In the content analysis,
controlled within a short period of time, most educational
the information groups about business issues and government
institutions began to prepare for or implement online education.
emerged as relatively large, with a smaller contribution of
By this time, the public had a basic understanding of the virus
information about education, although this topic also forms a
and how it spreads, and the focus shifted to measures such as
certain scale of the groups.
how to deal with this spread. The impact of the pandemic on
Figure 11. Evolution of topic content.
February (first stage) occurred in Asia, and the online
Discussion information sources in Asia were more diversified than those
Principal Findings in other regions. As the pandemic spread in April (second stage),
non-Asian sources of information began to diversify, and in
In this study, we analyzed COVID-19 web information sources July (third stage), the sources of web information became
from a quadruple helix perspective, and found changes in globalized. Thus, the impact of the first stage of the pandemic
structure and content at each stage during the first 6 months of was more sensitive in Asia, and the information from various
online information regarding COVID-19. We also found industries was related to responding to this need. However, only
problems in the structure of information sources in the some industries in non-Asian regions paid attention in the first
transmission of relevant information. We here provide detailed stage, and the information source helix did not form, which also
suggestions, which can contribute to the internet communication led to the slow response to COVID-19 in some regions and the
of future public health events. delay in response measures [43]. Since April, the spiral has
Based on the quadruple helix model, this study collated and intensified in non-Asian regions due to the spread of the
analyzed the structure and content of the network information pandemic to many areas outside Asia, which has raised concern
sources about COVID-19 considering time and space. By sorting of various industries.
out the second TLD, we divided the structure of network In general, from the results of the two-mode analysis, the
information sources into four categories: the government, structure of the three stages of web information publishing
education, companies, and nonprofit organizations. An organization has gradually developed from the coexisting
information source network composed of four levels was structure of a double, triple, and quadruple helix to the
obtained. The results of the two-mode quadruple helix analysis diversified structure centered on the triple and quadruple helix.
of the three stages showed that the major confirmed cases in From this phenomenon, we can find that in the face of major
https://www.jmir.org/2021/8/e27681 J Med Internet Res 2021 | vol. 23 | iss. 8 | e27681 | p. 15
(page number not for citation purposes)
XSL• FO
RenderXJOURNAL OF MEDICAL INTERNET RESEARCH Zhu & Park
public health emergencies, most of the local information release governments and schools to the virus, and the spread of the
sources are not comprehensive. This phenomenon has also led virus and health issues were the main points of focus of
to the failure of many industries to anticipate and respond to discussion. The second phase focused on the spread of the virus
the pandemic in a timely fashion [44,45]. Our results suggest across the world, which created a global pandemic. At this stage,
that the health care sector can call on the local information information about educational hotspots, descriptions of
sources of various industries to release appropriate and virus-related features, and information about commercial
reasonable information about the health and public events in environment changes caused by the pandemic also received
the future to ensure the timely deployment of all sectors of attention. In the third stage, the educational hotspots
society and avoid more losses. We used a modular quadruple differentiated into the characteristics of distance education. The
helix structure to analyze the forces of these four levels at pandemic made physical face-to-face education difficult. Many
various periods in detail. We found that in February, the educational institutions began to prepare for or implement online
information shared was the most coincident and closely linked education. Public attention at this stage shifted from what the
between government and commercial organizations, followed virus was to measures of controlling its spread. In general,
by educational and government organizations. Next, there was education was a prominent topic at all levels. With the change
a closeness between the commercial and educational sectors. of stage, the information content also changed. In the early
In April, the government and the educational sector stage, the basic situation of the virus and its impact on health
simultaneously released the most information about COVID-19. attracted most of the attention. Later, the focus was on pandemic
The relationship between the government and commercial prevention measures. The business environment and policy
sectors, and the relationship between commercial and nonprofit environment have changed from the beginning of the pandemic,
sectors were also closer. In July, the number of concurrent and the social changes caused by the pandemic have also
announcements about COVID-19 by the government and become an important discussion topic.
commercial sector remained the highest, followed by the
government and educational sector, and then the commercial
Limitations
and educational sectors. We collated the centrality of the three Owing to the large amount of data from all countries worldwide,
stages and four areas, indicating that the commercial area scored this study has only used the web information for countries with
the highest in February, followed by the government and a significant number of diagnosed cases at each stage as the
educational sectors, and finally the nonprofit organizations. In research object. In addition, we only used data from Bing.
April, the biggest area of degree centrality was also the Although Bing is more widely used than any other search engine
commercial sector, followed by the government, nonprofit in the webometric field, it does not have a strong market share
sector, and finally educational enterprises. In July, during the in some parts of the world that rely more on other search
third stage, the government played a central role in the engines. For example, Google has the largest market share in
COVID-19 information network. In all three stages, as a whole, the United States, Baidu has the largest share in China, and
the government and commercial sector played a significant role Naver has the largest share in South Korea. Therefore, the results
in COVID-19 network information, and the connection of the of different search engines in individual regions may somewhat
nonprofit sector was relatively low. In fact, in the event of major vary from those of Bing. In addition, there is no ideal description
infectious diseases, school is an important aspect that cannot of the web network structure [47]. Search engine properties are
be ignored, and schools often gather dense populations [46]. considered as more engineering products than mathematical
The communication role of the education sector as an tools [48]. Different search engines often have divergent
information source is not stronger than that of business and algorithms and search results, which inevitably produce repeated
government sectors. However, as educational institutions learn and mixed results. Since search engines usually consider both
more than any other institutions about the actual school and quality and efficiency, this could also lead to problems related
education situation, they should take on more of a role than the to Type I and Type II errors, which objectively lead to
government and businesses to ensure the spread of information. insufficient coverage [48,49]. These can be considered as
In future infectious disease health events, education and industry limitations of the study.
organizations, along with others, need to release information
Conclusions
more quickly and accurately.
This study focused on the structure of information sources at
This study included an analysis of the quadruple helix structure each stage of the first 6 months of the COVID-19 pandemic
and the content of the three stages using dynamic progressive and the development of the network structure through the
detailed analysis. We carried out content analysis on 36,742 quadruple helix framework. We found that for public health
pieces of information in the three stages. The results of emergencies, some online and offline information sources were
frequency analysis showed that the most prominent information not sufficient. Diversified institutions need to pay attention to
in February was news about the pandemic. April was dominated public health emergencies, and actively respond to multihelical
by information about the public and the pandemic. The focus information sources, which is conducive to implementing a
in July was the use of various online services to solve problems timely and more comprehensive response to public health
caused by the pandemic. We then used CONCOR cluster emergencies. In terms of published messages, the educational
analysis to classify the topics in the three stages. The changes sector plays an important role in public health events. However,
in trends in the three stages were also sorted. The results educational institutions release less information than
indicated that in the early stages, there were more reports about governments and businesses. In addition, we summarized the
the affected areas, and the response of authorities such as
https://www.jmir.org/2021/8/e27681 J Med Internet Res 2021 | vol. 23 | iss. 8 | e27681 | p. 16
(page number not for citation purposes)
XSL• FO
RenderXJOURNAL OF MEDICAL INTERNET RESEARCH Zhu & Park
trend of COVID-19 online information dissemination. It is quadruple helix not only has theoretical significance in the
important to understand the communicational structure of scientific innovation field but can be also used to conduct
pandemic information sources worldwide. Currently, the effective research regarding web information. This is significant
quadruple helix model is primarily used in the field of scientific for further development of the quadruple helix model with
cooperation in terms of coauthorship analysis, and research in respect to the COVID-19 pandemic.
other fields is insufficient. This study highlights that the
Acknowledgments
This research is partially funded by the Foundation for Broadcast Culture (방송문화진흥회) in the Republic of Korea. The data
for February were analyzed and reported from a different scheme for a Korean-language journal. Since then, the data for April
and July have been compiled only for this study, as COVID-19 has rapidly become more serious over time.
Conflicts of Interest
None declared.
References
1. COVID-19 Dashboard. Center for Systems Science and Engineering (CSSE), Johns Hopkins University. URL: https:/
/gisanddata.maps.arcgis.com/apps/opsdashboard/index.html#/bda7594740fd40299%0A423467b48e9ecf6%0D [accessed
2021-01-07]
2. Kim J, Ashihara K. National disaster management system: COVID-19 case in Korea. Int J Environ Res Public Health 2020
Sep 14;17(18):e6691 [FREE Full text] [doi: 10.3390/ijerph17186691] [Medline: 32937946]
3. Horrigan JB. Information overload. Pew Research Center. 2016 Dec 07. URL: https://www.pewresearch.org/internet/2016/
12/07/information-overload [accessed 2021-01-06]
4. Park HW, Kim JE, Zhu YP. Online information sources of coronavirus using webometric big data. J Korea Acad Ind Coop
Soc 2020 Nov 30;21(11):728-739 In Korean. [doi: 10.5762/KAIS.2020.21.11.728]
5. Kink N, Hess T. Search engines as substitutes for traditional information sources? An investigation of media choice. Inf
Society 2008 Jan 14;24(1):18-29. [doi: 10.1080/01972240701771630]
6. Kitamura S. The relationship between use of the internet and traditional information sources. SAGE Open 2013 May
21;3(2):215824401348969. [doi: 10.1177/2158244013489690]
7. Han J, Cha M, Lee W. Anger contributes to the spread of COVID-19 misinformation. HKS Misinfo Rev 2020 Sep 17;1:1-14.
[doi: 10.37016/mr-2020-39]
8. Calvillo DP, Ross BJ, Garcia RJB, Smelter TJ, Rutchick AM. Political ideology predicts perceptions of the threat of
COVID-19 (and susceptibility to fake news about it). Soc Psychol Person Sci 2020 Jul 22;11(8):1119-1128. [doi:
10.1177/1948550620940539]
9. Marco-Franco JE, Pita-Barros P, Vivas-Orts D, González-de-Julián S, Vivas-Consuelo D. COVID-19, fake news, and
vaccines: should regulation be implemented? Int J Environ Res Public Health 2021 Jan 16;18(2):e744 [FREE Full text]
[doi: 10.3390/ijerph18020744] [Medline: 33467179]
10. Casero-Ripolles A. Impact of Covid-19 on the media system. Communicative and democratic consequences of news
consumption during the outbreak. EPI 2020 Apr 23;29(2):e290223. [doi: 10.3145/epi.2020.mar.23]
11. Park HW, Chung SW. Editor's note response to Friedman's "The world before corona and the world after": A perspective
raging from the development of civilization to the harmony of east and west, and the paradigm shift. J Contemp East Asia
2020 Dec 31;19(2):169-178. [doi: 10.17477/jcea.2020.19.2.169]
12. Chong M, Park HW. COVID-19 in the Twitterverse, from epidemic to pandemic: information-sharing behavior and Twitter
as an information carrier. Scientometrics 2021 Jun 23;126:1-25 [FREE Full text] [doi: 10.1007/s11192-021-04054-2]
[Medline: 34188332]
13. Kuchler T, Russel D, Stroebel J. JUE Insight: The geographic spread of COVID-19 correlates with the structure of social
networks as measured by Facebook. J Urban Econ 2021 Jan 9:103314. [doi: 10.1016/j.jue.2020.103314]
14. Li D, Ko N, Chen Y, Wang P, Chang Y, Yen C, et al. COVID-19-related factors associated with sleep disturbance and
suicidal thoughts among the Taiwanese public: a Facebook survey. Int J Environ Res Public Health 2020 Jun 22;17(12):e4479
[FREE Full text] [doi: 10.3390/ijerph17124479] [Medline: 32580433]
15. Xue J, Chen J, Hu R, Chen C, Zheng C, Su Y, et al. Twitter discussions and emotions about the COVID-19 pandemic:
machine learning approach. J Med Internet Res 2020 Nov 25;22(11):e20550 [FREE Full text] [doi: 10.2196/20550] [Medline:
33119535]
16. Cho SE, Park HW. Government organizations’ innovative use of the Internet: The case of the Twitter activity of South
Korea’s Ministry for Food, Agriculture, Forestry and Fisheries. Scientometrics 2011 Sep 28;90(1):9-23. [doi:
10.1007/s11192-011-0519-2]
17. Thelwall M. Does astronomy research become too dated for the public? Wikipedia citations to astronomy and astrophysics
journal articles 1996-2014. EPI 2016 Nov 14;25(6):893-900. [doi: 10.3145/epi.2016.nov.06]
https://www.jmir.org/2021/8/e27681 J Med Internet Res 2021 | vol. 23 | iss. 8 | e27681 | p. 17
(page number not for citation purposes)
XSL• FO
RenderXYou can also read