Differentiating Higher and Lower Job Performers in the Workplace Using Mobile Sensing - dartmouth cs
←
→
Page content transcription
If your browser does not render page correctly, please read the page content below
Differentiating Higher and Lower Job Performers in the Workplace
Using Mobile Sensing

SHAYAN MIRJAFARI, Dartmouth College, USA
KIZITO MASABA, Dartmouth College, USA
TED GROVER, University of California at Irvine, USA
WEICHEN WANG, Dartmouth College, USA
PINO AUDIA, Dartmouth College, USA
ANDREW T. CAMPBELL, Dartmouth College, USA
NITESH V. CHAWLA, University of Notre Dame, USA
VEDANT DAS SWAIN, Georgia Institute of Technology, USA
MUNMUN DE CHOUDHURY, Georgia Institute of Technology, USA
ANIND K. DEY, University of Washington, USA
SIDNEY K. D’MELLO, University of Colorado at Boulder, USA
GE GAO, University of California at Irvine, USA
JULIE M. GREGG, University of Colorado at Boulder, USA
KRITHIKA JAGANNATH, University of California at Irvine, USA
KAIFENG JIANG, Ohio State University, USA
SUWEN LIN, University of Notre Dame, USA
QIANG LIU, University of Texas at Austin, USA
GLORIA MARK, University of California at Irvine, USA
Authors’ addresses: Shayan Mirjafari, Dartmouth College, Hanover, NH, 03755, USA, shayan@cs.dartmouth.edu; Kizito Masaba, Dartmouth
College, Hanover, NH, 03755, USA; Ted Grover, University of California at Irvine, Irvine, CA, 92697, USA; Weichen Wang, Dartmouth College,
Hanover, NH, 03755, USA; Pino Audia, Dartmouth College, Hanover, NH, 03755, USA; Andrew T. Campbell, Dartmouth College, Hanover, NH,
03755, USA; Nitesh V. Chawla, University of Notre Dame, Notre Dame, IN, 46556, USA; Vedant Das Swain, Georgia Institute of Technology,
Atlanta, 30332, GA, USA; Munmun De Choudhury, Georgia Institute of Technology, USA, Atlanta, GA, 30332; Anind K. Dey, University of
Washington, Seattle, WA, 98195, USA; Sidney K. D’Mello, University of Colorado at Boulder, Boulder, CO, 80309, USA; Ge Gao, University of
California at Irvine, Irvine, CA, 92697, USA; Julie M. Gregg, University of Colorado at Boulder, Boulder, CO, 80309, USA; Krithika Jagannath,
University of California at Irvine, Irvine, CA, 92697, USA; Kaifeng Jiang, Ohio State University, Columbus, OH, 43210, USA; Suwen Lin,
University of Notre Dame, Notre Dame, IN, 46556, USA; Qiang Liu, University of Texas at Austin, Austin, TX, 78712, USA; Gloria Mark,
University of California at Irvine, Irvine, CA, 92697, USA; Gonzalo J. Martinez, University of Notre Dame, Notre Dame, IN, 46556, USA;
Stephen M. Mattingly, University of Notre Dame, Notre Dame, IN, 46556, USA; Edward Moskal, University of Notre Dame, Notre Dame,
IN, 46556, USA; Raghu Mulukutla, Carnegie Mellon University, Pittsburgh, PA, 15213, USA; Subigya Nepal, Dartmouth College, Hanover,                  37
NH, 03755, USA; Kari Nies, University of California at Irvine, Irvine, CA, 92697, USA; Manikanta D. Reddy, Georgia Institute of Technology,
Atlanta, GA, 30332, USA; Pablo Robles-Granda, University of Notre Dame, Notre Dame, IN, 46556, USA; Koustuv Saha, Georgia Institute of
Technology, Atlanta, GA, 30332, USA; Anusha Sirigiri, Dartmouth College, Hanover, NH, 03755, USA; Aaron Striegel, University of Notre
Dame, Notre Dame, IN, 46556, USA.

Permission to make digital or hard copies of all or part of this work for personal or classroom use is granted without fee provided that
copies are not made or distributed for profit or commercial advantage and that copies bear this notice and the full citation on the first
page. Copyrights for components of this work owned by others than ACM must be honored. Abstracting with credit is permitted. To copy
otherwise, or republish, to post on servers or to redistribute to lists, requires prior specific permission and/or a fee. Request permissions from
permissions@acm.org.
© 2019 Association for Computing Machinery.
2474-9567/2019/6-ART37 $15.00
https://doi.org/10.1145/3328908

                              Proc. ACM Interact. Mob. Wearable Ubiquitous Technol., Vol. 3, No. 2, Article 37. Publication date: June 2019.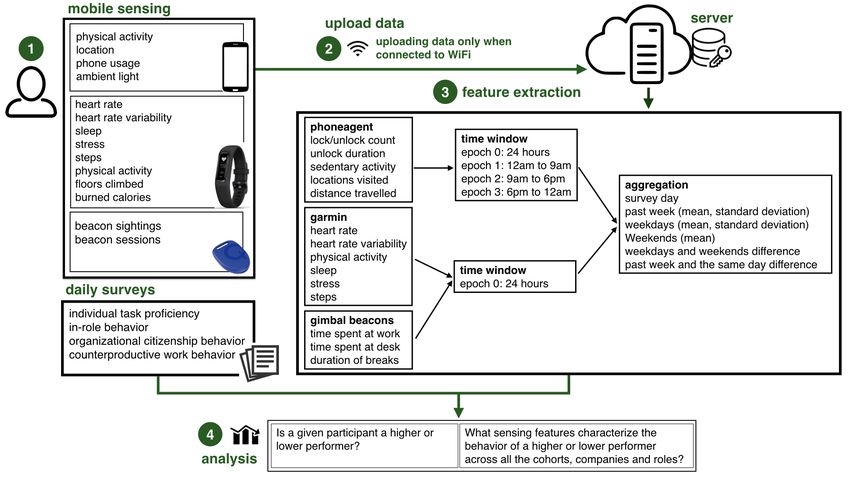
37:2    • S. Mirjafari et al.

GONZALO J. MARTINEZ, University of Notre Dame, USA
STEPHEN M. MATTINGLY, University of Notre Dame, USA
EDWARD MOSKAL, University of Notre Dame, USA
RAGHU MULUKUTLA, Carnegie Mellon University, USA
SUBIGYA NEPAL, Dartmouth College, USA
KARI NIES, University of California at Irvine, USA
MANIKANTA D. REDDY, Georgia Institute of Technology, USA
PABLO ROBLES-GRANDA, University of Notre Dame, USA
KOUSTUV SAHA, Georgia Institute of Technology, USA
ANUSHA SIRIGIRI, Dartmouth College, USA
AARON STRIEGEL, University of Notre Dame, USA
Assessing performance in the workplace typically relies on subjective evaluations, such as, peer ratings, supervisor ratings and
self assessments, which are manual, burdensome and potentially biased. We use objective mobile sensing data from phones,
wearables and beacons to study workplace performance and offer new insights into behavioral patterns that distinguish higher
and lower performers when considering roles in companies (i.e., supervisors and non-supervisors) and different types of
companies (i.e., high tech and consultancy). We present initial results from an ongoing year-long study of N=554 information
workers collected over a period ranging from 2-8.5 months. We train a gradient boosting classifier that can classify workers
as higher or lower performers with AUROC of 0.83. Our work opens the way to new forms of passive objective assessment
and feedback to workers to potentially provide week by week or quarter by quarter guidance in the workplace.
CCS Concepts: • Human-centered computing → Ubiquitous and mobile computing; • Applied computing;

Additional Key Words and Phrases: mobile sensing, workplace performance, mobile behavioral pattern
ACM Reference Format:
Shayan Mirjafari, Kizito Masaba, Ted Grover, Weichen Wang, Pino Audia, Andrew T. Campbell, Nitesh V. Chawla, Vedant
Das Swain, Munmun De Choudhury, Anind K. Dey, Sidney K. D’Mello, Ge Gao, Julie M. Gregg, Krithika Jagannath, Kaifeng
Jiang, Suwen Lin, Qiang Liu, Gloria Mark, Gonzalo J. Martinez, Stephen M. Mattingly, Edward Moskal, Raghu Mulukutla,
Subigya Nepal, Kari Nies, Manikanta D. Reddy, Pablo Robles-Granda, Koustuv Saha, Anusha Sirigiri, and Aaron Striegel. 2019.
Differentiating Higher and Lower Job Performers in the Workplace Using Mobile Sensing. Proc. ACM Interact. Mob. Wearable
Ubiquitous Technol. 3, 2, Article 37 (June 2019), 24 pages. https://doi.org/10.1145/3328908

1   INTRODUCTION
The increasing use of mobile sensing, machine learning and data analytics is offering new insights into health
[3, 74], lifestyle [79], personality [16, 68, 75], cognition [78], and other human behaviors and traits [19, 27].
This passively collected sensor data from phones and wearables, while still in its early stages of research and
development, holds the promise to significantly advance a broad spectrum of areas from precision medicine,
advances in public health, to how we exercise, work and interact with each other on a daily basis. In this
paper, we propose the application of mobile sensing to study workplace performance [40, 43]. Today, assessing
workplace performance typically relies on subjective input such as peer ratings, supervisor ratings and self-
reported assessments, which are manual, burdensome, potentially biased and unreliable. We propose a radically
new approach to evaluating workplace performance using mobile sensing from phones, wearables and beacons.
The use of unobtrusive assessments embedded in the work environment can produce a more objective measure
of performance offering a better understanding of the workplace environment and the workforce both inside and
outside of work. Specifically, we present new insights and initial results from an on-going year long study into
behavioral patterns that distinguish higher and lower performers across different industries.

Proc. ACM Interact. Mob. Wearable Ubiquitous Technol., Vol. 3, No. 2, Article 37. Publication date: June 2019.
Differentiating Higher and Lower Job Performers in the Workplace Using Mobile Sensing                           •    37:3

   In [56, 60], the authors define workplace performance broadly as a multidimensional construct indicating how
well workers and employees perform their tasks, the initiative they take and the resourcefulness they show in solving
problems. A good workplace performer is one who is well aware of his or her role in the organization, and
executes the underlying tasks and role well. The former behavior is termed in-role behavior [8, 70, 77] and
the latter, individual task proficiency [8, 25, 70]. We can also think of a good performer as a good team player
who helps colleagues in activities that contribute to the achievement of the overall objectives and goals of the
organization, and one who is mindful of protecting the values and interests of the organization. Researchers
[17, 18, 49, 50] describe this behavior as organizational citizenship behavior, and its opposite as counterproductive
work behavior [11, 18, 58].
   While many companies assess workers using different methods including self-reports, peer reviews or su-
pervisor reports – and these may differ across different industries (e.g., tech, government, financial services), it
is accepted that workplace performance [8, 70] can be assessed across four different dimensions: (1) individual
task proficiency (ITP) [8, 25], which is proficiency at performing activities that contribute to transforming an
organization’s technical core, where the term technical core refers to the transformation of raw materials (objects,
thoughts, or actions) into organizational products; (2) in-role behavior (IRB) [8, 77], which is the behavior required
by an employee to accomplish their duties in an organization; (3) organizational citizenship behavior (OCB) [17, 18],
which is the positive voluntary activity or behavior demonstrated by an employee, not necessarily recognized
by the employer but it promotes the effective functioning of the organization; and finally, (4) counterproductive
work behavior (CWB) [18, 58], which is the behavior demonstrated by an employee, that negatively affects the
well-being of a company.
   Many factors impact performance, making its assessment complex. In addition to personality, there are several
cognitive states, behaviors and habits which impact performance at work. One factor, for example, is sleep. A
study [41] of information workers found that the combination of less sleep and strong deadline pressure felt by
workers leads to a longer focus duration while using their workplace computers. In another study of college
students, researchers [42] found that cumulative hours of sleep loss with respect to the subject-specific daily
need for sleep [69] is associated with more productivity. However, it was also found to be associated with shorter
focus duration on their personal computers and smartphones and a proclivity to spend more time on social media.
Other factors include stress, affect and anxiety. Research [30] found that a moderate amount of stress for example
can help prolong focus and block distractions. However, in the workplace, high levels of stress are shown [41] to
be associated with the reduced ability to focus. Other habits such as engaging in physical exercise or the use
of alcohol, are reported as factors that affect performance in positive and negative ways, respectively. Figure 1
captures many of these factors as part of a multidimensional construct for workplace performance.
   Factors affecting workplace performance have been previously studied [4, 6, 35, 60] using analyses of self-
reported data where workers in organizations are asked to assess themselves against certain well established
performance metrics. However, as reported in [5, 22, 60], data collected using this approach alone is prone to
individual bias. Although these methods combined with bias correcting techniques [16, 24] and domain knowledge
are useful in studies of workplace performance, there is a need for new research into more objective, unobtrusive
and reliable methods. In this paper, we argue that passive sensor data from mobile devices and predictive analytics
offers a novel approach to exploring workplace performance in a more objective manner. To the best of our
knowledge our study represents the first time that mobile sensing data from phones, wearables and beacons is
used to classify higher and lower performers across different industries. It provides a proof of concept of the
use of mobile sensing in the workplace, identifies new insights into patterns that distinguish higher and lower
performers, and ultimately opens the way to new forms of passive objective assessment and feedback to workers
to provide day to day and week by week guidance. Specifically, the contributions of this paper are as follows:

                        Proc. ACM Interact. Mob. Wearable Ubiquitous Technol., Vol. 3, No. 2, Article 37. Publication date: June 2019.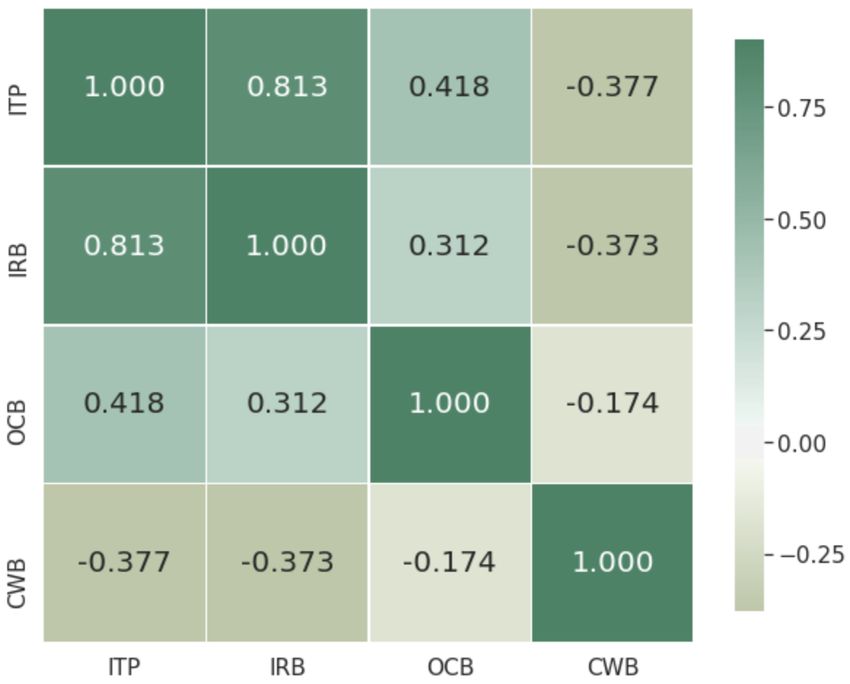
37:4    • S. Mirjafari et al.

    • We collect a passive sensing data set from N=554 recruited participants’ smartphones (i.e., Android and iOS),
      wearables (i.e., Garmin vivosmart) and bluetooth beacons inside and outside of the workplace. The cohort
      comprises three major sub cohorts: workers (N=138) at a midsize technology company, workers (N=217)
      from a consultancy company and finally a group we call “others” (N=199) that represent a collection of
      workers associated with universities (e.g., researchers) and small labs. Data is collected from workers over
      a period ranging from 2-8.5 months.
    • We design a set of features which capture the mobility, activity, phone usage, physiological signals and
      movement within the workplace. Participants answer a wide range of self-reported surveys administered
      at the start of the study and a set periodically (i.e., 3 times per week) administered (e.g., ITP [8, 25], IRB
      [8, 77], OCB [17, 18], CWB [18, 58]) over the first two months of the study. Note, we only consider the job
      performance metrics (i.e., ITP, IRB, OCB, CWB) and health factors (e.g., heart rate, sleep) in our analysis
      and not the broader psychological factors (e.g., personality, affect, cognitive ability) shown in Figure 1.
      Considering these additional factors is part of our future work.
    • We demonstrate that we can group information workers into higher and lower performers based on the
      four metrics of workplace performance (i.e., ITP, IRB, OCB and CWB).
    • We identify sensing features which are significantly different between higher and lower performers with the
      goal of uncovering behavioral patterns associated with high performance in the workplace. In addition, we
      identify different patterns for higher/lower performance across different subgroups: for example, between
      supervisors and non-supervisors, and between employees of a consulting company and a tech company.
    • We train a classifier to classify employees as higher or lower performers using their past week’s mobile
      sensing features. The AUROC [23] of the trained model is 0.83. The model’s precision for predicting higher
      and lower performers is 0.71 and 0.8, respectively, when the prediction model’s threshold of the probability
      of occurrence is 0.65. The recall for predicting higher and lower performers is 0.84 and 0.64, respectively,
      for the same threshold.

2   RELATED WORK
There is a growing interest in studying workplace performance. New programs in the USA include the IARPA
MOSAIC program [31, 44] that is studying new approaches to unobtrusive, passive and persistent measurement to
predict an individual’s job performance, and the NSF future of work program [48] that aims to advance cognitive
and physical capabilities at work.
   Most of the existing literature related to workplace performance relies on various types of self-reports and
supervisory evaluations [6, 10, 65, 66]. Some of the earliest work [10] uses archival records, rating scales and job
knowledge tests for job performance assessment. Sonnentag et al [65] report that performance ratings are the most
widely used measure of assessment. Performance ratings often include a combination of peer ratings, supervisor
ratings and self assessments. Some of the more objective methods being used are sales figures, production records,
and lines of code written, but these metrics have drawbacks [10].
   There is growing work [6, 21, 59, 66] on personality and its relationship to workplace performance. However,
this work as a whole sometimes presents conflicting findings and views. Some researchers [6, 66] find that the
only important personality trait associated with workplace performance is conscientiousness. While others
show that extraversion and emotional stability [21] are important. Furthermore, other researchers [59] argue
a combination of traits is important. In [29] the authors claim that there is bias toward a particular behavior
due to the inclination of employees to associate themselves with a certain personality trait seen as ideal to their
employers.
   Mobile sensing is demonstrating promise across a number of areas including understanding lifestyles [38, 79],
diagnosing disease [63], determining cognitive states of workers [61], studying human mobility patterns [9], and

Proc. ACM Interact. Mob. Wearable Ubiquitous Technol., Vol. 3, No. 2, Article 37. Publication date: June 2019.
Differentiating Higher and Lower Job Performers in the Workplace Using Mobile Sensing • 37:5
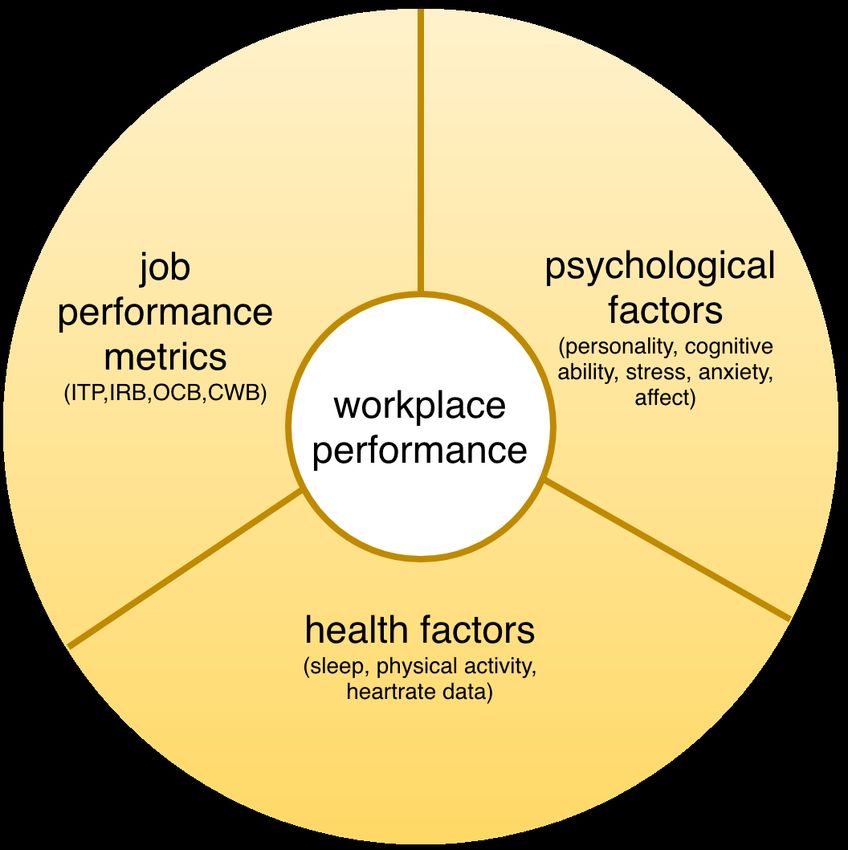
Fig. 1. Multidimensional construct for workplace performance. Note, we only consider the job performance metrics (i.e., ITP
[8, 25], IRB [8, 77], OCB [17, 18], CWB [18, 58] – as ground-truth) and health factors (e.g., heart rate, physical activity, sleep,
etc. – as independent variables) and not the broader psychological factors (e.g., personality, affect, cognitive ability).
even predicting student academic performance [73]. Schaule et al. [61] present how office workers’ cognitive
load can be detected using physiological data from wearables. They demonstrate that physiological data relates
to mental state and can determine when a person is busy and intellectually invested in their work [61]. In [73],
the authors use the StudentLife app [72] to study academic performance showing that variation in conversation
duration of students and the time spent studying are strong predictors of academic performance across the
semester. The StudentLife study [72] also found that conscientiousness is the primary trait positively related to
academic performance in college students. This is consistent with the findings of Higgins et al. [29] who conclude
that both academic and job performance are influenced by conscientiousness.
Prior work in applied psychology, management studies and organizational behavior investigate how the four
performance dimensions (i.e., ITP, IRB, OCB and CWB) we adopt in our study relate to a wide variety of different
individual and group-level outcomes in organizations [20, 26, 33, 36, 53, 57, 76]. In addition, researchers show
how these performance dimensions differ across a range of different demographic and individual traits (e.g., age,
gender, personality, emotional intelligence) [15, 47, 51]. Prior research investigates the relationship between
supervisors’ overall ratings of employee performance [33, 36, 53, 57], allocation of reward [1] and employee
turnover [14]. This body of research also investigates the relationship between OCB and CWB on the performance
of business units (i.e., different sub-groups) within an organization [20, 54]. However, little is known about the
daily real-world behaviors that separate higher and lower performers in companies. In our work, we aim to
shed light on behavioral patterns that characterize higher and lower performers across various performance
dimensions (viz. ITP, IRB, OCB and CWB) using mobile sensing methods, machine learning and predictive
analytics. Mobile sensing methods offer the promise of unprecedented continuous assessment to study workplace
behavior unobtrusively and objectively across daily, weekly, monthly, quarterly and yearly timescales.
3 METHODOLOGY
In what follows, briefly discuss our study set up, ground-truth, our mobile sensing and data collection system
and feature extraction.
Proc. ACM Interact. Mob. Wearable Ubiquitous Technol., Vol. 3, No. 2, Article 37. Publication date: June 2019.37:6 • S. Mirjafari et al.
Table 1. Demographics of the participants across each cohort
Cohort Male Female Total
A 109 108 217
B 112 26 138
C 15 6 21
D 72 75 147
E 12 19 31
Total 320 234 554
3.1 Study Design
Between early spring and late summer of 2018, we recruited 554 working professionals who live and work in the
United States as part of a large scale longitudinal research study. Each worker agreed to participate in our study
for a period of one year. As shown in Table 1, 217 participants work for a multinational consultancy company
A, 138 work for a multinational technology company B, 21 work for a local software company C, 147 work for
various smaller companies (which we collectively call group D), and finally, 31 work for a local university E. It
is important to note that some of the workforce in company A work at different branches within the country,
whereas the other groups work at their company headquarters. Among the participants in our study, 254 report
holding a supervisory position in their company, 297 report holding non-supervisory position and 3 participants
declined to mention their position in their companies.
For cohorts A, B and C, we established partnerships with the organizations who advertised the study to
their employees. Workers have the option to either participate or not in the study. Those who join the study
receive $750 for participating. The final amount of compensation varies depending on compliance levels, which is
measured in terms of the average percentage of daily data streams collected from the participant. The minimum
compliance percentage to earn the full amount is 80%. Furthermore, this amount is paid out in installments across
the study period following a specific schedule with the goal of keeping people in the year-long study. Participants
in cohorts D and E join the study through direct recruitment.
This study is conducted in accordance with the Institutional Review Board (IRB), an institution which protects
the rights and welfare of human research subjects.
3.2 Ground Truth
Workplace performance is multifaceted and each dimension is composed of unique factors that influence it, as
illustrated in Figure 1. For this reason, we use a number of gold standard questionnaires to collect data about
each of these factors. The questionnaires are grouped into three categories: 1) job performance surveys, 2) a
personality survey and 3) health surveys. We only consider the job performance surveys as ground truth in
this paper, as shown in Table 2. We administer a battery of surveys at the beginning of the study period and
periodically over the first 60 days of this year-long study. The job performance questionnaires are ITP [8, 25],
IRB [8, 77], OCB [17, 18], CWB [18, 58]. The ITP survey is scored from 3 to 15, the IRB is scored from 7 to 49
and both the OCB and CWB surveys are scored from 0 to 8. A high value of ITP, IRB or OCB indicates higher
performance, whereas a higher value of CWB indicates lower performance. Every participant in the study is
required to respond to a set of periodic shorter self-reports (3 times per week – we call these the survey days)
during the first 60 days of the study, as shown in Table 2.
Proc. ACM Interact. Mob. Wearable Ubiquitous Technol., Vol. 3, No. 2, Article 37. Publication date: June 2019.Differentiating Higher and Lower Job Performers in the Workplace Using Mobile Sensing • 37:7
Table 2. Performance surveys: (1) individual task proficiency (ITP), which is proficiency at performing activities that contribute
to transforming an organization’s technical core, where the term technical core refers to the transformation of raw materials
(objects, thoughts, or actions) into organizational products; (2) in-role behavior (IRB), which is the behavior required by an
employee to accomplish their duties in an organization; (3) organizational citizenship behavior (OCB), which is the positive
voluntary activity or behavior demonstrated by an employee, not necessarily recognized by the employer but it promotes
the effective functioning of the organization; and finally (4) counterproductive work behavior (CWB), which is the behavior
demonstrated by an employee, that negatively affects the well-being of a company.
Survey Items Answer Choices
Response scale:
Please indicate how often you carried out these three behaviors today 1 (Very little)
1. Carried out the core parts of your job well 2 (Somewhat)
ITP
2. Completed your core tasks well using the standard procedures 3 (Moderately)
3. Ensured your tasks were completed properly 4 (Considerably)
5 (A great deal)
Please indicate your level of agreement with whether you...
Response scale:
1. Adequately completed your assigned duties
1 (Strongly disagree)
2. Fulfilled responsibilities specified in your job description
2 (Moderately disagree)
3. Performed tasks that are expected of you
3 (Slightly disagree)
IRB 4. Met formal performance requirements of your job
4 (Neutral)
5. Engaged in activities that will directly affect your performance
5 (Slightly agree)
evaluation
6 (Moderately agree)
6. Neglected aspects of the job you are obligated to perform
7 (Strongly agree)
7. Failed to perform essential duties
Today, I...
1. Went out of my way to be a good employee
2. Was respectful of other people’s needs
3. Displayed loyalty to my organization
Response scale:
OCB 4. Praised or encouraged someone
Yes/No
5. Volunteered to do something that was not required
6. Showed genuine concern for others
7. Tried to uphold the values of my organization
8. Tried to be considerate to others
Today, I...
1. Spent time on tasks unrelated to work
2. Gossiped about people at my organization
3. Did not work to the best of my ability
Response scale:
CWB 4. Said or did something that was unpleasant
Yes/No
5. Did not fully comply with a supervisor’s instructions
6. Behaved in an unfriendly manner
7. Spoke poorly about my organization to others
8. Talked badly about people behind their backs
Proc. ACM Interact. Mob. Wearable Ubiquitous Technol., Vol. 3, No. 2, Article 37. Publication date: June 2019.37:8 • S. Mirjafari et al. 3.3 Data Collection: The Mobile Sensing System Figure 2 illustrates the data collection and feature extraction process, which includes continuous sensing tools running on phones, wearables, beacons and backend servers for data collection and predictive analysis of workplace performance. The mobile sensing system is based on the StudentLife [72] data collection system. We continuously and passively collect mobile sensing data from participants’ Apple and Android phones, Garmin wearables and beacons. The data is regularly uploaded and stored in our backend server databases. The mobile sensing system collects physiological, behavioral and mobility data from each participant in the study – all the sensing data is collected passively with no user interaction or burden. During enrollment each participant: 1) installs a data collection app on their phone called the PhoneAgent; 2) wears a Garmin vivosmart 3 wristband [37] which is paired with the PhoneAgent app on the phone in order to stream wearable data to the phone. Note, the Garmin typically lasts 4-5 days between charges in comparison to smartwatches that typically need to be charged each day – this significantly reduces the user burden to collect 24/7 wearable data; and 3) places one Gimbal bluetooth beacon [32] on their office desk and another near the entrance to their home. Participants are also asked to carry two mobile beacons on their person at all times – one in their wallet/bag and another on their keychain. The data collected from the PhoneAgent, wearable and beacons is summarized in Table 3. In what follows, we discuss each component of our continuous sensing collection system. 3.3.1 The Phone App: PhoneAgent. We develop the PhoneAgent, an app for the phone that tracks the participant’s physical activity, location, phone usage (e.g., lock/unlock) and ambient light levels. This app runs in the background of Android and iOS smartphones to passively collect sensor data. The data is written to a file as a JSON object and uploaded to a server whenever the phone is connected to WiFi. The PhoneAgent app connects to the Garmin wearable and Gimbal beacons via bluetooth. The Garmin vivosmart 3 wearable streams real-time heartrate (HR), heartrate variability (HRV), floors climbed, steps, and calories burned data to the PhoneAgent over bluetooth. We stream this real-time data off the wearable to the PhoneAgent because in this way we get much finer grained data than the Garmin backend server provides to users. 3.3.2 The Wearable: Garmin Vivosmart 3. The Garmin vivosmart 3 wristband [37] is a commercial wearable and is mostly used for fitness monitoring, wellness monitoring and activity tracking. It periodically collects physiological data such as heartrate, heartrate variability and stress (which is a proprietary black box inference provided by Garmin). The Garmin (note, when we use the term wearable we mean Garmin) also captures sleep quality including the duration of light sleep, deep sleep, REM sleep and entire sleep time. The Garmin also allows users to input their weight, and automatically computes step count, calories burned, number of floors climbed and physical activity (e.g., walking, running, etc.) [37]. Participants are required to pair the Garmin with the PhoneAgent app on the phone via bluetooth. In addition, participants pair the Garmin with the off-the-shelf Garmin Connect app whose APIs provide access to the sleep data and daily summaries of other sensing streams described above. We periodically pull this data and store it in our database. These daily summaries (e.g., heartrate, physical activity and stress, etc.) are augmented with the finer grained sensor data that is streamed to the PhoneAgent, as discussed above. 3.3.3 The Beacons: Gimbals. We use static Gimbal beacons [32] to study time spent at the office and home as well as breaks taken away from a participant’s desk. Beacons are low energy radio modules that transmit and receive radio signals to and from other bluetooth enabled devices [32]. The PhoneAgent app on the phone implements a Gimbal API library that enables the phone to detect encounters with beacons. To understand the protocol, consider smartphone A and beacon B. When A approaches B, A will receive the signal transmitted by B and report its signal strength. Generally, this signal strength increases as A and B are closer to each other. In this way, we can capture the mobility of participants at work. All encounter instances are logged by the PhoneAgent and uploaded to the server. A copy of these interactions is also saved on Gimbal servers and accessible through the Proc. ACM Interact. Mob. Wearable Ubiquitous Technol., Vol. 3, No. 2, Article 37. Publication date: June 2019.
Differentiating Higher and Lower Job Performers in the Workplace Using Mobile Sensing                            •    37:9

Fig. 2. We continuously collect passive sensing data from Android and Apple iOS smartphones, physiological data from
Garmin Vivosmart 3, as well as sightings of Gimbal beacons. The sensor data is uploaded to the server using WiFi. We then
compute features and study associations between the features and the self-reported performance.

Gimbal Server APIs [32]. In this paper, we only consider the time spent at their desk and the total time spent at
work. We also consider “breaks” from the desk, which could be a meeting, or a work break for coffee, lunch, etc.

3.3.4 Dashboard. We compute the compliance rate for each participant based on whether we have collected
their data for each 30 minute time interval; that is, each day we have 48 time slots of 30 minutes duration to
check compliance. If we have data for a particular slot, we label it as 1, otherwise 0. We calculate a compliance
percentage of each participant for each day based on these 48 time slots. A study portal allows participants and
researchers to view compliance data. Participants can view compliance for different devices (e.g., PhoneAgent,
Garmin and Gimbal) and report any issues they encounter to researchers. Using the study portal, we monitor the
state of our sensing and data collection system. We find it helpful to stay in touch with participants to inform
them if we observe any problems with their compliance rates. Participants are paid a final amount at the end of
the study depending on their averaged compliance rate. The study has an overall compliance rate of 70% which
means we have data from all streams (i.e., PhoneAgent, Garmin and Gimbal) for at least 17 hours per day.

3.4   Features
The features used in this study are inspired by insights drawn from prior work on mobile sensing discussed
in the related work section. Given our understanding of the different factors affecting workplace performance
[41, 42, 73], we calculate a total of 296 features based on the sensor data from the PhoneAgent, Garmin wearable
and Gimbal beacons.

                         Proc. ACM Interact. Mob. Wearable Ubiquitous Technol., Vol. 3, No. 2, Article 37. Publication date: June 2019.
37:10 • S. Mirjafari et al.
Table 3. Sensing streams collected from participants and computed features
Sensing Device Feature Category Features *
Mobility Number of locations, total distance travelled **
PhoneAgent Activity Physical activity and sedentary duration **
Phone Usage Unlock duration, number of unlocks **
Heartrate Averaged heart rate/heart rate variability
Start/end and duration of sleep, duration of
Garmin Vivosmart 3
Sleep deep/REM/light sleep, duration of wake-ups during sleep
hours
Stress Duration of experienced stress levels (high/medium/low)
Steps Walking/running distance and duration, number of steps
Duration at work places, duration at their desk, number
Gimbal Beacons Behavior at work of times they leave their desk (for durations of 5, 15 and
30 minutes)
* For each feature we consider: (1) features on the survey day; (2) mean values across days of the
week, weekdays and weekends; (3) the standard deviation within a week across days; (4) the
difference between the survey day and past week; (5) the difference between weekdays and
weekends.
** We divide the day up into periods called epochs; epoch 0: 24 hours (whole day); epoch 1: 12am -
9am (night/early morning); epoch 2: 9am - 6pm (working hours); epoch 3: 6pm - 12am (evening)
Table 3 details the features we generate. Specifically, we extract aggregations of daily activity (e.g., sedentary
duration), mobility (e.g., distance travelled and number of locations visited) and phone usage (e.g., number of
lock/unlocks and unlocked duration) collected by the PhoneAgent. We consider various epochs for analysis
across a day: night/early morning (12am - 9am, when people usually sleep), day (9am - 6pm, when people likely
work) and evening (6pm - 12am, when people likely go home or visit other locations). We also consider a 24 hour
epoch for the complete day. We assume that behaviors associated with each epoch may affect job performance.
We also extract physiological data and other features from Garmin (e.g., heart rate, sleep, stress and steps, as
shown in Table 3). Research [62] has shown for example that heart rate and heart rate variability are associated
with self-regulatory strength, effort, fatigue and burnout, which relate to performance. Sleep quality is one of
the major factors that impact job performance. For example, the amount of sleep and daily variations of sleep
across periods of time (e.g., week) might be a good predictor of performance. Different stress levels may influence
performance. We therefore consider the stress level (e.g., low, medium and high) and its associated duration
inferred by the wearable – note, the Garmin analyzes the heart rate variability while the user is inactive to
determine the overall stress. Steps represent a proxy for engaging in physical exercise and may serve to influence
performance.
We also extract features that capture indoor location at work using beacon data. We are interested in the
following features that might directly reflect engagement at work:
• the time spent at work: captures the total duration a participant spends at work from the first sighting of
the beacon at the work place to the last sighting.
• the time spent at desk: captures the percentage of time a participant spends at their desk each day.
• the number of breaks taken away from the desk that exceed periods of 5, 15 and 30 minutes (identified by
the gaps in desk beacon sightings).
Proc. ACM Interact. Mob. Wearable Ubiquitous Technol., Vol. 3, No. 2, Article 37. Publication date: June 2019.Differentiating Higher and Lower Job Performers in the Workplace Using Mobile Sensing • 37:11
For each of the features mentioned above, we consider the features for the same day that the survey is
administered and during the entire past week. We also consider weekdays and weekends. We calculate the
standard deviation as a measurement of regularity during the week. Finally, we compute the changes between
weekdays and weekends, and between the day the survey is administered and the past week.
4 ANALYSIS
We analyze the participants’ performance metrics collected from the ground-truth survey measures (i.e., IRB,
ITP, OCB and CWB) and then group each participant as a lower or higher performer according to their averaged
(mean) performance scores using an unsupervised clustering method. We use a clustering algorithm to label
the responses due to the absence of any prior work studying job performance measurements from surveys
that defines cut-offs or thresholds indicating whether a worker is a higher or lower performer. We thus focus
on a relative performance measure that categorizes participants into two relative groups of higher and lower
performers. After identifying the performance group of each participant using a clustering method, we study
associations in behavioral sensing features associated with higher and lower performers taking into account their
work roles (i.e., supervisors versus non-supervisors). We categorize each participant as either higher or lower
Fig. 3. Correlations between the various workplace performance metrics. High ITP, IRB and OCB indicate higher performance
whereas high CWB indicates lower performance. As shown above, ITP and IRB are highly positively correlated, whereas
CWB is negatively correlated with ITP, IRB and OCB.
performer on survey days (that is, the day that a survey is administered). We identify common behaviors and
behavioral patterns that characterize performers across the first 60 days of the on-going year-long study where
we have ground truth assessments, namely, IRB, ITP, OCB and CWB self-reports. Questionnaires for each of
these performance measures are administered once every three days over the first 60 days. Because surveys can
be administered on any day of the week we ask users to respond to the question “Did you work today?” We only
consider responses for days where participants state they are working and not for days when they report they
are not working. Therefore, in most cases work days are during the common working week (Monday-Friday).
Some workers work weekends but the common case for the study cohorts is working Monday-Friday.
We apply the K-means clustering method [2] where we consider the performance metrics as features for
unsupervised clustering. We compute the mean of each metric (i.e., IRB, ITP, OCB and CWB) for every participant
Proc. ACM Interact. Mob. Wearable Ubiquitous Technol., Vol. 3, No. 2, Article 37. Publication date: June 2019.37:12 • S. Mirjafari et al.
Table 4. Statistics of job performance metrics
Job performance metrics Range Mean STD
ITP 3-15 12.55 2.53
IRB 7-49 42.79 6.93
OCB 0-8 6.82 1.39
CWB 0-8 1.09 1.11
and then use these means as features for the K-means algorithm – we normalize mean scores as the measures have
different ranges (see Table 4). After training the clustering model, 336 employees are deemed high performers
and 218 low performers. Figure 4 shows the labels (viz. higher or lower performance) assigned to participants
from the K-means algorithm. The K-means method is highly dependant on the initial centers to cluster the data
points. Therefore, we set two initial points as representatives of higher and lower performers. The initial center
for higher performers is a point with the maximum scores of ITP, IRB and OCB, and the minimum score of
CWB. Conversely, the initial point for lower performers is the one including the minimum scores of ITP, IRB
and OCB, and the maximum score of CWB. As shown in Table 2, ITP, IRB and OCB measure positive attributes
associated with performance - the higher the score, the higher the performance. However, CWB represents a
negative attribute associated with workplace performance - the higher the score, the lower the performance.
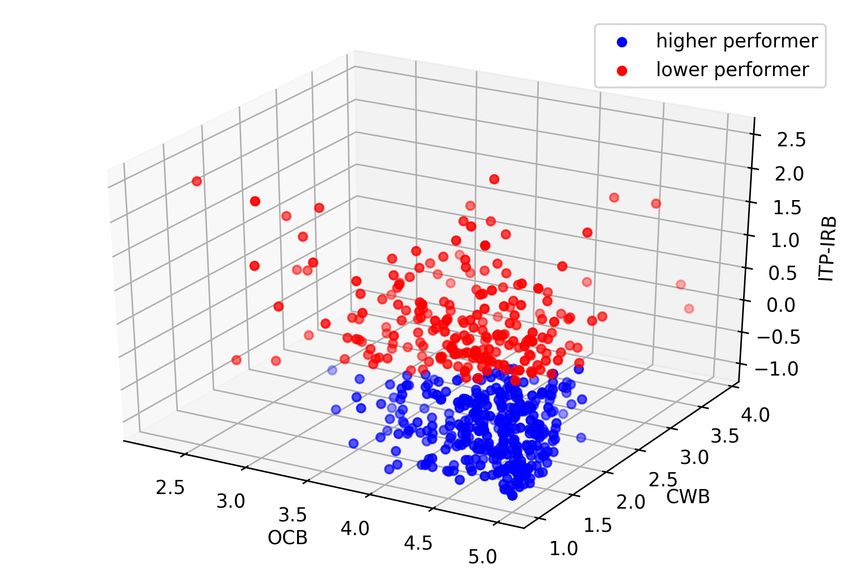
Fig. 4. Identification of participants as higher or lower performers. Blue dots represent higher performers. These participants
have relatively high IRB, ITP and OCB values and low CWB values. Red dots represent lower performers. The ITP and IRB
dimensions are reduced to one vector using principal component analysis (PCA) in order to visualize a 4D space in 3D. As
shown in the correlation matrix (see Figure 3), ITP and IRB are highly correlated, hence the principal component explains
over 90% of their 2D space variance. CWB is negatively correlated with both ITP and IRB. Therefore, a lower value on the
principal component’s axis demonstrates higher values of IRB and ITP.
Figure 5 shows histograms for the four performance dimensions (viz. IRB, ITP, OCB and CWB) across higher
and lower performers. Looking at the histograms of the metrics after clustering, we note that those assigned
Proc. ACM Interact. Mob. Wearable Ubiquitous Technol., Vol. 3, No. 2, Article 37. Publication date: June 2019.Differentiating Higher and Lower Job Performers in the Workplace Using Mobile Sensing • 37:13
as higher performers tend to have higher scores across all performance metrics other than CWB, particularly
for ITP and IRB. After training the unsupervised K-means model based on the averages of metrics discussed
earlier, we used this model to label ground-truth data points (i.e., higher or lower performance) corresponding
to particular survey days – we implement this labelling approach for two reasons: 1) ground-truth scores are
likely biased because they are self-reports, therefore, to reduce noise, we first run K-means on mean scores and
then label every single data point based on it; and 2) even if a worker is on average a higher performer, they
possibly have some days when they do not perform as well. As we run K-means on normalized mean scores,
we first normalize survey day scores using the mean and standard deviation of mean scores. Then, comparing
distances between scores of a survey and each of two centers of clusters, we identify whether a participant, on a
given survey day, is a higher or lower performer. In total, there are 6701 performance surveys from 554 partici-
pants. 4264 of these responses are clustered in the higher performers group and 2437 in the lower performers group.
5 RESULTS
In what follows, we present results associated with differences in behavioral patterns that distinguish higher
and lower performers. We then discuss the differences between supervisors and non-supervisors, and finally,
differences that exist between different types of companies in our study, as shown in Table 1.
5.1 Behavioral Patterns of Higher and Lower Performers
As discussed in Section 3.4, our sensing features capture aggregation of daily data for both the day the survey is
given on (aka the survey day – administered 3 times per week) and across the prior week excluding the survey
day. In order to look at significant features and their differences between higher and lower performers, we take
averages from the data points per participant (i.e., only one sample point for each participant in the dataset).
We apply the Spearman correlation [64] and the Kolmogorov-Smirnov (K-S) test [64]. The Spearman correlation
is a nonparametric measure to determine whether there is a monotonic relationship between two datasets. It
does not assume that both datasets are normally distributed. The two-sided K-S test is also a nonparametric
test that is useful to test if two independent samples are drawn from the same continuous distribution; it is also
known for comparing two sub-samples from the same population. All participants in our study are not from the
same company, but they are treated as the same population during training the K-means clustering model. We
include all participants in the analysis regardless of which company they work for. The result of the Spearman
correlation and the K-S test represents sensing features which are significant and different between average
higher and lower performers at the subject level. As shown in Table 5, all of the features are the result of the
Spearman correlation and the K-S statistical test where all p-values are less than 0.05.
5.2 Importance of Roles: Supervisors and Non-Supervisors
We are interested in identifying behavioral differences between higher and lower performers when considering job
roles within a company, specifically, differences between supervisors and non-supervisors. As part of enrollment,
participants complete an initial battery of surveys including job description in terms of whether they identify
themselves as a supervisor of other employees or not. Table 6 shows the significant different sensing features
for supervisors (N=254) and non-supervisors (N=297) for higher and lower performers. 165 supervisors are
identified as higher performers and 89 lower performers. 168 non-supervisors are higher performers and 129
lower performers. In total, there are 2864 job performance surveys responses from supervisors and 3826 from
non-supervisors. 1946 supervisors’ surveys are clustered as higher performers and 918 as lower performers. 2325
non-supervisors’ responses are grouped as higher performers and 1501 as lower performers.
Proc. ACM Interact. Mob. Wearable Ubiquitous Technol., Vol. 3, No. 2, Article 37. Publication date: June 2019.37:14 • S. Mirjafari et al. Fig. 5. Distribution of ITP, IRB, OCB and CWB within each performance group. All the performance metric scores are scaled for easy comparison. Row 1: Most higher performers have an ITP score ranging between 4.5 and 5.0, whereas most lower performers score between 3.0 and 4.5. Row 2: Most higher performers have an IRB score ranging from 4.5 to 5.0, whereas most lower performers score between 3.75 to 4.5. Row 3: most higher performers have an OCB score ranging between 4.5 and 5.0, whereas lower performers range from 4.0 to 4.5. Row 4: Most higher performers have a CWB score ranging between 1.0 to 1.6, whereas most lower performers score between 1.5 to 2.0 . Proc. ACM Interact. Mob. Wearable Ubiquitous Technol., Vol. 3, No. 2, Article 37. Publication date: June 2019.
Differentiating Higher and Lower Job Performers in the Workplace Using Mobile Sensing                            • 37:15

Table 5. Sensing features which are significantly different between higher and lower performers as the result of Spearman
correlation and K-S statistical test. In terms of epochs shown in the table: epoch 0: the whole day; epoch 1: 12am - 9am
(night/early morning); epoch 2: 9am - 6pm (working hours); epoch 3: 6pm - 12am (evening)

 Device            Feature                     Period/Epoch                          Behavior
                                                                          Higher performers unlock their
                   Number of times
 PhoneAgent                                    Survey day/3               phones less during the evening periods
                   unlocking the phone
                                                                          (6pm-12am) on survey days.
                   Duration of light                                      Higher performers have shorter light
                                               Weekends/0
                   sleep                                                  sleep periods during weekends.
                   Duration of deep                                       Higher performer have longer deep
                                               Survey day/0
 Garmin            sleep                                                  sleep periods during survey days.
                                                                          Higher performers have more regular
                   Variation in heart          Past week/0
                                                                          heart beat rates during the past week
                   beat rate                   Weekdays/0
                                                                          particularly weekdays.
                   Duration of awake                                      Higher performers have longer awake
                   time during sleep           Weekdays/0                 time periods during sleep hours on
                   hours                                                  weekdays.
                                                                          Higher performers are more physically
                   Amount of time
                                                                          active (i.e., the amount of time they are
                   being physically            Survey day vs. past week/0
                                                                          active) on survey days compared to
                   active
                                                                          any other day of the past week.
                                                                          Higher performers are more mobile
                                                                          (i.e., greater “step distance” in meters)
                   Step distance               Survey day vs. past week/0
                                                                          on survey days compared to any other
                                                                          day of the past week.
                                                                Spearman p-value < 0.05 K-S p-value < 0.05

5.3   Companies: Tech and Consultancy Firms
We investigate how features are significantly different between higher and lower performers among the two
largest cohorts in our study; these two companies represent different types of workforce: one being a tech
company and the other an international consultancy company. These companies might have different norms
and expectations associated with their workforce; for example, working hours, travel, communication protocols,
out-of-office availability, among many other factors [46]. Therefore it is prudent to also investigate how behaviors
of higher and lower performers may differ across these companies as case studies rather than drawing some
universal results for all tech and consultancy companies. Table 7 shows the behavioral patterns in terms of mobile
sensing features for each company. Company A (a consultancy company) has 217 employees participating in the
study. The clustering model considers 127 participants as higher performers and 90 as lower performers. We have
2319 responses from Company A’s participants. 1506 responses are from higher performers and 813 from lower
performers. Company B (a technology company) has 138 employees participating in the study. The clustering
model identifies 84 participants as higher performers and 54 participants as lower performers. We have 1926 job
surveys responses from company B’s participants. 1187 responses are from higher performers and 739 from low
performers.

                         Proc. ACM Interact. Mob. Wearable Ubiquitous Technol., Vol. 3, No. 2, Article 37. Publication date: June 2019.
37:16 • S. Mirjafari et al.
Table 6. Sensing features that demonstrate the patterns of higher performers for different job roles (viz. supervisor versus
non-supervisor) as the result of Spearman correlation and K-S statistical test.
Behavioral patterns attributed to higher performers in comparison to lower
Role
performers for different roles
PhoneAgent
Higher performers regularly visit a smaller number of places during working hours
(9am-6pm).
Garmin
Supervisor
Higher performers have shorter light sleep periods during the past week.
Higher performers have longer deep sleep duration on survey days.
Higher performers are more mobile (i.e., have greater step counts) during weekdays than
weekends.
PhoneAgent
Higher performers visit a smaller number of places during weekday evenings
(6pm-12am).
Higher performers are less active (i.e., based on their overall stationary duration) over
the past week particularly during weekday evenings (6pm-12am).
Higher performers unlock their phones fewer times on survey days and during weekend
evenings (6pm-12am).
Higher performers use their phone less (based on the overall period of unlock duration)
during weekday working hours (9am-6pm) than during the same period at the weekend.
Non-Supervisor
Garmin
Higher performers are more mobile (i.e., have greater step counts) on survey days.
Higher performers are more physically active (i.e., based on the amount of time they are
active) on survey days in comparison to any other day during the past week.
Higher performers have longer awake periods during sleep hours on weekdays.
Higher performers have more regular light sleep periods during sleep hours on
weekdays.
Beacon
Higher performers spend more time at work during weekends.
Spearman p-value < 0.05 K-S p-value < 0.05
5.4 Classification of Higher and Lower Performers
A key goal of our paper is to classify higher and lower performers using the mobile sensing features, as discussed
in Section 3.4. We aim to classify whether an information worker is on average a higher or lower performer based
on the observed weekly sensing features within a certain period of time. We study several different classification
models including support vector machine [12], logistic regression [52], random forest [7] and gradient boosting
[13]. The gradient boosting classifier outperforms all models. We use the XGBoost [13] classifier to implement
the gradient boosting technique. XGBoost is an optimized distributed gradient boosting library designed to be
highly efficient, flexible and portable. We train the classifier using five repetitions of 5-fold cross validation (CV).
The classifier’s parameters are tuned using another level of 5-fold cross validation on the training set of each fold.
Proc. ACM Interact. Mob. Wearable Ubiquitous Technol., Vol. 3, No. 2, Article 37. Publication date: June 2019.Differentiating Higher and Lower Job Performers in the Workplace Using Mobile Sensing • 37:17
Table 7. Sensing features that demonstrate the patterns of higher performers within different companies as the result of
Spearman correlation and K-S statistical test.
Behavioral patterns attributed to higher performers in comparison to lower
Company
performers for different types of companies
PhoneAgent
Higher performers have regular periods of being stationary (i.e., based on their overall
stationary duration) during evenings periods (6pm-12am) over the past week.
Higher performers are less active (i.e., based on their overall stationary duration) during
Company A
the evening periods (6pm-12am) on survey days compared to any other day of the past
(Consultancy)
week.
Garmin
Higher performers are less mobile (i.e., based on “step distance” in meters) during
weekends.
PhoneAgent
Higher performers are less active (i.e., based on their overall stationary duration) during
working hours (9am-6pm) and the evening periods (6pm-12am) over the past week.
Higher performers are less active (i.e., based on their overall stationary duration) during
weekdays than weekends.
Higher performers visit a fewer number of places during weekday night/early morning
Company B
periods (12am-9am).
(Tech)
Higher performers visit a greater number of places during weekday night/early morning
periods (12am-9am) than during the same period at the weekend.
Garmin
Higher performers have more regular periods of mobility (i.e., based on “step distance”
in meters) during weekdays.
Higher performers have shorter light sleep periods on survey days.
Spearman p-value < 0.05 K-S p-value < 0.05
Figure 6 shows the prediction model’s performance in terms of the AUROC, precision and recall scores for
higher and lower job performance labels. The evaluation metrics are all based on the majority vote technique
[34]. The aim of utilizing this technique is to specify whether a worker is on average a higher or lower performer
across the 60 day period. We use a 5-repetition 5-fold cross-validation training process on all data points at
the survey level (i.e., based on the individual survey data points rather than averages of all participants survey
data points). At each 5-fold cross-validation process, we first shuffle the data. Then, we run the K-means on
the averaged scores of the job measurements scores (viz. IRB, ITP, OCB and CWB) associated with participants
in the training set in order to get higher and lower clusters. Using these clusters, we label every single data
point in the validation set by comparing the distance between the point and centroids of clusters. We train the
classifier on the training set of the fold after finding the best parameters of the model through another level of
5-fold cross-validation on the training set using all the features discussed in Section 3.4. Finally, we classify the
data points in the testing set. After a 5-fold cross-validation is complete, we get all the predicted probabilities
returned by classifiers trained at each fold and identifying whether a data point is in the higher performer cluster
or the lower one for all data points of each participant. We therefore compute the mean probability for each
participant. We repeat the 5-fold cross-validation process five times. Therefore, we take an average of all the five
Proc. ACM Interact. Mob. Wearable Ubiquitous Technol., Vol. 3, No. 2, Article 37. Publication date: June 2019.37:18 • S. Mirjafari et al. mean probabilities for each participant. The averaged probability identifies whether a participant is on average a higher or lower performer. In addition, we determine whether a worker is on average a higher or lower performer for ground-truth, as discussed in Section 4. We report all the performance metrics (i.e., AUROC, precision and recall scores) in Figure 6. Specifically, we report the model’s performance metrics in terms of different thresholds of occurrence probability. The default threshold is set to 0.5 as the problem is a binary classification problem. Therefore, if the predicted probability for a participant is more than 0.5, then the worker is predicted to be a higher performer, otherwise we consider them a lower performer. We change this threshold to a value in the ranged 0-1 in steps of 0.05 [0,0.05,0.1,0.15,...,0.9,0.95,1]. For example, if the threshold is 0.65, then the probability that indicates a worker is on average a higher performer is a value of more than 0.65, otherwise we consider them a lower performer. The precision and recall curves (shown in Figure 6 (b) and (c), respectively) would be more detailed if the threshold changed with a smaller step (e.g., 0.01 [0,0.01,0.02,...,0.98,0.99,1]). However, the trend of the curves remains the same regardless of finer increments. Figure 6 (a) shows the AUROC curve is 0.83. Figure 6 (b) shows different model precision scores when classifying higher and lower job performers in terms of different thresholds of the occurrence probability. Figure 6 (c) shows different model recall scores when classifying higher and lower job performers in terms of different thresholds of the occurrence probability. We also report the model’s performance when the occurrence probability threshold is set to 0.65; in this case the precision and recall are 0.71 and 0.84, respectively, when predicting higher performers, and 0.8 and 0.64, respectively, when predicting lower performers. The F1 score at a threshold of 0.65 is 0.77 for higher performers and 0.71 for lower performers. We also train the model using different sensor modalities (i.e., phone and wearable) as features. Figure 7 (a) shows the ROC of the model’s performance when only using Garmin sensing features when training the model. 7 (b) shows the ROC of the model’s performance when only using PhoneAgent features when training the model. The AUROC scores for Garmin and PhoneAgent features are 0.72 and 0.65, respectively. 6 DISCUSSION AND LIMITATIONS In this section, we discuss our findings and limitations. As shown in Tables 5, 6 and 7, our results indicate that focus and regularity of behaviors and routines (e.g., phone usage, places visited, mobility, activity, sleep and time spent at work) across weekdays and weekends offer important insights into higher and lower performers. We find a number of interesting results associated with phone usage and higher performers. Higher performers tend to have lower rates of phone usage throughout the day based on the lock/unlock feature we compute. As shown in Table 6, higher performers who are non-supervisors unlock their phones fewer times on survey days (which are working days) and during weekend evening periods. In addition, these higher performers use their phone less during weekday working hours than during the same period at the weekend. As shown in Table 5, higher performers across all cohorts unlock their phones less during the evening periods on survey days. If we considered phone usage during working hours a distraction then this behavior would likely impact the performance of workers. However, research [45] shows that those who have a high level of commitment to work use mobile devices as a method for consistent and frequent communications with colleagues in work-related activities. A limitation of our results is that we do not have any additional information to indicate how phone usage relates to productivity. However, our results on phone usage of higher performers is a potentially important finding. Physical activity and mobility have been shown to boost memory [67], improve concentration [28] and enhance creativity [39]. Therefore, regular activity could positively impact performance helping workers focus better, be creative at work, relieve stress and retain information. The level of activity and mobility during the working week is also strongly coupled with job demands. For example, a software engineer in a tech company may spend most of their working week at a workstation while a project manager/ consultant may be much more mobile. Proc. ACM Interact. Mob. Wearable Ubiquitous Technol., Vol. 3, No. 2, Article 37. Publication date: June 2019.
You can also read