DISCUSSION PAPER SERIES - MANAGERIAL AND FINANCIAL BARRIERS TO THE NET-ZERO TRANSITION - Ralph De Haas
←
→
Page content transcription
If your browser does not render page correctly, please read the page content below

DISCUSSION PAPER SERIES

                   DP15886

     MANAGERIAL AND FINANCIAL
     BARRIERS TO THE NET-ZERO
           TRANSITION

 Ralph De Haas, Ralf Martin, Mirabelle Muûls and
              Helena Schweiger

           DEVELOPMENT ECONOMICS
             FINANCIAL ECONOMICS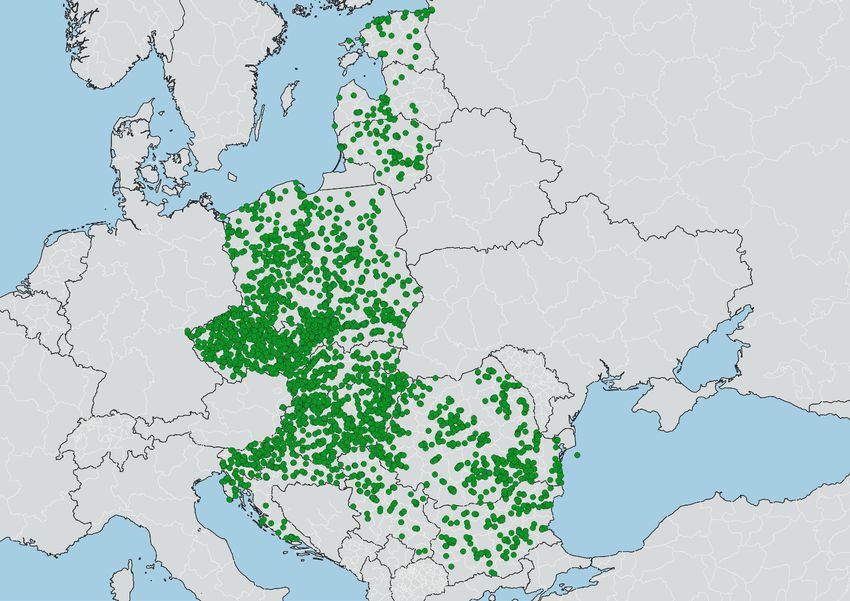
ISSN 0265-8003

 MANAGERIAL AND FINANCIAL BARRIERS TO THE
          NET-ZERO TRANSITION
              Ralph De Haas, Ralf Martin, Mirabelle Muûls and Helena Schweiger

                                  Discussion Paper DP15886
                                   Published 04 March 2021
                                   Submitted 02 March 2021

                             Centre for Economic Policy Research
                         33 Great Sutton Street, London EC1V 0DX, UK
                                   Tel: +44 (0)20 7183 8801
                                         www.cepr.org

This Discussion Paper is issued under the auspices of the Centre’s research programmes:

        Development Economics
        Financial Economics

Any opinions expressed here are those of the author(s) and not those of the Centre for Economic
Policy Research. Research disseminated by CEPR may include views on policy, but the Centre
itself takes no institutional policy positions.

The Centre for Economic Policy Research was established in 1983 as an educational charity, to
promote independent analysis and public discussion of open economies and the relations among
them. It is pluralist and non-partisan, bringing economic research to bear on the analysis of
medium- and long-run policy questions.

These Discussion Papers often represent preliminary or incomplete work, circulated to encourage
discussion and comment. Citation and use of such a paper should take account of its provisional
character.

Copyright: Ralph De Haas, Ralf Martin, Mirabelle Muûls and Helena Schweiger
MANAGERIAL AND FINANCIAL BARRIERS TO THE
NET-ZERO TRANSITION
Abstract
We use data on 11,233 firms across 22 emerging markets to analyse how credit constraints and
low-quality firm management inhibit corporate investment in green technologies. For identification,
we exploit quasi-exogenous variation in local credit conditions and in exposure to weather shocks.
Our results suggest that both financial frictions and managerial constraints slow down firm
investment in more energy efficient and less polluting technologies. Complementary analysis of
data from the European Pollutant Release and Transfer Register (E-PRTR) corroborates some of
this evidence by revealing that in areas where banks deleveraged more after the global financial
crisis, industrial facilities reduced their carbon emissions by less. On aggregate this kept local
emissions 15% above the level they would have been in the absence of financial frictions.
JEL Classification: D22, L23, G32, L20, Q52, Q53
Keywords: Financial Frictions, Management Practices, CO2 emissions, energy efficiency
Ralph De Haas - dehaasr@ebrd.com
EBRD, Tilburg University and CEPR
Ralf Martin - r.martin@imperial.ac.uk
Imperial College London, London School of Economics and CEPR
Mirabelle Muûls - m.muuls@imperial.ac.uk
Imperial College London
Helena Schweiger - schweigh@ebrd.com
EBRD
Acknowledgements
We thank Cevat Giray Aksoy, Pedro de Lima (discussant), Vasso Ioannidou (discussant), Hendrik Schuldt (discussant), Piotr
Spiewanowski, and seminar participants at the EBRD, ESRI (Dublin), the European Center for Advanced Research in Economics
and Statistics (ECARES) at the Université Libre de Bruxelles, EIB, the LSE-Imperial Business School `Workshop in Environmental
Economics', the 25th Annual Conference of the European Association of Environmental and Resource Economists, the 30th
Congress of the European Economic Association, and the 2020 International Workshop on Financial System Architecture &
Stability (Cass Business School) for helpful comments and discussions.
Powered by TCPDF (www.tcpdf.org)Managerial and Financial Barriers to the Net-Zero Transition
Ralph De Haas∗, Ralf Martin†, Mirabelle Muûls‡, and Helena Schweiger§¶
March 2, 2021
Abstract
We use data on 11,233 firms across 22 emerging markets to analyze how credit constraints and
low-quality firm management inhibit corporate investment in green technologies. For identifica-
tion we exploit quasi-exogenous variation in local credit conditions and in exposure to weather
shocks. Our results suggest that both financial frictions and managerial constraints slow down
firm investment in more energy efficient and less polluting technologies. Complementary analy-
sis of data from the European Pollutant Release and Transfer Register (E-PRTR) corroborates
some of this evidence by revealing that in areas where banks deleveraged more after the global fi-
nancial crisis, industrial facilities reduced their carbon emissions by less. On aggregate this kept
local emissions 15% above the level they would have been in the absence of financial frictions.
JEL classification: D22, L23, G32, L20, Q52, Q53
Keywords: Financial frictions, management practices, CO2 emissions, energy efficiency
∗
European Bank for Reconstruction and Development, CEPR, and Tilburg University. Email: dehaasr@ebrd.com
†
Imperial College Business School, Centre for Economic Performance and CEPR. Email: r.martin@imperial.ac.uk.
‡
Imperial College Business School and CEP. Email: m.muuls@imperial.ac.uk.
§
European Bank for Reconstruction and Development. Email: schweigh@ebrd.com.
¶
We thank Cevat Giray Aksoy, Pedro de Lima (discussant), Vasso Ioannidou (discussant), Hendrik Schuldt
(discussant), Piotr Śpiewanowski, and seminar participants at the EBRD, ESRI (Dublin), the European Center for
Advanced Research in Economics and Statistics (ECARES) at the Université Libre de Bruxelles, EIB, the LSE-
Imperial Business School ‘Workshop in Environmental Economics’, the 25th Annual Conference of the European
Association of Environmental and Resource Economists, the 30th Congress of the European Economic Association,
and the 2020 International Workshop on Financial System Architecture & Stability (Cass Business School) for helpful
comments and discussions. The views expressed in this paper are ours and not necessarily those of the EBRD.1 Introduction
The severe impact that climate change will have on future generations is becoming increasingly
clear. Droughts, extreme temperatures, floods, and storms all cause substantial human and financial
losses in the short term and ecological and economic costs in the longer run (Cavallo et al., 2013;
Felbermayr and Gröschl, 2014). There now exists incontrovertible evidence that carbon emissions
from industrial production are the principal cause of climate change (IPCC, 2019; Nordhaus, 2019).
In the absence of technologies to remove carbon dioxide from the biosphere, mitigating climate
change therefore requires a drastic reduction of carbon emissions (Pacala and Socolow, 2004).
For this reason, and in line with commitments under the Paris Climate Agreement, many
countries aim to produce zero net greenhouse gas emissions by 2050 at the latest. This green
transition requires large-scale corporate investment in cleaner technologies to reduce firms’ carbon
footprint. Yet, even if such green investments are optimal from a societal point of view, they
may not be cost-effective from the perspective of individual firms. And even if they are, organiza-
tional constraints—of either a financial or managerial nature—can prevent firms from investing in
green technologies that would benefit them. Firms not only differ in their ability to access exter-
nal funding, they also differ widely in terms of their management quality in general (Bloom and
Van Reenen, 2007) and their green management practices in particular (Martin, Muûls, de Preux
and Wagner, 2012). Those with better access to external funding and those with stronger green
management may then invest more in energy-efficient manufacturing technologies and, as a result,
cut greenhouse gas emissions more drastically as well.
Against this background, we exploit data on a representative sample of 11,233 firms across 22
emerging markets to analyze how financial and managerial constraints can hold back corporate
investment in the abatement of greenhouse gas emissions. Such firm-level constraints may hamper
green investments in poor countries in particular. A lack of external finance (Aghion et al., 2005;
Bircan and De Haas, 2020), deficient management practices (Bloom et al., 2013), and misaligned
incentives within the firm (Atkin et al., 2017) have all been shown to impede technological adoption
in the developing world. This is worrying because nearly all of the growth in energy demand
and greenhouse gas emissions over the next three decades will come from emerging markets and
developing countries (Wolfram et al., 2012). Green investments to reduce the carbon intensity of
1firm production are therefore most urgently needed in the poorest parts of the world.
Our data come from unique face-to-face surveys with firm managers. These surveys give us
access to information on firms’ credit constraints and on their organizational response to climate
change in the form of green management practices and green investments. In terms of green
management, we collect standardized data on firms’ strategic objectives concerning the environment
and climate change; whether there is a manager with an explicit mandate to deal with environmental
issues; and how the firm sets and monitors targets (if any) related to energy and water usage, CO2
emissions, and other pollutants. In terms of green investments, we collect data on investments
in the on-site generation of green energy; improvements in energy and water management; and
measures to control air pollution or to increase the energy efficiency of production lines.
We take two complementary approaches to identify the causal effect of financial and managerial
constraints on firms’ green investments. First, we control for a rich set of firm-level covariates that
might otherwise confound the relation between organizational constraints and green investments.
Second, we develop a three-pronged instrumentation strategy to isolate the plausibly exogenous
component of firm-level constraints. We first construct leave-one-out jackknife instruments that
reflect the managerial and credit constraints experienced by other firms in the same country and
region except for those in the same 2-digit industry. Second, we combine our firm-level data with
precise geo-coded information on the bank branches that surround each individual firm. This allows
us to create granular proxies for exogenous differences in local credit conditions in the aftermath of
the global financial crisis. Third, we measure firm managers’ exposure to extreme weather events
during the period 2000-15. We then use these instruments to allow for a causal interpretation of
the observed relationship between firms’ credit and managerial constraints, on the one hand, and
their green investment activity, on the other. Our IV results indicate that both credit constraints
and weak management slow down firms’ investments in green and carbon abatement technologies.
To our knowledge, our paper is the first to explicitly show this link.
If credit constraints and low-quality green management practices prevent firms from investing
in greener (more energy efficient) production processes, then one might expect that—perhaps with
some delay—they also slow down firms’ ability to reduce the emission of greenhouse gases and other
pollutants. We investigate this issue in the second part of the paper, using European Pollutant
Release and Transfer Register (E-PRTR) data on the change in greenhouse gas emissions and other
2air pollutants of a large number of Eastern European industrial facilities.
We use two approaches to uncover the relationship between credit constraints and the quality
of green management on the one hand, and air pollution on the other. Our first approach uses the
first stage of our earlier IV framework to construct average predicted values of the credit constraints
and managerial capabilities in the direct vicinity of E-PRTR facilities. We document a positive
(negative) relationship between regional credit constraints (management quality) and the emission
of air pollutants.
Our second approach is a difference-in-differences design in which we again exploit exogenous
variation in local credit conditions in the aftermath of the global financial crisis. Consistent with
our earlier results, we find that although there was a secular decline in carbon emissions during the
post-crisis decade, this decline was smaller in localities where banks had to deleverage more. That is,
credit constraints not only slowed firms’ green investments but they consequently also had a tangible
negative impact on firms’ ability to produce in a less polluting way. We thus provide evidence for
an important channel through which persistent negative environmental impacts of financial crises
may come about, namely credit constraints preventing firms from investing in measures that reduce
carbon emissions.
Our empirical analysis allows us to contribute to, and to connect, three strands of the literature.
First, we provide new insights into the determinants of corporate investment in carbon abatement
and energy efficiency.1 Because low-carbon technologies generate large environmental (and hence
social) returns while private profitability is often unclear, managerial adoption decisions may differ
from those of regular technologies. Empirical evidence on the diffusion of low-carbon technologies is
scarce (Burke et al., 2016) and we shed light on the comparative role of management and access to
finance in this regard. Bloom, Genakos, Martin and Sadun (2010) measure management practices
in over 300 manufacturing firms in the UK. They find that better managed firms are not only more
productive overall but also less energy and carbon intensive. Martin, Muûls, de Preux and Wagner
(2012) find similar results using a measure of specifically “green” management practices. One
interpretation of these results is that well-managed firms adopt modern manufacturing practices,
1
Hottenrott, Rexhauser and Veugelers (2016) provide an overview of the literature on the determinants of firm
investment in green technologies while Cagno, Worrell, Trianni and Pugliese (2013) propose a taxonomy of barriers
to industrial energy efficiency improvement. The adoption of energy efficient technologies remains low (Allcott and
Greenstone, 2012). As a result, as much as 44 percent of all reductions in global emissions by 2040 could come from
energy efficiency gains (International Energy Agency, 2017).
3which allows them to increase productivity by using energy more efficiently.2 Our contribution is
to provide direct evidence, based on a large cross-country firm-level data set, for a key mechanism
through which managerial constraints limit energy efficiency improvements in production: the
reduced incidence of investments in green technologies and carbon abatement.
Second, we provide micro evidence on how credit constraints hold back investments in carbon
abatement. Credit constrained firms cannot finance all economically viable projects available to
them, but instead need to allocate scarce funding to the projects with the highest expected net
present value. Earlier evidence shows that credit constraints matter and are responsible for re-
duced investment even in advanced economies with well-developed capital markets (Almeida and
Campello, 2007; Campello, Graham and Harvey, 2010; Duchin, Ozbas and Sensoy, 2010). Because
environmental investments often entail large upfront expenditures and have an uncertain cost-
savings potential, financially constrained firms may instead prioritize investments in core activities.3
This may occur in particular in firms with weaker green management where managers are more
biased against investments outside the main business activities.4
Related empirical work on the U.S. has shown a negative relationship between credit availability
and firm pollution, without actually observing firms’ green investments as an intermediary step
in the hypothesized causal chain. In particular, Levine, Lin, Wang and Xie (2018) show how
positive credit supply shocks in U.S. counties—due to fracking of shale oil in other counties—
reduce local air pollution. In a similar vein, Goetz (2019) finds that financially constrained firms
reduced toxic emissions when their capital cost decreased as a result of the U.S. Maturity Extension
Program. Lastly, Cohn and Deryugina (2018) document a negative relationship between U.S. firms’
contemporaneous and lagged cash flow and the occurrence of environmental spills. Our contribution
is to provide direct evidence, for a large sample of emerging markets, for an important underlying
2
Such firms may be better informed about the costs and benefits of energy efficiency improvements and suffer less
from present-biased preferences in which managers focus too much on upfront costs and too little on future recurring
energy savings (Allcott, Mullainathan and Taubinsky, 2014).
3
In line with this, Howell (2017) shows that firms that receive grant funding from the U.S. Small Business
Innovation Research Program generate more revenue and patent more (compared with similar but unsuccessful
applicants). These effects are largest for financially constrained firms and those in sectors related to clean energy and
energy efficiency.
4
When the cost of external capital is high, and investments in emissions reductions therefore expensive, firms
that are forced by environmental regulation to reduce carbon emissions may respond by moving their polluting
activities elsewhere instead of by investing in cleaner production. Bartram, Hou and Kim (2019) show how financially
constrained firms in California responded to the introduction of a state-level cap-and-trade program by shifting
emissions to their plants in other states.
4mechanism: credit constraints reduce firms’ investments in pollution abatement.
Third, we offer fresh evidence on the real economic consequences of financial crises. On the
one hand, episodes of dysfunction in the financial system can cut back pollution in the short term
simply because economic activity and energy usage decline (Sheldon, 2017; De Haas and Popov,
2019). Moreover, if crises mainly force inferior-technology and energy-inefficient firms to exit the
market, then the energy efficiency of the average surviving firm will improve.5 On the other hand,
longer-term impacts will be less benign if firms deprioritize adhering to environmental standards
and postpone or cancel investments in cleaner technologies (Peters et al., 2012).6 Indeed, Pacca,
Antonarakis, Schroder and Antoniades (2020) argue that financial crises may be “one step forward,
two steps back for air quality”. Our findings are clearly at odds with an environmentally cleansing
effect of financial crises. Instead, our analysis of rich cross-country micro-data shows how temporary
disruptions in the supply of external finance have long-lasting negative implications for the carbon
intensity of manufacturing.
The remainder of this paper is organized as follows. Section 2 discusses our empirical approach
after which Section 3 describes the data. Section 4 then provides our empirical results and Section
5 concludes.
2 Empirical methodology
2.1 OLS estimation
We start our analysis of the link between credit constraints, management practices and green
investment by estimating the following OLS regression:
Yisc =β0 + β1 CreditConstrainedisc + β2 GreenM anagementisc
(1)
0
+ γ Xisc + ξc + ζs + isc
where Yisc is an indicator equal to 1 if firm i in sector s and country c made a recent green invest-
ment and 0 otherwise. Our data allow us to distinguish between various types of green investments
5
This cleansing effect (Caballero and Hammour, 1994) will be smaller if some high-productivity firms also fall
victim to credit constraints (Osotimehin and Pappada, 2015).
6
An extensive literature shows how financial crises, and the associated reduction in bank lending, tighten corporate
credit constraints and reduce investment in R&D and fixed assets (Campello, Graham and Harvey, 2010; Duchin,
Ozbas and Sensoy, 2010; Nanda and Nicholas, 2014; Beck, Degryse, De Haas and Van Horen, 2018).
5(see Section 3.1.3). Our main independent variables of interest are Credit Constrained, an indica-
tor for whether the firm is credit constrained or not (see Section 3.1.1), and Green M anagement,
a z-score measuring the quality of green management practices (see Section 3.1.2). The vector Xisc
comprises three types of control variables. First, we include firm characteristics such as exporter
status, age, stock exchange listing, sole proprietorship, and whether the firm has audited financial
accounts.7 Second, we use variables on the credit market conditions in the vicinity of each firm.
We measure this using characteristics of the bank branches that fall within a 15 km radius of a
firm,8 in particular the number of branches and the amount of assets held by banks owning those
branches. Third, we include other locality characteristics, such as the population size. We take the
city or town where a firm is located as the relevant locational unit l. ξc and ζs are country and
sector fixed effects.9 In all regressions, we cluster errors at the locality level l. Appendix Table A1
contains all variable definitions.
2.2 IV estimation
While our control variables absorb a range of potential confounders, we cannot rule out all mech-
anisms that could bias β1 or β2 . For example, past (clean) investments could influence green
management practices or credit constraints. Banks might take a more favorable view of an invest-
ment project irrespective of its specific merits if the firm has successfully delivered a project in the
recent past. Alternatively, they might consider that the company could overstretch and hence take
a less favorable view. Investment in environmental technologies—for example, more sophisticated
monitoring—could facilitate the adoption of green management practices such as environmental
target setting. To strengthen causal identification, we develop an IV strategy to deal with such
concerns. This strategy rests on the assumption that a firm’s local environment provides a source
of exogenous variation that affects firm outcomes only via financing or (green) managerial quality.
In the case of credit constraints, we observe that many firms—in particular small and medium-
sized ones —rely on banks in their vicinity. That is, the banking landscape near firms imposes an
exogenous geographical limitation on the banks that firms have access to (Berger, Miller, Petersen,
7
Some of these firm characteristics, such as exporter status, may themselves be influenced by whether a firm is
credit constrained or by the quality of its green management and therefore be “bad controls”. When we exclude all
firm-level covariates in a robustness test, our OLS and IV results remain qualitatively unchanged.
8
We explore variations to this radius in robustness tests.
9
Results are very similar when we replace country and sector fixed effects with country x sector fixed effects.
6Rajan and Stein, 2005).10 We can then use variation in those banks’ capital availability as a plausibly
exogenous driver of financing constraints of firms. More specifically, we look at the change in nearby
banks’ Tier 1 ratio. The Tier 1 ratio relates a bank’s core equity capital to its risk-weighted assets.
During and after the global financial crisis, and in particular after the 2011 regulatory stress tests by
the European Banking Authority, many banks had to improve their regulatory capital ratio within
a short period of time. Since raising additional equity was costly due to the difficult situation in the
global capital markets, many banks deleveraged by shrinking their risk-weighted assets, including
through cuts in lending (Gropp et al., 2019).
The intensity of deleveraging across Emerging Europe varied significantly across banks—even
within the same country. Our instrument captures the idea that firms that were surrounded by
branches of banks that had to boost their Tier 1 ratio more during the crisis found it more difficult
to access bank credit. These firms were more exposed to credit rationing in which banks decline
to fund some investment projects that are indistinguishable from other projects they do finance
(Stiglitz and Weiss, 1981).11 We therefore expect a positive relationship between the average local
increase in banks’ Tier 1 ratio and the likelihood that nearby firms were credit constrained.
To create the instrument ∆Tier1, we combine information on the geographic coordinates of
both firms and the bank branches that surround them. ∆Tier1 then captures the average change
in the regulatory capital (Tier 1) ratio over the period 2007 (just before the global financial crisis)
to 2017 (after both the global financial crisis and the subsequent Eurozone crisis) for all banks in
a firm’s vicinity (defined as a circle with a 15 km radius).
Second, to instrument Green M anagement we assume that management practices are (at least
in part) a form of intangible capital (Bloom et al., 2016). Local access to this form of capital
is determined by knowledge diffusion which varies from area to area. One important factor that
can focus managers’ attention to green management practices is the experience of extreme weather
events. The increasing severity and frequency of such events is one of the consequences of global
10
International evidence shows that due to agency costs, small and medium-sized enterprises can only access
nearby banks. For example, the median Belgian SME borrower in Degryse and Ongena (2005) was located 2.5 km
from the lending bank branch. In the US data of Petersen and Rajan (1994) and Agarwal and Hauswald (2010), the
corresponding median distances were 3.7 km and 4.2 km, respectively. One might argue that the change in Tier 1
ratio instrument is correlated with geographical remoteness because for some reason, banks with branches in more
remote locations would have had a lower regulatory capital ratio prior to the financial crisis. We therefore control
for locality size in all regressions.
11
In line with this idea, Popov and Udell (2012) show how firms in localities with financially weaker foreign banks
had greater difficulty in accessing credit during the crisis.
7warming.12 Building on earlier literature, such as Herrnstadt and Muehlegger (2014) and Ranson
(2014), we expect that managers who themselves (repeatedly) experience extreme weather events,
or are informed about such events in their region13, are more likely to be concerned about climate
change and the environment and will therefore be more amenable to green management practices.
To measure variation in managerial exposure to extreme weather, we use granular data on extreme
weather events and their geo-location, as taken from the European Severe Weather Database. The
resulting instrumental variable, Extreme W eather, is the log of the number of extreme weather
events that occurred within a 200 km radius of firm i during the period 2000-15.
Third, we include two additional instruments: the average credit constraint indicator and the
average green management z-score of all other firms in the same region. Again, this is motivated
by both credit constraints and management practices being determined by local credit market
conditions and the local diffusion of management practices. However, to be of use as instruments
we also need to assume that an individual firm has only a negligible influence on those regional
averages. To ensure that this is likely the case, we compute regional averages excluding observations
from a firm’s own sector (2-digit) s(i). This is similar to the “leave-one-out” strategy pursued for
instance in “jackknife” approaches (Angrist et al., 1999).14 Hence we compute
1 X
CreditConstrainedL1Oisc = CreditConstrainedj
#
js.t.s(j)6=s(i)&r(j)=r(i)
and
1 X
GreenM anagementL1Oisc = GreenM anagementj
#
js.t.s(j)6=s(i)&r(j)=r(i)
Consequently, our 2SLS framework comprises the first-stage equations
Ξisc = δ0 + δ1 CreditConstrainedL1Oisc + δ2 ∆T ier1isc
+ δ3 GreenM anagementL1Oisc + δ4 ExtremeW eatherisc (2)
0
+ γ Xisc + ξc + ζs + isc
12
There are many examples in the literature of weather-related variables being used as instruments. See, for
example, Cachon et al. (2019) and, for a critical discussion, Mellon (2020).
13
A region is defined as the stratification region used in the Enterprise Surveys. In most countries, these are NUTS
(EU nomenclature of territorial units for statistics) regions at the level 1, 2 or 3.
14
Similar approaches have been used in a number of other studies including Fisman and Svensson (2007), Aterido
et al. (2011), and Commander and Svejnar (2011).
8for Ξ ∈ {CreditConstrained, GreenM anagment}; and the second-stage equation
Yisc = δ0 + δ1 CreditConstrained
d isc + δ2 GreenM anagementisc
d
(3)
0
+ γ Xisc + ξc + ζs + εisc
where the instrumental variables are as detailed above, and other variables are as described for the
OLS estimation Equation (1).
3 Data
The implementation of our identification strategy rests on matching three important pieces of
information: (i) data from the EBRD-EIB-WB Enterprise Surveys about firms’ credit constraints,
green management and green investments; (ii) information on the exact location of bank branches
from the EBRD Banking Environment and Performance Survey II as well as data on banks’ funding
structure from Bureau van Dijk’s ORBIS database, and (iii) data on extreme weather events.
3.1 Firm-level data
We use the Enterprise Surveys to measure the incidence of credit constraints as well as firms’
management practices and green investments. The surveys took place between October 2018 and
August 2020 and covered 13,353 enterprises in 22 countries in Emerging Europe and Central Asia.15
They involved face-to-face interviews with the owner or main manager of registered firms with at
least five employees. Eligible firms were selected using stratified random sampling. The strata were
sector (manufacturing, retail and other services), size (5-19, 20-99 and 100+ employees) and regions
within a country. The main purpose of the survey is to examine the quality of the local business
environment in terms of, for example, infrastructure, labor, and business-government relations. It
also collects basic information on the firm such as its age, size, and geographic coordinates.
Importantly, the most recent Enterprise Surveys included a new Green Economy module. This
unique module gathered information on key aspects of firm behavior related to the environment and
climate change, including green management practices and green investments. In most economies,
15
The sample we use in this paper consists of the 11,233 enterprises with non-missing values for all the required
variables. Its breakdown by country is presented in Table A2 in the Appendix and summary statistics for all our
survey-based variables are presented in Table A3.
9the response rate for the Green Economy module was over 95 per cent. We thus have a represen-
tative snapshot—stratified by sector, firm size, and region—of firms’ green credentials in each of
these countries.
3.1.1 Credit constraints
By combining answers to various survey questions, we first distinguish between firms with and with-
out a demand for credit. Among the former, we then identify those that were Credit Constrained
as those that were either discouraged from applying for a loan or were rejected when they applied.
Non-credit constrained firms are those that either had no need for credit or whose demand for
credit was satisfied.16
3.1.2 Green management practices
The unique Green Economy Module contained in the Enterprise Surveys asked firms in considerable
detail about their green management practices in four areas. The first area concerns a question
about whether firms have strategic objectives related to the environment and climate change. The
second area looks at whether firms employ a manager with an explicit mandate to deal with green
issues. Conditional on the existence of such an environmental manager, additional information
was collected on whom they report to, as well as whether their performance is evaluated against
how well the establishment performs on energy consumption, CO2 emissions or other pollution or
environmental targets.17 The third area covered by the Green Economy Module asks whether firms
have clear and attainable environmental targets. Lastly, the fourth area looks at whether firms
actively and frequently monitor their energy and water usage, as well as CO2 emissions and other
pollutants, in order to reduce their environmental footprint.18
16
We start by using the question: “Did the establishment apply for any loans or lines of credit in the last fiscal
year?” For firms that answered “No”, we move to the question: “What was the main reason the establishment did
not apply for any line of credit or loan in the last fiscal year?” Firms that answered “Yes”, were asked: “In the last
fiscal year, did this establishment apply for any new loans or new credit lines that were rejected?” We classify firms
that applied for credit and received a loan as unconstrained while we classify firms as credit constrained if they were
either rejected or discouraged from applying due to “Interest rates are not favorable”; “Collateral requirements are
too high”; “Size of loan and maturity are insufficient”; or “Did not think it would be approved”.
17
Earlier research suggests that the link between a firm’s strategic environmental objectives and its day-to-day
actions depends crucially on its organisational structure. The closer the person with environmental responsibilities
is to the firm’s most senior manager, the more they are able to solve problems and overcome ill-defined incentives
(Martin, Muûls, de Preux and Wagner, 2012).
18
Energy use is a key source of greenhouse gas emissions. Others include physical and chemical processing and
the transportation of materials, products, waste, and employees.
10All in all, 18.3 per cent of firms in our sample have strategic objectives relating to the envi-
ronment or climate change. However, this average masks large differences between countries. For
instance, only 7.4 per cent of all Turkish firms have such strategic objectives, compared with more
than 3 out of 10 Slovak firms. A total of 12.8 per cent of firms in the countries in our sample
have a manager responsible for environmental and climate change-related issues, with that figure
ranging from 3 per cent in Azerbaijan to 22.9 per cent in the Czech Republic. Just over half of
these managers are evaluated against how well the firm performs on environmental targets. 59 per
cent of these managers report directly to the CEO, Board or owners; 31 per cent to a manager
reporting directly to the CEO, Board or owners; and the rest to a manager not reporting directly
to the CEO, Board or owners.
When it comes to energy consumption monitoring, just over 60 per cent of firms in our sample
do so. About 1 in 6 firms report emitting CO2 over the last three years and less than half of them
monitored these emissions. Of the 9.5 per cent of firms that reported emitting pollutants other than
CO2 , almost three quarters monitored them. More than a quarter of firms had energy consumption
targets, ranging from 6.7 per cent in Azerbaijan to 48 per cent in Serbia. Only 5.8 per cent of firms
had CO2 targets, while 7.7 per cent of firms had targets for pollution emissions other than CO2 .
We normalize the scores for each question such that they have a mean of 0 and a standard
deviation of 1 in the sample. We then aggregate them to average z-scores for each of the four
areas of green management. Lastly, we create an overall green management z-score as a normalised
unweighted average of the four areas. A z-score above zero indicates that a firm’s management
practices are better than the sample average.
Although there are substantial differences across countries in terms of the average quality of
green management, most of the variation (91 per cent) is found within economies, even after
accounting for cross-country differences in sectoral composition. Figure 1 shows that there are
firms with low and high green management scores in every economy. This is the granular within-
country variation that we will exploit in our empirical analysis.
3.1.3 Green investments
The Enterprise Surveys asked firms whether they made any of the following green investments in
the last three years: machinery upgrades (Machinery); vehicle upgrades (Vehicles); improvements
11Figure 1: Geographical Distribution of Firms and the Quality of their Green Management
Notes: This map shows the geographical distribution of the 11,233 firms that make up the sample used in Tables 1 and 2.
Each dot represents one or several firms in a locality. Darker green colors indicate higher-quality green management. Green
management is measured as a z-score based on four areas of green management practices: strategic objectives related to
the environment and climate change; whether the firm has a manager with an explicit mandate to deal with green issues;
environmental targets; and energy monitoring. Source: EBRD-WBG-EIB Enterprise Survey.
to heating, cooling and lighting systems (Heat/cool/light); on-site generation of green energy (Green
generation); waste minimization, recycling and waste management (Waste minimization); energy
and water management (Energy/water management); measures controlling air and other pollution
(Pollution control ); and energy efficiency measures (Energy efficiency).
Most of these investments explicitly target an increase in the firm’s energy efficiency and/or a re-
duction in pollution or other negative environmental impacts. However, some investment types—in
particular machinery and vehicle upgrades—mainly have an environmental impact as a by-product
of achieving other objectives. For instance, as innovation proceeds, new vintages of machinery and
vehicles tend to be more energy efficient than the outdated models they replace. We consider both
these direct and indirect types of investments as green ones.
123.1.4 Firm covariates
Firm-level control variables include firm age and dummy variables for whether the firm is publicly
listed, a sole proprietorship, an exporter, and whether an external auditor reviews its financial
statements. We expect listed and audited firms (in other words, firms that are more transparent)
to face fewer credit constraints (Beck et al., 2018).
3.2 Bank-level data
In order to implement the IV strategy described in Section 2.2, as well as to control for local credit
market conditions in both the OLS and IV estimation, we use detailed data about the banking
sectors in our sample countries.
First of all, the geographical coordinates of 67,559 branches, operated by 609 banks across
Emerging Europe, were collected by specialized consultants as part of the second round of the
EBRD Banking Environment and Performance Survey (BEPS II). Data collection took place by
contacting banks or by downloading data from bank websites. All information was double-checked
with the banks as well as with the SNL Financial database. The 609 banks represented 96.5 per
cent of all bank assets in these 22 countries in 2013, so that we have a near complete bank branch
footprint. As described in Section 2.2, we connect the firm and branch data by drawing circles with
a radius of 15 km around the coordinates of each firm and then linking the firm to all branches
inside that circle.
For each branch we know the bank it belongs to. We merge this information with bank balance
sheet information from Bureau Van Dijk’s (BvD) ORBIS database. We download information
about each bank’s pre-financial crisis assets in 2007. For each firm we then first measure the
number of bank branches within a 15 km radius. Second, we calculate the branch-weighted average
asset size of banks with branches within this radius. This allows us to control for the number and
the size of the banks that make up the local credit market around each firm. The collected bank
balance sheets also allow us to construct the Tier 1 ratio described in Section 2.2 as the ratio of a
bank’s core equity capital to its total risk-weighted assets. It is calculated in 2007 and 2014 so as
to measure, for each firm, the change between those two years in the average Tier 1 ratio of banks
with branches within a 15 km radius (weighted by the number of bank branches).
133.3 Extreme weather events
In order to implement the IV approach described above, we use data from version 1.60 of the
European Severe Weather Database (Dotzek et al., 2009).19 This database collects information
about “important weather events that can endanger people or do damage”. Reports of events can
be made by weather services, associations or individuals, and each submission is processed by the
European Severe Storms Laboratory or one of its partner organisations. Those events meeting the
quality criteria are included in the database. We select all tornado, hail, wind, precipitation and
snow extreme events reported between 2000 and 2015 in the countries covered by our survey. To
compute the instrument described in Section 2.2, we count how many of these events occurred in
a 200 km radius around each firm, and take the log of that value.
3.4 Descriptive statistics
Table A3 in the Appendix presents summary statistics. It reports that 76.3 per cent of firms
made at least one type of green investment in the past three years. More than half of all firms
made improvements to heating, cooling or lighting systems—making this the most common type
of green investment. In contrast, only 12.5 per cent invested in green energy generation on site,
possibly because such projects typically require very sizable investments. About a third of the firms
adopted energy efficiency measures or invested in vehicle upgrades, energy or water management,
or recycling and waste management. Only a fifth of all firms recently adopted air or other pollution
control measures.
As for the explanatory variables, we find that almost a quarter of all firms are credit constrained
(22.6 per cent). The standardized Green M anagement variable is by construction close to zero on
average but varies considerably between -1.91 and 6.98. The table shows that all firms have at least
one bank branch within a 15 km radius, which indicates the IV approach can be implemented. The
change in local branch-weighted average Tier 1 ratio between 2007 and 2014, one of the variables
we will use as an instrument, was on average 2.08 percentage points. All firms experienced extreme
weather events within 200 km of their location, on average more than 500 of them in total between
2000 and 2015.20 Variation between firms is again substantial.
19
ESWD, European Weather Observer (https://www.eswd.eu/ESWD/)
20
This is calculated as e6.243 , since the extreme weather variable in Table A3 is reported in logs.
144 Results
This section presents our OLS and IV baseline results regarding the impact of financial frictions
and managerial constraints on firms’ green investments. We then introduce additional data to
explore the impact of credit constraints and management quality on pollution and greenhouse gas
emissions.
4.1 OLS estimates
Panel A of Table 1 presents regression specifications based on Equation (1) to estimate the associa-
tion between credit constraints, green management quality, and green investment. More specifically,
we look at whether the firm made any type of green investment in the last three years. We then
consider the different types of measures adopted or investments made. All regressions include
firm-level controls, locality-level credit market controls, and country and sector fixed effects.
We find a significantly negative relationship between whether a firm is credit constrained and the
likelihood that it makes a green investment (column 1). Credit constraints reduce the probability
of the firm making at least one type of green investment over the past three years by 3.72 per cent.
Conversely, the quality of green management is correlated positively and significantly with green
investment. A one standard deviation increase in the quality of green management increases the
probability of green investment by 8.52 per cent. While the magnitudes of these coefficients are
not directly comparable, the “horse race” between financial and managerial constraints suggests
that where the investment has at least some component related to reducing pollution or increasing
energy efficiency, the quality of green management is the most important factor.
Our data allow us to look at these relationships in more detail, using the information on different
types of green investment. The estimates in panel A of Table 1 indicate that credit constraints
hinder all types of investment except those in air and other pollution controls.21 The effect is
the largest for machinery and vehicle upgrades as well as improved heating/cooling/lighting. This
likely reflects the higher investment amounts these types of projects require and hence the higher
likelihood that the firm will try to access external funding to realize the investment. The correlation
with energy efficiency measures is smaller and less significant, potentially due to the “low-hanging
21
Table A4 shows that these results are robust to correcting the p-values for multiple hypothesis testing (Romano-
Wolf FWER p-values) and to correcting standard errors for spatial correlation, following Colella et al. (2019).
15fruit” nature of such investments.
The estimated coefficients on the quality of green management are positive and significant
throughout and their absolute magnitude is higher than that of the credit-constraint indicator.
The largest effect of green management is on energy or water management, air or other pollution
control, and energy efficiency measures. This could be due to such investments being less integral to
the firms’ normal operations, whereas upgrades and energy generation are more usual investments.
16Table 1: Firm-level Credit Constraints, Green Management, and Green Investments
Dependent variable → Green Machinery Vehicle Improved Green Waste and Energy / Air / other Energy
investment upgrade upgrade heating / energy recycling water man- pollution efficiency
(indicator) cooling / generation agement control measures
lighting
[1] [2] [3] [4] [5] [6] [7] [8] [9]
Panel A: OLS
Credit constrained -0.0372*** -0.0556*** -0.0623*** -0.0490*** -0.0257** -0.0356*** -0.0322*** 0.0008 -0.0225*
(0.0126) (0.0136) (0.0128) (0.0146) (0.0106) (0.0130) (0.0112) (0.0130) (0.0131)
Green management 0.0852*** 0.1078*** 0.0988*** 0.1183*** 0.0889*** 0.1240*** 0.1755*** 0.1558*** 0.1623***
(0.0047) (0.0056) (0.0060) (0.0058) (0.0066) (0.0062) (0.0050) (0.0057) (0.0058)
R-squared 0.1432 0.1679 0.1569 0.1841 0.1271 0.2141 0.2515 0.2279 0.2234
Panel B: IV
Credit constrained -0.5931*** -0.6705*** -0.5278*** -0.5229*** -0.4788*** -0.2710* -0.2688** -0.1872 0.0280
17
(0.1657) (0.1811) (0.1620) (0.1897) (0.1440) (0.1485) (0.1289) (0.1436) (0.1275)
Green management 0.3143*** 0.3084*** 0.2185*** 0.3245*** 0.1784*** 0.3791*** 0.4312*** 0.3789*** 0.4160***
(0.0471) (0.0578) (0.0479) (0.0701) (0.0518) (0.0479) (0.0438) (0.0598) (0.0497)
Firm controls 3 3 3 3 3 3 3 3 3
Credit market controls 3 3 3 3 3 3 3 3 3
Country FE 3 3 3 3 3 3 3 3 3
Sector FE 3 3 3 3 3 3 3 3 3
Locality size FE 3 3 3 3 3 3 3 3 3
Observations 11,233 11,233 11,233 11,233 11,233 11,233 11,233 11,233 11,233
Clusters (localities) 2,226 2,226 2,226 2,226 2,226 2,226 2,226 2,226 2,226
Notes: This table presents OLS (Panel A) and Instrumental Variables (Panel B) regressions to estimate the relation between, on the one hand, firm-level credit
constraints and the quality of green management and, on the other hand, firm-level green investments. All regressions include firm-level controls (indicators for
exporter status, listed firm, sole proprietorship and audited financial accounts, as well as the log of firm age); locality-level credit market controls (log average amount
of assets of banks in a 15 km radius and the number of bank branches in a 15 km radius); and country, sector, and locality-size fixed effects. Table A1 contains all
variable definitions and Table A3 provides summary statistics. Table 2 provides the first stage of the IV regressions in Panel B. Robust standard errors are clustered
by locality and shown in parentheses. ***, ** and * correspond to the 1%, 5%, and 10% level of statistical significance.4.2 IV estimates
As discussed in Section 2.2, a firm’s investment decisions can influence its green management
practices and credit constraints. We therefore now take an IV approach, with two instruments for
each of our variables of interest.
Table 2 shows the results of the first stage. We regress each firm’s credit constraint indicator
and green management score against all four instruments in columns 1 and 2, respectively. Column
1 displays positive and significant coefficients for the first two variables. This confirms that firms
are more likely to be credit constrained if they are located in regions where firms from other sectors
are also credit constrained, as well as if the banks in the firms’ vicinity had to increase their Tier 1
ratio between 2007 and 2014 by a lot. Such banks would have sought to deleverage and reduce their
risky assets, and would have issued loans more cautiously. In column 2, the green management
score is positively correlated with the two instruments: the average green management practices
score of firms in the same region but from different sectors, and the total number of extreme weather
events between 2000-15 in a 200 km radius around the firm.
The first-stage F-statistics on the excluded instruments are comfortably above the rule-of-thumb
of 10.22 It is also reassuring that the instruments for green management are not correlated with the
credit constraints indicator and, vice-versa, those for credit constraints are not correlated with the
green management score. This supports the identifying assumptions underlying our instrumentation
strategy: the financial health of banks only affects the investment decisions of firms through the
impact on local lending conditions, while extreme weather events only affect their investment
decisions through green management practices.
The second-stage results in panel B of Table 1 confirm that credit constraints and green man-
agement significantly affect the likelihood of firms making green investments.23 The IV estimates in
Column 1 are more than ten times larger than those in panel A, suggesting that omitted variables
bias the OLS results downward. The magnitudes of the estimated coefficients suggest that credit
constraints matter slightly more for any type of investment.
22
Sanderson-Windmeijer multivariate F-tests yield a p-value of 0.00, indicating that in both cases the null hypoth-
esis of an underidentified endogenous variable can be rejected. Table A6 provides a battery of additional diagnostic
tests in support of our instrumentation strategy.
23
Table A5 shows that these results, like the OLS ones, are robust to correcting the p-values for multiple hypothesis
testing and for spatial correlation.
18Table 2: Firm-level IV regressions: First Stage
Dependent variable → Credit Green
constrained management
(indicator) (z-score)
[1] [2]
Credit constraints instrument 0.5566*** 0.0406
(0.0503) (0.1544)
Change in local average Tier 1 ratio (% points) 0.0032** 0.0006
(0.0014) (0.0037)
Green management instrument 0.0208 0.5390***
(0.0167) (0.0802)
Extreme weather events -0.0020 0.0760***
(0.0112) (0.0262)
Firm controls 3 3
Credit market controls 3 3
Country FE 3 3
Sector FE 3 3
Locality size FE 3 3
Multivariate F-test of excluded instruments 44.11 32.82
Observations 11,233 11,233
Clusters 2,226 2,226
Notes: This table presents the first-stage regressions corresponding to Panel B of Table 1. All re-
gressions include firm-level controls (indicators for exporter status, listed firm, sole proprietorship and
audited financial accounts, as well as the log of firm age); locality-level credit market controls (log
average amount of assets of banks in a 15 km radius and the number of bank branches in a 15 km
radius); and country, sector, and locality-size fixed effects. Table A1 contains all variable definitions
and Table A3 provides summary statistics. Robust standard errors are clustered by locality and shown
in parentheses. ***, ** and * correspond to the 1%, 5%, and 10% level of statistical significance.
19Figure 2: Firm-level Credit Constraints, Green Management, and Green Investments
Notes: This figure summarizes the IV coefficients of Table 1, Panel B, which represent estimates of the relation between, on the
one hand, firm-level credit constraints and the quality of green management and, on the other hand, firm-level green investments.
Table A1 contains all variable definitions and Table A3 provides summary statistics. Whiskers represents 95 percent confidence
intervals.
We summarize the coefficients of Table 1, panel B, in Figure 2. Looking at the relationship
between credit constraints and the various types of green investment, the IV estimates show that,
as in the OLS, vehicle and machinery upgrades; investments to improve heating, cooling or light-
ing; as well as investments in green energy generation are the green investments that are most
negatively affected by credit constraints. The coefficients for waste and recycling, and energy or
water management investments are smaller and less significant, while the relationship is insignifi-
cant for pollution control and energy efficiency investments. This likely reflects the relative size of
the investments that each category involves, and their payback time. In the IV estimation, green
management practices are shown to be strongly and significantly correlated with every type of
green investment. Firms that are well managed in a green way are more likely to implement green
20investments and the effect is larger for waste and recycling; energy/water management; pollution
control; and energy efficiency measures, as can be seen in columns 6-9 of panel B in Table 1 and in
Figure 2.
4.3 Access to credit, air pollution and gas emissions
If credit constraints and weak green management prevent firms from undertaking at least some green
investment projects then one might expect that, perhaps with some lag, they can also hamper firms’
ability to reduce their emissions of greenhouse gases and other pollutants. Unfortunately, there is
no pollution data available for the firms used in the analysis above. However, the EU collects
detailed pollution data at the facility level across its member states. We can therefore link these
data to the instruments developed above at the regional level. In this section, we first describe the
data, then our methodology, and finally discuss the results.
4.3.1 Data
We use data from the European Pollutant Release and Transfer Register (E-PRTR). The E-PRTR is
a register containing annual data on some 30,000 industrial facilities covering 65 economic activities
across Europe. For each facility, information is provided on the amounts of pollutant released to
air, water, and land (as well as off-site transfers of waste and of pollutants in waste water) from a
list of 91 key pollutants including heavy metals, pesticides, greenhouse gases and dioxins. Data are
available from 2007 onward. For industrial facilities with missing information on pollutant releases
we assume that they were zero.
We focus on the 3,892 industrial facilities in 12 eastern European countries (Bulgaria, Croatia,
the Czech Republic, Estonia, Hungary, Latvia, Lithuania, Poland, Romania, Serbia, the Slovak
Republic and Slovenia) in the E-PRTR data set that overlap with the Enterprise Surveys data set.24
The green dots in Figure 3 show the locations of these facilities. We combine the E-PRTR data with
information from the BvD ORBIS database on the firms that own the industrial facilities (including
their date of registration, listed status and location) and our data on bank branch networks from
24
Table A2 provides the number of facilities by country. These are all facilities for which data are available for
the years 2015, 2016, and 2017 (and in most cases also for all earlier years dating back to 2007). We focus on the
facilities with data coverage in 2015-17 as this period is closest to the roll-out of the Enterprise Surveys, on which we
base our regional measures of green management practices.
21You can also read