DO NOT ASK WHAT YOU CAN DO FOR THE OIL INDUSTRY BUT WHAT CAN OIL INDUTRY DO FOR YOU - MUNICH PERSONAL REPEC ARCHIVE
←
→
Page content transcription
If your browser does not render page correctly, please read the page content below
Munich Personal RePEc Archive

Do not ask what you can do for the oil
industry but what can oil indutry do for
you

Paunić, Alida

6 March 2005

Online at https://mpra.ub.uni-muenchen.de/4898/
MPRA Paper No. 4898, posted 13 Sep 2007 UTC
Munich Personal Research Archive

              Do not ask what you can do for the oil industry
                   but what can oil industry do for you

Alida Pauni
University of Madison,USA

2007, August

                                                                         1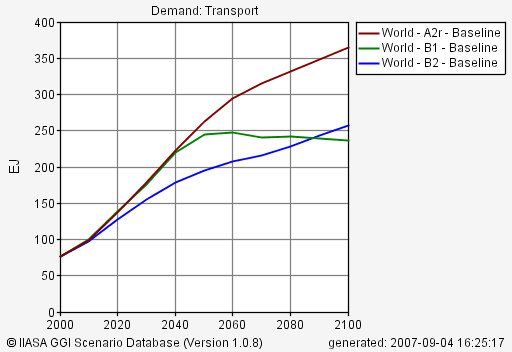
Munich Personal Research Archive

              Do not ask what you can do for the oil industry
                   but what can oil industry do for you

Alida Pauni
University of Madison,USA

2007, August

                                                                         2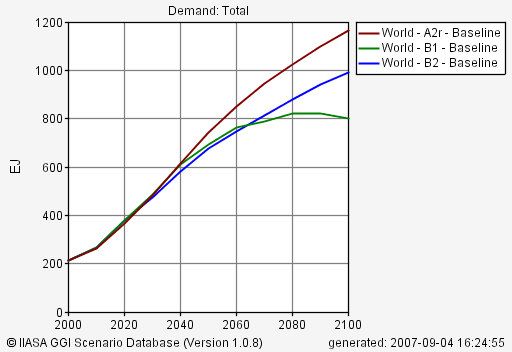
Do not ask what you can do for the oil industry
                        but what can oil industry do for you

Abstract
Strong more than doubled crude oil price rise from 2002 to 2007 brought significant profits
to oil companies worldwide. Rising revenues, profits and increasing shareholders wealth are
consequence of this favorable situation. Being non renewable resource, unequally distributed,
responsible for many crises, wars, environmental pollutions, weapon trading, GDP fall, rising
unemployment, interest rates and reaching its peak production point in the world of
increasing gasoline demand, higher environmentally standards, global worming, natural
catastrophes, constrained refining capacity forces us to ask: is the rising wealth to small
number of shareholders only we should expect?

Paper examines oil companies and their contribution to promote social developments, clean
energy, behave as good tax subject , closely work with government and various institutions
to advance humanitarian environmentally friendly world.

JEL code: Q 40, Q 30
Keywords: energy, oil, non renewable

                                                                                           3
Do not ask what you can do for the oil industry
but what can oil industry do for you
1.Introduction
2.How oil shapes our world
2.2 Oil production
2.3 Oil consumption
2.4 Oil, renewable resources, environment
2.5 Oil prices
3.Oil and macro economy
4.Oil companies
4.1 Russia
4.2 USA
4.3 Saudi Arabia
4.4 UK
4.5 Netherlands
4.6 Canada
4.7 China, India
4.8 Regional and world data
5. What oil companies failed/not to do?
5.1 Oil companies good tax payers?
5.2 Oil companies have social influence?
5.3 Oil companies developed renewable alternatives?
5.4 Oil companies and environment?
6. Conclusion
41. INTRODUCTION
The last century already proclaimed by many to be century of oil has flourished with oil exploitation,
production, developments of numerous oil products that are used in everyday life and without our
existence is slowly but surely become fully addicted to. We have seen for the last 100 years growing
oil influence, first smaller than bigger crises which some of them turned into real war that had for its
root struggle for dominance on market, oil greed or happened due to the environmental and transport
accidents.
What many of us, mostly part of older generation, remember is „old antiquitated“ dream about
beautiful 21 century filled with clean energy, numerous flying machines that are environmentally
friendly, world without hunger, illness, fear or shortly new better future for all. Instead, we are
bombed with pictures of hungry people, war in Iraq, growing concern about uncured diseases,
problems of terror and violence fueled with good marketing on TV, lack of understanding and lost
balance in which the most powerful ones control and administer justice of those who are without
knowledge or guilt found to be minority in the N.W. ”Order”.
It was a widely known fact that oil prices can influence the macro economies by increasing prices,
interest rates and slowing growth and GDP, but some economists argued based on very loose relation
between the main macro variables in USA and oil price in the mid 90-ies that this dependence is a
matter of past. A measure such as obligatory oil stocks, government reserves, fuel switching regimes
and introduction of renewable could discouraged the strong negative oil influence on every day
American life but with the policy of not progressing in oil substitution this relation is not becoming
any weaker or insignificant in that particular country.
With the dawn of new century new war in oil rich Iraq started, crude oil prices together with its
products seems to blossom making the oil companies richer than ever, progressively increasing their
profits and making them and stock holders the one who mostly benefited situation.
On the other hand armed with numbers that are presented by UN as the millennium goal in which we
have learned that still 44% of population in Sub Sahara region are living below 1$ a day, 47% of
children living in Southern Asia are underweight, 69% of children are not enrolled in primary
education in Least Development Countries, still large gender inequality in poor regions as well as in
some developed countries, uncured 59% of women in Sub Sahara that are living with HIV, smaller
regions of land covered by forest, large amounts of CO2 averaged on the world level at 25 168 millions
5of metric tons or simply 4 metric ton per capita makes us wonder are we really heading toward better
world?
The main idea of this paper is to examine the oil sector influence on the micro and macro surroundings
and argue that some planned wide range activities that were not undertaken by those in power together
with oil companies locked us all in further poverty, climate changes disasters and problems such as
hunger that in today’s world with current knowledge of production should be matter of past and left to
“old bad” 20 ieth century.
2. HOW OIL SHAPES OUR WORLD
Oil destiny shaped by human’s mismanagement and its own curse as being non renewable makes
of remains from million years before dinosaur’s animals and plants wealth to be hastily spend by
humans in the almost 200 years and subject of many wars and disputes. This particular nature of oil as
non renewable resource points us to be extra cautious in order to spend this resource wisely avoiding
addiction. This character feature was not resolved even by some huge economies that couldn't resist
the sirens call and considered different tactics in order to get a larger part of black gold. Let’s examine
how it shapes the world, can it be properly substituted and how those who benefited out of earthly
treasure contributed to society of men in this world.
When talking about what is left of oil today in the terms of quantities it is important to stress current
disagreement between experts about numbers of proven and possible oil reserves but all of them agree
that it is a word around 1 208 thousand million barrels unequally distributed wealth. The majority of it
is placed in the Middle East region 62%, Africa and Central and South America has each 9%, Russia
and North America each 6%, while the Europe and Central Asia settled with only 2% of world oil
reserves.
Besides this, researches can’t agree which country has reached its discovery, production or depletion
peak and when. So, it is believed that depletion midpoint for Iran is 2009, Iraq 2021 Kuwait 2018,
United Arab Emirates 2026, Kazakhstan 2036 and for Russia was 1992.
These two strong reasons: inequality and addiction made this business of oil constantly followed by
numerous conflicts and different scenarios of possible events that are naturally or artificially produced
even in today’s modern 21 century. Let’s just recall pictures from today’s Iraq torn to pieces due to
“democracy” imposed with military action and bitter inner conflicts; Arab- Israel constant intolerance,
potential threat of terrorist attacks on the Middle East and in the countries of the former Soviet Block
6(Armenia, Chechnya, Azerbaijan, Aphasia, etc). Oil facilities are found to be in the spotlight of
terrorist activities that are attacking oil fields, pipelines, storage facilities. Especially vulnerable places
not just for local disagreement and potential crises are narrow ocean straits where one incident could
shake global oil market and prices: Strait of Hormuz (13-16,5 mil bbl/d ), Strait of Malacca (10-11,5
mil bbl/d), Bab el Mandab ( 3,2-3,3 mil bbl/d), Bosporus (2-3 mil bbl/d), Suez (1,3 mil bbl/d) and
Panama(0,5 mil bbl/d).
Further potential treats to oil supply are inner conflicts in countries rich with oil reserves but lacking
the some other important attributes that could bring welfare to society: rich families are ones that keep
the majority of wealth while population still fight with unemployment; living female figure far
behind; not providing schooling and health equally to everyone; buying military equipments instead of
irrigation and agriculture developments; lack of investments and developments in the clean technology
(like solar/wind) that could further drive higher prices down and make living more comfortable for
them and neighboring Africa.
Although oil intensity is lowered since mid 70- is it impacts greatly every day living of modern society
and making power of OPEC more recognizable. Influence of this organization is very distinct while
its decisions about oil production rise or fall influence prices greatly and it is easily achieved if we
know that 12 countries possess 897 bn barrels of oil or 78% shares of the world reserves. (Graph1)
Graph 1:OPEC and Oil Reserves
Source: OPEC
Today’s problems of modern oil industry are lack of investments in building new or modernized
existing refinery capacities, increasing demand for better quality, environmentally more expectable
products and very low difference between the demand and supply levels.
In addition to these problems oil industry get herself involved with the military and weapon trade.
Very high levels of Pearson’s coefficient of correlation between the import of oil with weapons
7export.(0.74) is observed of which half of the total weapon export is contributed to USA, after which
follows UK, France Germany and Russia. The biggest importers are OPEC countries (Saudi Arabia
and Kuwait) and developing countries. Than is understandable that having a Nash balance in the
complex surrounding of Persian bay which has 60$trillion wealth or ¾ world reserves, with the costs
of extraction 5$ barrel, with five countries having nuclear weapon, and 18 nationalities of the 9/11
kidnapers is not an easy task.
Theses problems and obstacles are recognized after 1974 OPEC’s embargo to USA and Netherland
when western countries tried different ways to make themselves less vulnerable to potential future oil
crises. On the demand side they took measures which included saving, decreasing oil intensity, bigger
investment in research and technologies, tax system reform and supporting the stable energy prices.
On the supply side energy promotion of different energy sources and directions of supply are
organized like starting up organizations such as: World Energy Council with the aim of energy
promotion and equal right accession to all; The Interstate Oil and Gas transport to Europe with its
purpose to assess current network of gas and oil pipelines in Europe, possibilities of development of
the new directions, increasing level of energy infrastructure, knowledge transfer, coordination,
promotion and investment activities of the strategic projects; Energy Charter was at the beginning
thought to be flow of technology from western countries to East mainly Russia and reverse energy
flow from Russia to western Europe. With the time it increased its mission to the five important
reform tasks: security, business transparency, private property rights, building new capacities and
coordination with the strategies from the other sectors.
All these activities that includes governments, tax authorities, different ministries, numerous
organizations and companies with broad range of different tasks underlines the important of oil as
energy that is further elaborated in the Table 1 which shows that oil in the near future is going to play
the most important role although with decreasing growth.
Table 1: Levels of energy /growth /fuel share
Levels mtoe Growth % Fuel share %
2000 2010 2020 2025 200-01 2010-20 2020-25 2000 2010 2020 2025
Oil 3614 4225 5059 5492 1,6 1,8 1,7 40,1 38,7 37,6 36,9
Solids 2341 2818 3435 3750 1,9 2 1,8 26 25,8 25,5 25,2
Gas 2101 2800 3808 4453 2,9 3,1 3,2 23,3 25,7 28,3 29,9
Hydro/nuclear/ 953 1065 1153 1195 1,1 0,8 0,7 10,6 9,8 8,6 8
renewable
Total 9.009 10.908 13.455 14.890 1,875 1,925 1,85 100 100 100 100
Source:OPEC
8It is to be seen whether governments and industry are going to resolve the lack of energy in this and
next century by investing in renewable considering the growing demand in the developing countries
primarily China and India.
Graph 2:Level/Growth/Fuel share
100%
80%
Hydro/nuclear/renew ables
60% Gas
40% Solids
Oil
20%
0%
2000 2010 2020 2025 200-01 2010- 2020- 2000 2010 2020 2025
20 25
Levels mtoe Grow th % Fuel share %
Source:OPEC
92.1 Oil production
There has not been significant shortage in supply over the last couple of years. On contrary, strong
growth followed from 77 m b/d in 2002 to 84 m b/d in 2006. OPEC has risen in the last four years its
production by 10% for more than 3,7 m b/d to 34,3 m b/d and did not use its cartel power.
However, the largest production is made in the non OPEC countries (43,4%) of total, with OPEC ‘s
producing 41,7 % of total and leaving the FSU the rest or 14,8% of total.
Among the biggest producers is still Saudi Arabia, narrowly followed by Russia. Having half of their
production followed by Iran, Venezuela, UEA, Nigeria Kuwait, Iraq, Libya and Kazakhstan.
Strong surge in demand coming from China and India open the question of spare capacity1 and
problems in production. According to IEA OPEC’s spare capacity is only 1,78 m b/d what makes the
last few years spare capacity level lowest in the 35 year history series.
Table 2 shows crude supply and demand from 2002 showing how the gap between these two
variables is closer each day what further points to necessity of clear vision of world energy strategy
and explains partly potential high nervousness of oil prices.
Table 2:Crude Oil Demand and Supply
mil. barrels per day 2002 2003 2004 2005 2006
OECD Demand 48,00 48,60 49,40 49,60 49,90
Non OECD Supply 30,00 30,80 33,00 33,90 34,80
Total DEMAND 78,00 79,40 82,40 83,50 84,70
OECD Supply 21,90 21,60 21,30 20,30 20,20
Non OECD Supply 24,50 25,50 27,10 27,90 29,10
Profits in production 1,80 1,80 1,80 1,80 1,80
OPEC 28,80 30,60 32,90 33,90 34,3
Total SUPPLY 77,00 79,50 83,10 83,90 81,60
Change in Stock’s -0,90 0,30 0,50 0,50
Source: British Petroleum
What kind of problems can be expected on the side of supply?
Numerous exceptional supply constraints affected large number of producing countries: Iraq faces
human suffering daily and lowered its production for the 30% down on pre war levels. Iran’s nuclear
1
Capacity-the maximum amount of production that could be brought online within a period of 30 days and
sustained for at least 90 days
10enrichment is every now and then picked up as subject and embargo to this state can shake the world
oil market easily.
In addition to this weather conditions could be a large obstacle to supply following the NOAA2
forecast for USA to expect 8-10 hurricane’s a year. Knowing that Hurricane Katrina demolished a
10% of the USA refining capacity this makes a justified doubt of potential problems.
These fears induced hardening the stockpiles which further raises costs and prices. Oil inventories in
the USA (Graph 3) amounted 54 days of forward consumption. These rising levels of inventories
further exceserbates oil price and this is the first time that history of reverse relation between the oil
stocks and prices have been broken.
Part of guilt about oil price uncertainties can be traced down to increasing number of speculative
contracts which largely have not been fully comprehended or researched. Besides non trade investors
amounting 30% of the contracts in West Texas Intermediate there are large number of investors who
are not included like proprietary trading activities of the investment bank, flow of funds related to
commodity indices, trading through exchange traded funds.
Graph 3:Industry and Government stocks worldwide
O E C D , As ia &
O c e a n ia
O E C D E u ro p e
O E C D N o rth
Am e ric a
0 500 1 .0 0 0 1 .5 0 0 2 .0 0 0 2 .5 0 0
In d u s try G o ve rn m e n t-C o n tro lle d 1
Source:IEA
Shortage of refinery capacity has become more visible when comprehending the fact that over that last
ten years crude has risen over 19% while capacity only 11%. USA increased its gasoline consumption
by 45% after mid 70-ies without building a new refinery. Utilization rate at about 85% in OECD
proves a little bit more space for improvement but small number of complex refineries points us to
further caution.
2
NOAA The National Oceanic and Atmospheric Administration
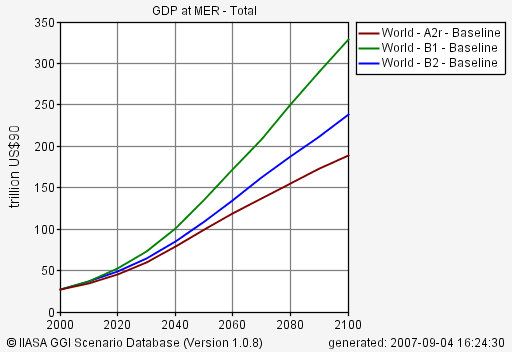
11Graph 4: GDP growth 200020100
These problems encouraged the exploration in ultra deep water, as well in the Artic region and in the
oil sands. But further scary fact estimated by IEA is that there is a need for necessary investment of
3 trillion dollars to be made in the next 25 years in order for suppliers to meet demand after 2030.
2.2. Oil consumption
Global oil demand was 84,7 m b/ d what presents 1,4 % increase when comparing to the year before
and 4% increase comparing two years before (2004). If put in comparison with the rise in world GDP
of 5% this single number seams low. The reason for that can be traced to the fact that high oil prices
discourage consumption to one point, while speeding the efforts to be more energy efficient and
decreased oil intensity so richest countries don’t change upwards much their consumption habits
lately .
Developed world (aside USA) is trying to find a ways to decrease oil addiction through alternatives
leaving probable future oil demand to depend upon situation in the emerging markets. If the GDP
growth continue to burst as we have seen for some time and knowing the fact that in the USA there is
1 car for every 2,2 people while in China it is low at the level of 120 than future rise of 2-4 % in oil
demand is to be expected. It is believed that one quarter of the future oil demand is to be allocated to
China alone, while one eight to India. Besides Asia’s giants Middle East countries especially Iran are
booming being second gasoline importer (after USA) in the world market.
122.3 Oil, renewable resources and environment
High oil prices forced consumers and producers to consider another substitute or alternatives. The
largest widespread oil use is in the transport sector that needs to consider alternative fuels and ways of
energy usage. Unfortunately since today a little is done on that field. Car industry is still stronger than
ever with new models coming each year improved with leather seats, better loudspeakers faster
engines but what has really changed?
Majority of viachles still runs on gasoline and there is not any visible solution to be changed in the
short term period. But with high oil price levels, stronger EU regulation in the field of environment,
bio diesel introduction, Kyoto protocol we could slowly but surely see some changes. But question
still holds: is it good and fast enough?
We are witnessing the time of global weather problems whether is it a word about hurricanes, floods,
earthquakes, conflagrations etc. Global worming has serious consequences on our lives and we
should be aware that IPCC/UN report about global worming is not happening to Pluto or Mars. In this
report we can learn that water level is about to rise making some places at extreme risk like small
Irelands or Bangladesh. While this country is one of the poorest on Earth with people who struggle to
meat month ends without food, have no car problems while are not in possession of them we should
ask ourselves should they pay the price of CO car emissions that they did not make and aren’t we all
responsible at least a bit? By building dam, sending money, making no excuses to transfer the leisure
of our life’s to be bared by someone who hungers daily.
When said leisure it is meant that 65% of the world oil production of 83 mbbl/d is spent by 700
million vehicles out of which 50% drive daily distance of no more than 30 km.
On the other hand alternatives should be wisely, quickly and most seriously taken into consideration.
The good start is to compare at the current crude price level competitive fuel prices. From the table 3
and life we can notice than more and more gas stations and cars are available, bio fuel is incorporated
in the EU policy with fixed dates but this is gong at the slower pace than should be due to the
numerous reasons.
Table 3:Overall Average Fuel prices on Energy Equivalent Basis (2006)
Fuel Price($) in equivalent gasoline
Gasoline 2,23
Natural gas LNG 1,99
Ethanol(E85) 2,81
Propane 2,74
Bio diesel (B20) 2,41
Bio diesel (B2-B5) 2,21
Bio diesel (B99-B100) 3,18
Source : DOE
13Bio fuels became great publicity in the last decades due to small modifications of cars and existing
filling station network. But it seams that pace of substitution that was made by EU directives firstly of
setting the 20% of bio fuels need to be revisited to only 10% by the year 2020.
The second problem is that yes you can change the engine for “just” $200 but the rest of further engine
operation largely stays by owner. Further constraints are seen on the production field and availability
and morality of using the large quantities of land for driving, having people that starves.
Ethanol production is highly depended upon geographical location. In Brazil sugar canes gives results
but 1 hectare of land is needed for getting a 50 t of sugar and 3,2 t of ethanol. Ethanol production is
energy intensive while 1 liter of ethanol with an energy content of 21,4 MJ requires 17 MJ of energy
and it is worth mentioning that quantity of ethanol produced causes the CO2 emissions.3
Although bio diesel is possible to produce from the larger number of crops in the EU this production is
limited to oilseed rape. Still potentially larger area of 1 ha where 2,8 t oilseed rape is produced gives
us 1 t of bio diesel. Making an less farm potential of 0.13 liters of biodisel per m2 comparing to 0,4
liters of ethanol/m2 source of advantage is obtained by less energy production process which requires
only 10,8 MJ per liter of bio diesel while ethanol needs 17 MJ per liter of ethanol.4 While bio diesel
production realizes no CO2 emissions this is further great compensation over the lower farm potential.
Current bio diesel production is estimated to be 1.1.$ /liter what is compared to price of diesel
production at the level of crude of 60$ bbl= 0.64 liter more for 0.5 $ liter. In order to be viable bio
diesel production need to be subsidies by government. This facts brings us to conclude that no more
than 15% of bio diesel will substitute oil in the near future and will be available only in developed
countries.
Since vehicles are the most needed in the polluted cities electric cars, at first glance, seams to be
perfect substitution. Power of the electric cars lays in accumulation. But unfortunately the storage is
made of lead and can not make more than 35 Wh/kg of energy density what reduces operating radius
of the car and power of engine diminishes driving speed (what is not bad many times).Although the
cost of recharging an accumulator battery is five times cheaper than a fossil fuel it can take only 400-
700 recharging cycles what further implies each year accumulator replacement at at least 1 400$ cost.
Further and the most significant limitation of the electric vehicles is their maximum radius of 45 km
that diesel fueled engine covers with 3 liters.
3
1 t sugar corn +6.9GJ energy= 0.34 t ethanol+ 0.32 fodder + 0.34 t CO2
4
Biodisel production process 1 t oilseed rape+5.4 GJ energy = 0.44 t biodiesel+0.04 t glycerol+ 0.52 t fodder
14Today’s solar technology has no practical use due to higher cost. In household with 5 KW energy
consumption solar system worth 25 000$ is required what is the cost of 100 year average household
power consumption. Risk is bigger if we want to apply solar system in our cars facing with winter
seasons with cloudy days that need additional driving force.
Producing electricity out of wind greatly depends of location with the maximum power output
available at the wind speed of 13b m/s. The larger the surface area of the turbine and by connecting
several wind generators the more power is available. The cost of having 30-50 kW is approximately 1
500 /kW with operating costs around 0.7 c/kWh. And with price of 8 c/kWh the wind power plant
would pay off in 15 years. Risk is greater if the price falls under 7c and is highly dependent upon
weather.
Although the first successful fuel cell dates to 1932 idea of having fuel cells which directly converts
hydrogen into electric power is featured with many problems. The first and the most important one is
that fuel cells can’t operate reliably without using an unacceptable amount of platinum as catalyst.
Today’s level of platinum is 130 t/year majorities in South Africa but for the production of 1 million
cars amount of 35 t is needed. Hydrogen as a fuel of future has always been a topic that wakes an
imagination. The very nature of producing technology is interesting when we know that it is a word
about waste heat of a nuclear power plant, biomass, photo biological method using algae, or high
temperature steam dissociation using waste heat of a nuclear power plant. Drawback of this method
starts with energy of 33 kWh needed to produce 1 kg of hydrogen whose energy content is exactly the
same as input 33 kWh. Further, low density and energy value as well as slower fuelling rate than in
comparison with diesel requires massive tanks to transport. Each fuelling station would have to
produce hydrogen what requires huge unprofitable investments.
Taking all these facts into consideration we can say than only bio diesel up to 10-15% and electrical
vehicles has the chance to substitute oil in the short term. Each country is trying to go its way in
finding the solution to potential energy crises: Brazil is having ethanol almost 90%, USA is
considering removing taxes on importing ethanol from Brazil and worked on hydrogen and electrical
cars, EU has long term strategy in promotion and implementing alternative fuels.(Table 4).The goal of
the EU by 2020 is to promote and gradually implement gaseous fuels (LPG5 +CNG) up to share of
10%, bio fuels up to 8% and hydrogen up to 5%.
5
LPG = Liquefied petroleum gas
15Table 4:EU goals in implementation of alternative fuels
Year Bio fuels LPG+CNG Hydrogen Total
2005 2% 2%
2010 6% 2% 8%
2015 7% 5% 2% 14%
2020 8% 10% 5% 23%
Source: www EU.
Growing trend of auto owners continues with the GDP growth in emerging markets bringing
additional already harmful quantities of greenhouse gases into atmosphere. After first restrictions in
EU in early 70 –is of carbon monoxide (CO), further regulative follows introducing the limitations in
emissions of total hydrocarbons (HC), nitrogen oxide (NOx) and diesel engine C particles. With the
time regulations become stricter requiring all gasoline engines to have catalyst converters (1992),
limitations of emissions for both diesel and gasoline engines.6 (Table 5)
A big breakthrough was achieved by lowering the fuel lead alkyls content after limiting sulfur
compounds content and implementation of the catalyst system which converts harmful gases into
harmless one. EU member states should have maximum sulfur content of 10 mg/kg in unleaded petrol
and diesel fuel.7
Table 5:ECE regulations regarding maximum allowed vehicle exhaust emissions
Year Euro standard CO HC HC+NOx NOx PM
Passenger cars –gasoline engines
1992 Euro I 2,72 - 0,97
1996 Euro II 2,20 - 0,50
2000 Euro III 2,30 0,200 - 0,15
2005 Euro IV 1,00 0,100 - 0,08
2008 Euro V 1,00 0,075 - 0,06 0,005
Source: www EU
Attempt organized by UN Convention on Climate Change known as Kyoto protocol to reduce the
anthropogenic greenhouse effect ( carbon dioxide, methane, nitrogen sub oxide, halogenated CFC and
sulfur hexafluoride ) by 5 % until 2008-2012 compared to 1990 level was excepted fully by EU who
made herself committed to 8% reduction by the same period.
6
Directive 70/220/EEC basic directive
Euro 1 requirements (EC93)Directive 91/441/EEC (for passenger vehicle only) 93/59/eec (passenger and light
duty cargo vehicles)
Euro 2 requirements (EC96):Directive 94/12/EC or 96/69/EC
Euro ¾ requirements (2000/2005)Directive 98/69/EC supplemented by 2002/80/EC
Euro 5 requirements (2008) addaptation suggested (COM (2005)683)
7
Directive 2003/17/EC
16Having in mind that road transport contributes greatly to the global greenhouse gas emissions which
are linked to fuel combustions EU Council Directive 93/116/EEC3 requires for cars sold in Europe to
achieve an average CO2 emission figure of 140 g/km by 2008.
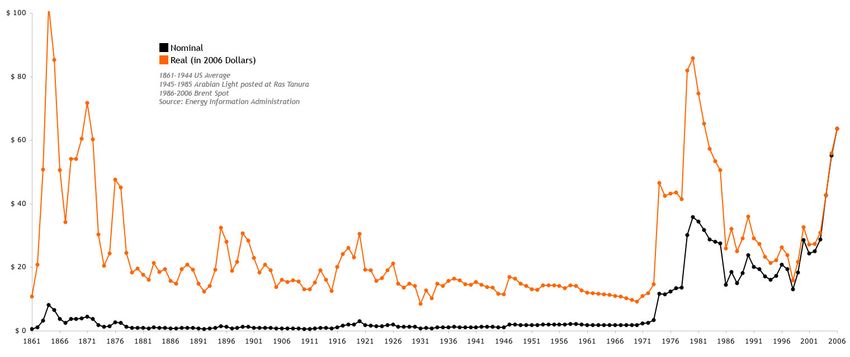
2.4 Oil prices
Although oil prices has a volatile nature (graph 5) it exhibits mean reversion tendency, but how to
exactly forecast future price movements depends upon many factors that include global, local demand
and supply, refinery margins, building new capacities, oil stocks, elasticity’s of demand and supply,
accidents or terrorist attacks etc.
Graph 5: History values of crude oil prices in nominal and real(2006)terms
Numerous studies are trying to value crude reserves and crude prices beginning with Hotteling
principle 1931 who proposed that the equilibrium return on an exhaustible natural resource will rise at
the rate of interest. Further research (Kaldor) argues that inventory holding is profitable even during
price backwardation due to a convenience yield that offsets the negative returns from storage. Latest
method is widened with the geopolitical considerations, demand and side policy, future production
costs which all explains periods of backwardation.
In this way future price equation equals followings:
F t= S t * e (r-c) (T-t)
where
F=future oil price ; S=current price ; r=interest rate ; c=convenience yield;
If the level of stocks is high r-c>0 otherwise r-c < 0
Such reasoning brought us to formula where change in prices depends upon interest rate, refinery
margin and deducted by percentage of convenience yield.
Pt –P t-1 *(1+r+q -%Cy ) = - (cy-%cy-P t-1)+v
17When considering structure of future oil products prices we should have in mind necessity of
avoidance certain level of stocks; to make possible for producer to sale his products in optimal time
in that way maximizing profit and need to smooth production in order to avoid delays, lacks of
inventory, or avoid lack of goods during bigger unannounced order.
Oil price rise is equal to required rate of return impaired for balanced net marginal percentage of
additional convenience revenue. Besides these requirements it is necessary to add expectations about
future LRMC8 levels or prices of substitutes available for consumption.
Cy = P+ v- (Stocks-Aimed Stocks)
Stocks = Stock t-1+ Production –Consumption
Aimed stocks = Balanced production
Production = b0+b1*(Pt-LRMC)+v
Consumption = co-c1*(Pt-P substitutes) +u
Great crude oil price volatility besides its significant influence on the economies worldwide further
drives oil product prices especially gasoline up. By influencing the price of products it is not irrelevant
whether is it a word about anticipating crude oil price rise ( after announcement made on OPEC
summit) or unanticipating which slower incorporates its influence in the product prices due to the
prior contract obligations, limited refinery capacities, slow systems etc. Further to note is that crude
price rise is faster implemented in the gasoline price than the other way around situation ( falling
prices ). From the graph 6 /graph 7 we can easily recognize the trend of similar movements with the
lag period of gas and heating prices with the prices of crude.
Graph 6:Log gasoline prices follows log crude prices
Source: author
Statistically this relation is best explained by ARDL relation in the form
8
LRMC =Long run marginal costs
18l gas=con +l oil +time+e
where
l gas= log value of gas; l oil=log value of crude; time= period taken e= error
Graph 7:ARDL (3,3) log gas/log oil
Source: author
There is two way link between gasoline price rise and the level of obligatory stocks in USA where
greater demand for gasoline normally influence the rise in its prices but at the same time reduces level
of stocks.How level of government stocks can further drives prices up is shown on the graph 8 and is
based on USA data :
LX4= CON +TIME+LX4(-1)+LX4(-2)+LX4(-3)+LX2+LX3
Log (government stocks FED) =Con+ Time+Log storage+Log(gas prices)+Log(crude pricese)
LX4= 2.4+0.0013 Time – 0.004134 Crude Prices + 0.032687 Log gas prices + 1.335 LOG Storage (-1)
- 0.72411 LOG Storage +0.0019 LOG Storage (-3)
Graph 8:Log storage / time, oil gasoline, storage lagged
Further help in prediction and calculation the crude price (products) prices are elasticity’s (table 6)
calculation.
Table 6:Elasticity’s of oil supply/demand
Elasticity of supply
Change in prices if 1 mbd of oil is decreased 0,025 0,05 0,075
Elasticity of demand -0,04 10,50 7,58 5,93
-0,08 6,50 5,25 4,40
-0,12 4,71 4,01 3,50
193. OIL AND MACRO ECONOMY
Economists around the globe especially in USA offered wide scope of different explanation how oil
prices hike hurt economies. The most basic explanation is classical supply shock where oil prices
reduces availability of an important input to production. The second explanation starts from the fact
that rising oil prices results in income transfers from oil importing to oil exporting nations. The others
argue that monetary authorities responds to rising oil prices with the contraction monetary policy that
boosts interest rates. The last but not least consequence of the oil price rise is that growing prices
leads to increased money demand as people try to direct their portfolio toward liquidity. If this desire
is unsatisfied interests rates hikes. Rising interest rates is slowing down economic activity.
Classical supply shock starts with reasoning that higher oil prices induce scarcity of energy which is
basic input to production. Smaller input to work means reduced output productivity and necessity for
labor. Real wage growth is reduced while larger number of unemployed is present on the market. If
consumers expects rise in oil prices to be temporary they smooth their consumption by saving less or
try to borrow more. Their actions have for result higher interest rate, fall of demand for real cash
balances and prices to rise. Higher oil prices reduce real GDP, increase interest and price levels.
(Graph 9 )
The second strong explanation starts with shift of income from oil importing to oil exporting countries.
The rise in prices reduces purchasing power and consumer demand in oil importing countries. But, the
increase in the consumer demand in the oil exporting countries has been less then the reduction in
consumer demand in the oil importing nations. This further increases savings putting down interest
rates which further stimulates investment partially offsetting lower consumer spending while partially
restoring aggregate demand. On net aggregate demand is lower what further reduces prices. Economic
theory suggests that real prices will continue falling until aggregate demand and GDP are restored to
pre shock levels. If nominal prices are sticky down the process of adjustment will not take place and
aggregate demand and GDP will not be restored unless unexpected inflation increases as much as
GDP growth falls.
20Graph 9 : Macroeconomic consequences of the oil price rise (IS/LM curve)(AD/AS curve)
Source: Macroeconomics,Bronstain
The role of monetary policy was one of the basic explanations how the oil prices affect economic
activities than abandoned due to classical supply shock scholars, to the same rate at which be
returned to during the 90-ies. It is known that restrictive monetary policy results in rising interest
rates, reduces GDP growth and inflation, but this was not consistent with the history record. When
monetary authorities hold the growth of nominal GDP constant the inflation rate will accelerate as real
GDP growth slows. To the extent that the market is slow to adjust to monetary surprises a more
accommodative monetary policy (by interest rate reduction) offsets losses in GDP while at the same
time increasing inflationary pressure. A restrictive monetary policy of rising interest rates would
temporarily intensify the losses in real GDP while it reduces inflationary pressure.
21Graph 10 follows the crude price movements with main macroeconomic variables in the USA. It is
clearly visible that oil hikes was strongly followed in the periods in mid 1970 by rise in
unemployment, inflation and interest rates slowing economic growth. However, it is noticed weaker
influence in the late 1990 last century due to numerous factors such as growing central banks
credibility, smaller oil intensity, renewable. Period since 2001 brought us war in Iraq proving that
relation between the oil and USA economy is still of great influence.
Graph 10: Oil prices and level of unemployment /inflation/ interest rates / in the USA
Source:author
Real influence of oil and certain economies is dependent upon oil dependencies, reserves,
consumption and demand and extent to which it will hurt economy depends upon sum of these factors.
Oil demand and supply elasticity’s are then further broaden with following considerations.
22If the oil is firmly embedded into technology and capital equipment and it is hard to change fuel oil
firm can not vary energy/output ratio in the short run, we are faced with additional adjustment costs
that further retard economy.
Further potential treat that could increase crises comes from sect oral imbalances. Individual firms
understand how their output is changed under different price values, but don’t know how competitors
will react. The result could be over or underproduction of certain goods.
In the uncertain times a few people are willing to invest in the long term capital especially if the oil
technology is strongly embedded. In addition to this, uncertainties about credit and future interest rates
give rise to fear of new investments and further weaken economic activity.
234. OIL COMPANIES
Oil companies are in the very center of the oil business. They explore, invest, operate, determine
prices of numerous oil products and have wider margins across narrow regions than expected to be.
Having in hands product that the most cars today need they are in charge of transportation costs to
many. Having no real competitor especially in transport sector, faced with higher and higher gasoline
prices oil companies are making rocketing profits. How they have used they advantage position on the
market is to be explored as follows. Significant players on the energy market are USA, Saudi Arabia,
Russia, China, Canada, India and European Union and some of their characteristicks and companies
are briefly examined.
4.1 Russia
Russia’s oil production in 2006 was 9.769 thousands barrel per day what is 2.2% increase to previous
year. Comparing it to the total world production of 3 914 mil ton, it reaches 12,3% making it the
second largest, following Saudi Arabia, having 13,1% , oil producer. From the large discrepancy
between production and consumption ( 2 735 thousand barrels daily )9 what is only 3,3 % in the world
total oil consumption we can conclude that the Russia is significant oil exporter too. Although there
has been a smaller revaluation of existing reserves to up of 0.6% in 2006 comparing a year before
Russia still holds 6,6% of world reserves amounting 79,5 thousand million barrels. Refineries in
Russia are able to produce 5 491 thousand barrels a day what is still only 6,3% of the world capacities
levering 15 081 thousand barrels a day.
What Russia’s economy and people have had from this increased production and not insignificant
energy wealth particularly oil reserves? Graph 11 shows Russia’s GDP per capita comparing to the
same fact in other neighborhood East European countries. Low level among the smallest in the row
with Belarus and Moldova shows that macro economy didn’t gain much leaving people of Russia
among the poorest in Europe.
Graph 11 :GDP per capita in Russia
25000
20000
15000
10000
5000
0
0
2
74
76
78
80
2
4
6
8
0
92
94
96
98
0
2
4
7
7
8
8
8
8
9
0
0
0
9
19
19
19
9
9
9
9
9
9
19
19
9
9
9
0
0
0
1
1
1
1
1
1
1
1
1
1
2
2
2
Europe Eastern Europe Belarus
Bulgaria Cz ech Republic Cz echos lov akia (Former)
Hungary Poland Republic of Moldova
Romania Rus sian Federation Slov akia
Ukraine USSR (Former)
9
Russias oil consumption in 2006 is 128,5 million tonnes
24The other main macroeconomic factors observed (Table 7) shows high levels with decreasing trend
inflation and real appreciation of the domestic currency.
Table 7 :Macroeconomic environment in Russia
2001 2002 2003 2004 2005
Ruble inflation (CPI), % 18,8 15,1 12 11,7 10,9
Nominal appreciation / (devaluation)
of the exchange rate (RUR/USD), % -7 -5,5 7,3 5,8 -3,7
Real appreciation of the
exchange rate (RUR/USD), % 11 9,2 20,8 18,5 6,9
Average exchange rate
for the period, RUR/USD 29,17 31,35 30,69 28,82 28,29
Graph 12: Macroeconomic variables in Russia
The relation between the main macroeconomic variables and factors relating Russian oil industry
statistics are presented by linear relation in ordinary least square method.(Graph12)
Positive relation is observed to be strong between the household consumption on expenditure and oil
prices, final consumption, manufacturing, imports of goods and services with adverse relation noted
to be strong between oil prices and exports of goods and services, government final consumption,
gross capital formation and other activities.
crude price= 01*CON + .97647*final consumption on expenditure + 9.7080*household consumption on
expenditure -.0084485*government final consumption -.0041555*gross capital formation -.0098843*gross fixed
capital formation -.015682*exports of goods and services + .0056235*imports of goods and services +
.013575*manufacturing -.0040263*other activities -.040509*oil production
Crude price increases with increases in oil production, but are negatively related to consumption.
Additional caution and highly likelihood of Dutch disease symptom in Russian society that states that
natural resources wealth and increased production corroborated with huge profits from rising prices
actually decreases manufacturing and future prospects of the country.( should be carefully examined
and monitored by Russian Government). In other words that means necessity to redirect the Russian
current policy in relaying on natural wealth solely and not developing agriculture, industrial
production leaving Russia dependent on very aggressive store chains that placed their products
worldwide. Time lost in not opening the large number of store chains filled with Russian commodities
25is time won by foreign chains that aggressively markets their products. Not storing oil and inputting it
in industry while knowing the exhaustible oil nature leaves the country to be dependent on imports for
majority of products and with confused future.
Although Russia explores and enters into daring adventures in order to push the human and natural
boundaries by exploring and bringing some good revealing news, it current economic policy of
exporting and not producing leads Russia into dead end. The second huge mistake is done by constant
tax rule uncertainties and payment made by oil companies are not allocated transparently in some
other energy sources like wind, solar, geothermal, tidal, hydro etc…
crude price = 1.4848*CON + .12004*oil production -.16250*oil consumption
The following equation stresses the oil pice dependence on the past values (lagged value) that is
strongly positively related to current future levels.
Oil prices = .50601*B(-1) -2.4226*CON + .084779*oil production -.11461*oil consumption
Negative intercept value implies very low level of GDP per capita in Russia that is very dependent on
oil prices and production. Much smaller influence is observed on GDP per capita on oil production
than on consumption. It can be explained by huge oil export whose profit is shared amonge a few,
while consumption is implied by increased goods production and rised standard for many.
GDP capita = -1348.3*CON + 82.3461*crude prices + 1.7677*oil production + 12.0411*oil consumption
GDP per capita is positively related to gas production, electricity generation and coal consumption
factors that all influence geatly standard of average Russian person.
GDP capita = -13860.3*CON -4.2006*prim.energ.con + 34.3990*gas produc. -8.5061*gas con.-
40.1920*coal prod.+ 4.4487*elect.gen. + 83.7801*coal.con. + 103.0575*crude prices
To increase and modernize refinery capacity should be one of the Russian goals but to rely the future
GDP solely on oil prices could lead Russia into further material and moral degradation.
GDP capita = -21952.7*CON + 7.8526*proved reserves + 4.9735*refinery capacity -60.2241*oil con. +
6.8161*oil prod. + 71.7677*crude prices
Government consumption is positively related to the GDP and oil consumption but negatively with oil
prices.
Gen.gov.con = -40614.2*CON + .65617*GDP capita + 23.0278*oil con. -112.2935*crude prices -
17.5983*oil prod. + 71.5800*prim.energ.con.
Final consumption is negatively effected by high oil prices but positively with primary energy
consumption.
Fin.con.on expen.= -37.3760*CON + .0023896*GDP capita -.039527*oil con. -.14660*crude prices -
.039262*oil prod. + .087754*prim.energ.con.
Household con. = 113.6996*CON -.0020253*GDP capita -.052628*oil con. + .24576*crude prices +
.078333*oil prod. -.21155*prim.energy.con.
Gross capital formation is directed toward oil industry capacity increase.
26Gross cap.form. = 88398.2*CON -1.9786*GDP capita -213.4183*oil con. + 142.3198*crude prices +
3.2949*oil.prod. -124.3761*gas.prod.
Gross fixed capital= 80326.0*CON -1.7393*GDP capita -187.4537*oil cons. + 126.4067*crude prices +
47.8651*oil prod. -114.0599*prim.energ.cons.
Strong relation between the oil consumption and production with change in inventories is observed.
Change in inventories = 4.50E+10*CON -1631789*GDP capita + 2.58E+08*oil cons. + 2.00E+08*crude
prices + 6.15E+07*oil prod. -1.56E+08*prim.energ.con
Exports of goods is related to high oil prices and energy is the main source of export trade.
Exports of goods/s. = 18396.6*CON -.11823*GDP capita + 129.4800*oil cons. + 28.2829*crude prices +
13.7394*oil prod. -1.8060*prim.energy.con.
Import rises with the GDP increase but is inversely related to crude prices.
Imports goods/s. = -61439.5*CON + 1.4469*GDP capita -24.2427*oil cons. -142.1914*crude price -
51.8519*oil prod. + 130.7914*prim.energ.prod.
Agriculture, hunting, forestry, mining, utilities and manufacturing are positively related to the GDP per capita
but not related to the oil industry sector.
Agriculture, hunting, forestry = -1.58E+11*CON + 3479210*GDP capita -3.47E+07*oil cons. -
3.44E+08*crude prices -1.28E+08*oil prod. + 3.28E+08*prim.energy.cons.
Mining,manuf,utilities = -61403.0*CON + 1.4720*GDP capita -30.3963*oil cons. -142.4551*crude prices -
53.3615*oil prod. + 132.7528*prim.energy.cons.
Manufacturing = -51070.1*CON + .95953*GDP capita + 27.4726*oil cons. -126.1906*crude prices -
30.5165*oil prod. + 93.9817*prim.energy.cons.
Construction = -1.23Household cons.exp.+11*CON + 3422503*GDP capita -1.44E+08*oil.cons. -
3.25E+08*crude prices -1.19E+08*oil prod. + 2.89E+08*prim.energy.cons.
Trade, transport and storage are not related to the GDP per capita, while although GDP is rising, the
trade is mostly related to the energy export.
Wholesale, trade= 86231.2*CON -1.9508*GDP capita -185.4004*oilcons. + 142.8935*crude prices +
52.7457*oil prod. -126.1570*primary.energy cons.
Transport,storage, = -1.37E+10*CON -1467613*GDP capita + 2.73Household cons.+08*oil cons. +
1.71E+08*crude prices + 8131594*oil prod. -3.58E+07*prim.energy cons.
Primary energy consumption is mostly related to the coal and gas consumption and is not significantly
related to the oil prices.
Prim.energ.cons. = 462.7854*CON -.30646*crude prices + .0043918*GDP capita +.78209*coal cons. +
1.1815*gas cons. -.057492*refin. consum.
Amonge the most significant oil companies that operates in Russsia as well as worldwide are Lukoil,
Rosneft,Transneft and TNK-BP and some basic operating results are shown as follows.
274.1.1 Lukoil
Very high level of proved oil reserves 20,8 % inland, production 18,36 % inland and refinery output
18,75% inland (Table 8 ) makes Lukoil one of the largest oil conglomerates in Russia and significant
energy subject in the world. Although the majority of Lukoil production is directed toward export it is
valuable to examine its influence on the local macro economy in the periods of high oil prices.
Table 8 :Lukoil’s business data in year 2005
2005
Internationally % Inland %
Proved oil reserves 1,34 20,8
Proved gas reserves 0,4 1,3
Proved hydrocarbon reserves 0,9 5,4
Oil production 2,21 18,36
Gas production 0,27 0,89
Hydrocarbon production 1,53 9,27
Refining capacities 1,37 15,5
Refinery throughputs 1,29 18,05
Production oil wells in country 17,4
Oil exports 18,94
Petroleum product exports 17,21
Source: lukoil.com
More than half of the all reserves amounted 29 319 mil are proved out of which 36% are (8572 )
developed and 19% undeveloped sites situated largely in Western Siberia (8572), Urals (2170) Volga
region (468) and Timina Pechora (3833 ). (Table 9)
Lukoil produced in 2005 significant amount of 90 158 thous.ton10 out of which majority is produced
in country that is 619 mil ton barrels.
Table 9 :Lukoil’s reserves
2005 mil ton %
Proved 16114 0,55
Developed 10583 0,36
Undeveloped 5531 0,19
Probable 8869 0,30
Possible 4336 0,15
Total 29319 1,00
Total Proved Reserves 16114 %
Russia 15500 0,96
Western Siberia 8572 0,53
Urals 2170 0,13
Volga 468 0,03
including Caspian 183 0,01
Timan-Pechora 3833 0,24
Bolshekhetskaya Depression 203 0,01
Other 254 0,02
International 614 0,04
10
664 mil ton barrels that is 247 thousand tons per day ;1820 thousand barrels per day in 2005
28Catalalytic Hydro treating and vacuum distillations (Table 10) are the most used production operations
in refineries in Nizhny Novogord and Burgas.
Table 10:Refinari’s production
Catalytic Catalytic
Vacuum11 Thermal Catalytic14 hydrocra Hydrotrea-
Crude distillation Coking12 operations Catalytic cracking13 reforming cking15 ting
Perm 244,2 109,2 15,8 – 13 28,7 64,8 143
Volgograd 217,7 95,2 23,9 – – 10,1 – 74,5
Nizhny Novgorod 304,1 127 – – – 47,1 – 150,1
Ukhta 75,3 18,1 – – – 9,1 – 28,7
Burgas 216,9 78 – 29,8 33,4 14,4 – 101,8
Ploiesti 49,3 21,8 10,3 – 18,5 12 – 50,7
Odessa 73 20 – – – 10,1 – 44,9
Total 1180,5 469,3 50 29,8 64,9 131,5 64,8 593,7
Source: lukoil.com
Sulphur and hydrogen are the significant products accompanied by bitumen, lubricants, aromatics
production in Lukoil refineries across Russia (Table 11). Since the 2003 diesel fuel production raised
significantly ahead of fuel oil. These products are produced in front of motor gasoline, heating oil,
bitumen, lubricants, ship oil, and coke. (Graph 13)
Table 11: Production capacity th barrels per day Lukoils Refineries
Production capacity Isome Lubri Oxy Hydrogen, Sulfur,
, th. barrels per day Alkylation16 Aromatics rization17 cants genate mcf per day tons per day Bitumen
Perm – 6,7 – 9,4 – 67,8 213,7 12,1
Volgograd – 7,8 – 8,9 – 62,3 111,8 4,2
Nizhny Novgorod – – 11,8 4,5 – – – 20,7
Ukhta – – – – – 11,9 11 4,4
Burgas 5,1 3,6 – – 1,9 17,9 160,6 4,3
Ploiesti – – 3,5 – – 4,6 34,2 –
Odessa – – 3,2 – – – 21,1 3,5
Total 5,1 18,1 18,5 22,8 1,9 164,5 552,4 49,2
Source: lukoil.com
11
Vacuum Distillation-heavy crude residue(„bottoms“)from teh atmospheric column is further separated using a
lower pressure distillation process.Means to lower the boiling points of the fractions and permit separation at
lower temperatures,without decomposition and excessive coke formation
12
Coking-Thermal noncatalytic cracking process that converts low value oils to higher value gasoline,gas oils
and marketable coke. Residual fuel from vacuum distillation column is typical feedstock.
13
Catalytic Cracking-A central process in refining where heavy gas oil range feeds are subjected to heat in the
presence of catalyst and large molecules crack into smaller molecules in the gasoline and surrounding ranges.
14
Catalytic Reforming-The process wherby naphthas are aganged chemically to increase their octane
numbers.Octane numbers are measures of whether a gasoline will knock in an engine.The higher the octane
number,the more resistance to pre or self ignition.
15
Catalytic Hydrocracking-Liek cracking used to produce blending stocks for gasoline and other fuels from
heavy feedstocks.Introduction of hydrogen in addition to a ccatalyst allows the cracking reacction to proceed at
lower temperatures than in catalytic cracking.although pressures are much higher
16
Alkylation-Important process to upgrade light olefins to high value gasoline components.Used to combine
small molecules into large molecules to produce a higher octane product for blending with gasoline.
17
Isomerization-Process used to produce compounds with high octane for blending into gasoline pool.Also used
to produce isobutene an important feedstock for alkylation
29Graph 13: Lukoil’s production
35
30
25
20
15
10
5
0
2001 2002 2003 2004 2005
Motor gasoline Diesel f uel Jet f uel Ship f uel
Heating oil Vacuum gas oil Naphta Fuel oil
Bitumen Lubricants Coke Other
In addition to basic production data it is valuable to examine the financial statements and learn
something more about company. In 2005 crude oil sales amounted 46 588 thousand tons what is 123%
more comparing it to 2001 (38.009) out of which 98,5% went to export and sales on international
markets. In dollar terms it means revenue of 19.487 million dollars gained 333% more than it was in
2001 ( 4 943 mil $). (Table 12 )
Table 12:Lukoil’s financial data
Crude oil sales Crude oil sales Crude oil sales
2005 mil USD 2005 thousand tons
Export and sales on international
markets 16367 45916
Including export and sales to CIS 778 3254
Domestic sales 120 672
Total 16487 46588
Source:lukoil.com
From the Consolidated Income Statement it is further to establish that sales increased 415% in four
years period while net income jumped to 305% up. (Table 13 )
Table 13:Consolidated Income Statements, mln USD
2001 2005 2005/2001 %
Sales (including
excise and export tariffs) 13426 55774 415,417846
Total revenues 13562 56215 414,5037605
Cost of purchased crude
oil and petroleum products -2087 -19398 929,4681361
Net income 2109 6443 305,5002371
Source:lukoil.com
Major Balance Sheet positions doubled leaving the current liabilities under control that only increased
158% making shareholders equity to rise for 254%. (Table 14 )
30Table 14:Balance Sheet Data
2001 2005 2005/2001 %
Total current assets 6.094,00 12.497,00 205,0705612
Total assets 17.109,00 40.345,00 235,8115612
Total current liabilities 3.692,00 5.836,00 158,071506
Total liabilities 6.590,00 13.541,00 205,477997
Total stockholders' equity 10.519,00 26.804,00 254,8150965
Total liabilities and
stockholders' equity 17.109,00 40.345,00 235,8115612
Source:lukoil.com
Very high percentage of return on equity 27% and assets 18%, current ratio of 2,14 and P/E of 7,9
makes Lukoil very interesting to potential share buyers who could be confident with small debt/capital
ratio of 15%, market capitalization of 50 523 mil.USD , future prospective of oil prices, demand for
crude and products to gain significant profit out of company. (Table 15)
Table 15: Financial ratios in 2005, Lukoil
2005 2005
Market capitalization, mln USD 50523 EBITDA interest coverage 37,8
Long-term debt, mln USD 4137 Free cash flow, mln USD 1920
Short-term debt, mln USD 853 Sales, mln USD 55774
Cash and cash equivalents, mln USD 1650 Assets, mln USD 40345
EV, mln USD 53863 Asset turnover, days 264
EV/EBITDA 5,18 Accounts payable turnover, days 14
EV/DACF 8,5 Accounts receivable turnover, days 36
Share price, USD 59,4 Sales, mln USD 55774
Basic earnings per share, USD 7,91 Operating income, mln USD 9388
/E 7,51 Income before tax, mln USD 8910
Market capitalization to sales 0,91 Net income, mln USD 6443
Market capitalization to assets 1,25 Operating margin, % 16,8
Market capitalization to equity 1,88 Pretax margin, % 16
Cash ratio 0,28 Net margin, % 11,6
Quick ratio 1,25 EBIT, mln USD 9089
Current ratio 2,14 Return on equity, % 27,1
Assets to equity 1,51 Return on assets, % 18,4
Total debt to EBITDA, % 48 ROACE, % 23,3
Total debt to capital, % 15,7 Total debt to equity, % 18,6
Source:lukoil.com
31You can also read