DOES SINGAPORE HAVE CLEAN AIR?
←
→
Page content transcription
If your browser does not render page correctly, please read the page content below
Review of Singapore’s Air Quality and Greenhouse Gas Emissions:
                Current Situation and Opportunities

DOES SINGAPORE HAVE CLEAN AIR?
What do we know about Singapore's air quality and
          greenhouse gas emissions?

                                               Erik Velasco
                                            evelasco@smart.mit.edu

               ESI SEMINAR
               Oct. 27, 2011.
Outline

1. Singapore’s Air Quality and Greenhouse Gas Emissions
   Air quality assessment
              Ambient monitoring
              Emissions inventories (air toxics and greenhouse gases)
              Air quality modeling
              Health impacts

2. CENSAM’s projects on urban atmosphere

   Sources and sinks of CO2 in a urban neighborhood of Singapore
   Characterization of inhalable particles in selected microenvironments
   of Singapore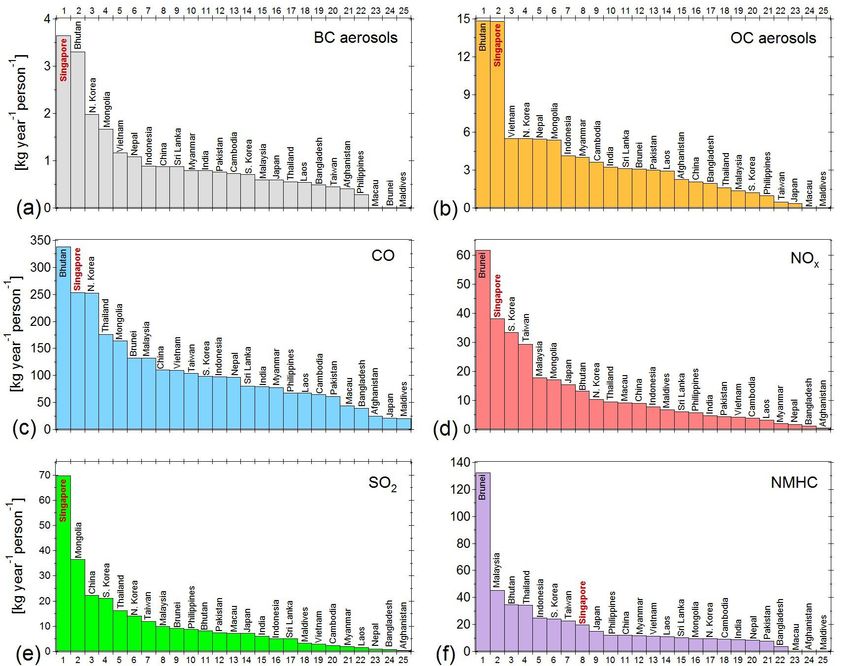
Air Quality Assessment
                               Ambient
                              Monitoring

                             Environmental
                                policies

                 Emissions                     Modeling

                         Scientific research
                             Public health
                              Economy
                             EDUCATION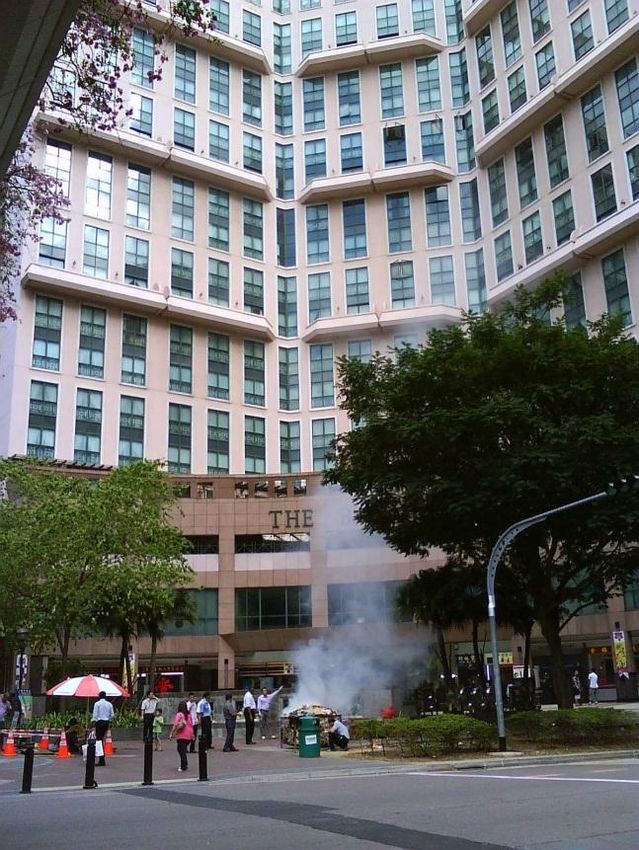
Sustainable Development
         Blueprint
                        April 8th, 2009

  Singapore’s air quality
  compares well with major
  cities with our PSI being in the
  “good” range for 96% of the
  days in 2008

Air pollution goals for 2020:
• PM2.5 from 16 µg/m3 to 12 µg/m3
• SO2 → 15 µg/m3 (~6 ppb)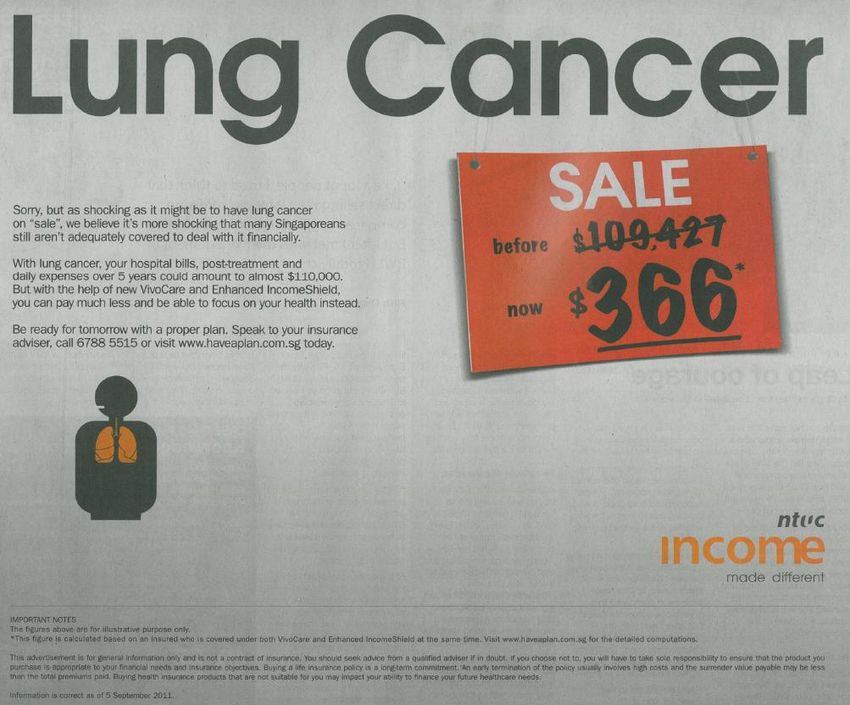
http://app2.nea.gov.sg/psi_accessibility.aspx
Key environmental statistics 2011 USEPA
NAAQS
365
80
100
40
10
150
150
35
15
0.15
PM2.5
2007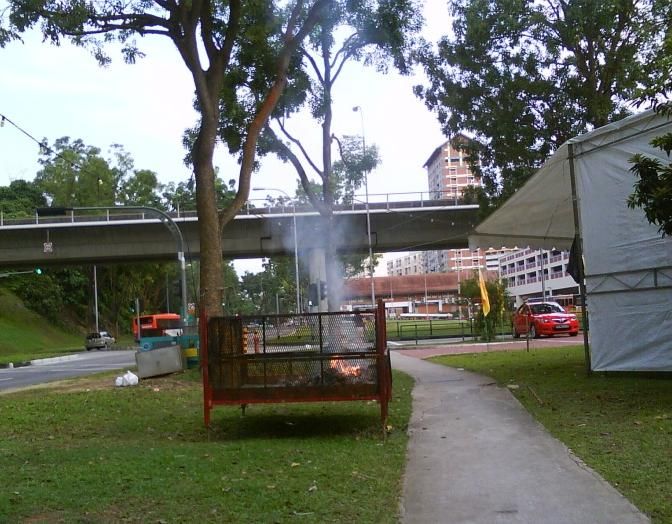
Diurnal
                                                                   variability                  ?
                                                                Diurnal cycle of CO and O3 in Mexico City,
                                                                averaged for all stations over 2001–2007
 Stephens et al., Atmos. Chem. Phys., 8, 5313–5325, 2008

O3
                                               Spatial
                                              variability   ?                  VOCs
                                                                               PM1

     Air Quality in Mexico City
     Report 2009
                                                                               mercury
                                                                               PAHs
                                                                                                    ?
                                                                               toxics
     Seasonal
     variability                  ?         CO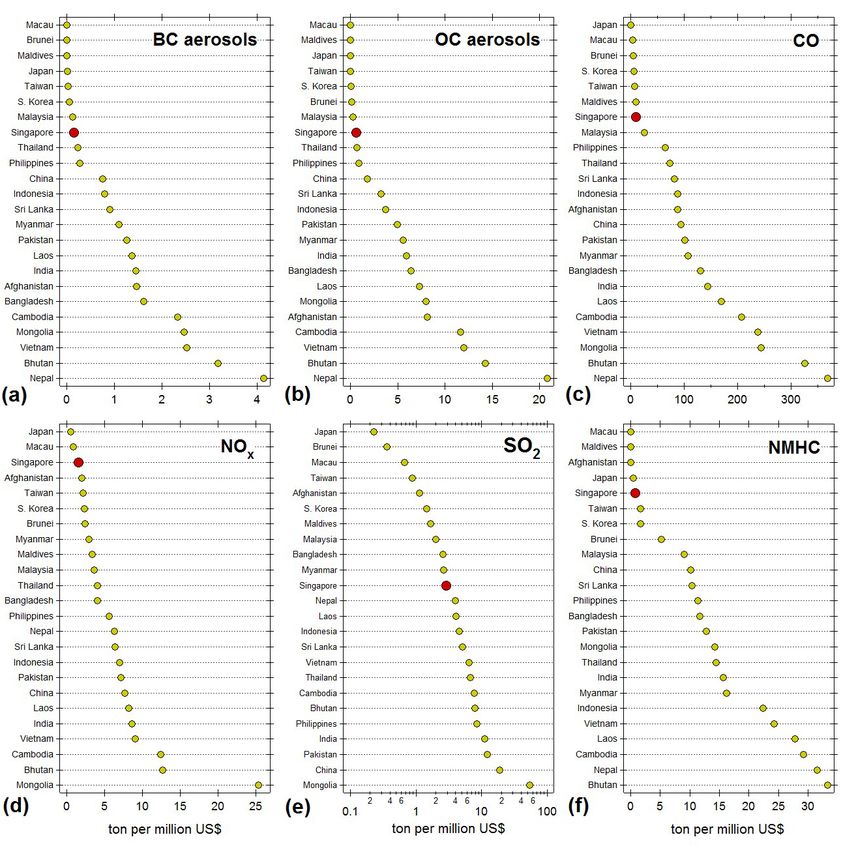
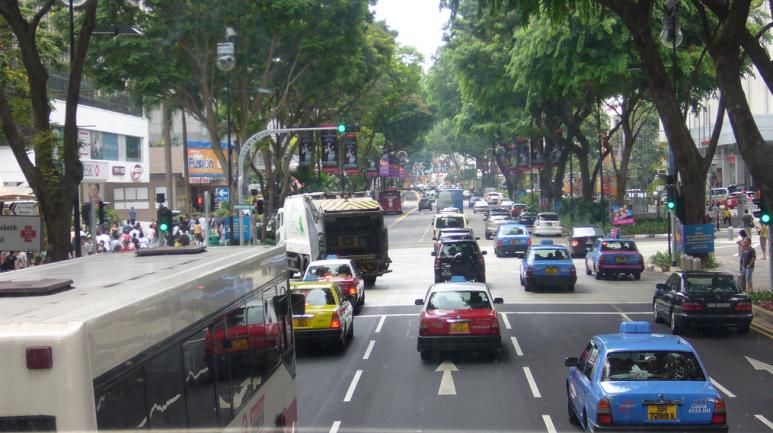
Emission sources

         Second world busiest seaport

                                       Highly
                                       industrialized
                                       economy
                                  ~1 million vehicles
                                                        62.4 km/h Expressways
                                  Average speed
Major aviation hub in Southeast                         26.9 km/h Arterial roads.
Asia (4,340 weekly flights) Fake money burning
                                      The second most
                                      densely populated
                            Wildfires country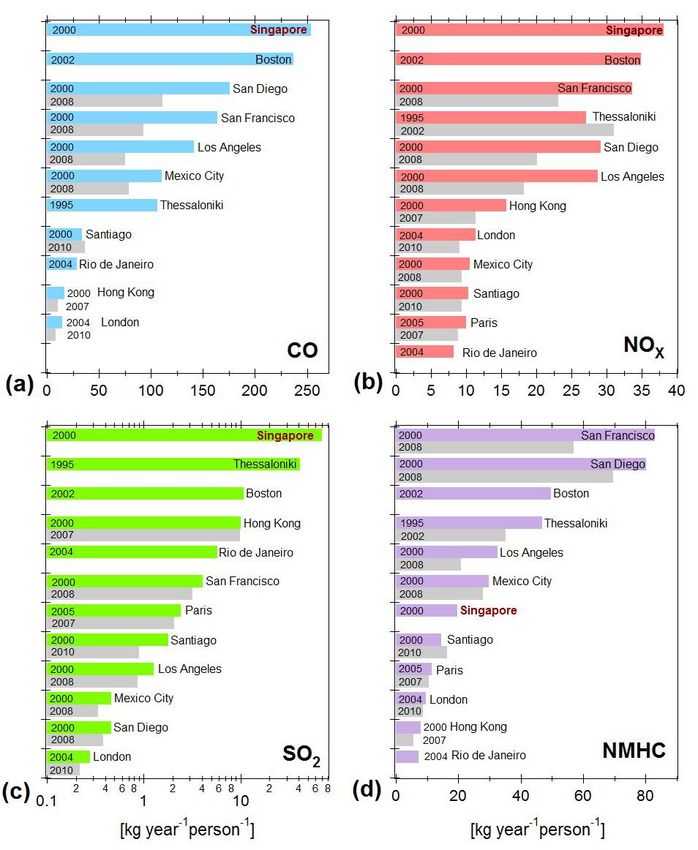
does nature
   NO
contribute to air
   pollution?
Ozone
Organic aerosols
Secondary pollutants
Oxygenated volatile organic compounds
Peroxyde radicals
And many other toxic compounds
Taken from Andeae (2009), Science 326, pp. 1493
Precursor gases from primary emissions undergo chemical reaction forming secondary organic
aerosols (SOAs) in the atmosphere. Organic aerosols are also emitted directly to the atmosphere
and are know as primary organic aerosols (POAs). SOAs and POAs react and mix with each other
as well as with inorganic aerosolsAnthropogenic emissions from
combustion and non-combustion
sources @ 2000
SO2 + CO +NMHC + NOx +BC +OC
Ohara et al., An Asian emission inventory of anthropogenic
emission sources for the period 1980–2020, Atmos. Chem.
Phys., 7, 4419–4444, 2007.Anthropogenic emissions from
combustion and non-combustion
sources
Ohara et al., Atmos. Chem. Phys., 7, 4419–4444, 2007.Emissions per capita National level @ 2000
Emissions per capita
       City level
Emissions per GDP Anthropogenic emissions normalized by GDP. The national emissions were taken from Ohara et al. (2007) and divided by the corresponding country GDP using as reference the year 2000. The GDP data (in 2005 US dollars) were obtained from the International Macroenomic Dataset compiled by USDA-ERS (2010).
Singapore’s National Climate
   Change Strategy, 2008
CO2 anthropogenic emissions
              per capita

The national CO2 emissions correspond to the emissions reported in the United Nation’s Millennium
Development Goals Indicators updated on July 2011 (UN, 2011). The per capita carbon footprints include
contributions of CO2, CH4, N2O and F, and were adapted from (Hertwich and Peters, 2009).
Both, CO2 emissions and carbon footprints consider only contributions of fossil fuels and process emissions.
Emissions related to land-use change are excluded. The CO2 emissions do not include emissions of international
bunkers.
Sijori Growth Triangle
~8 million inhabitants
1.8 million
5 million
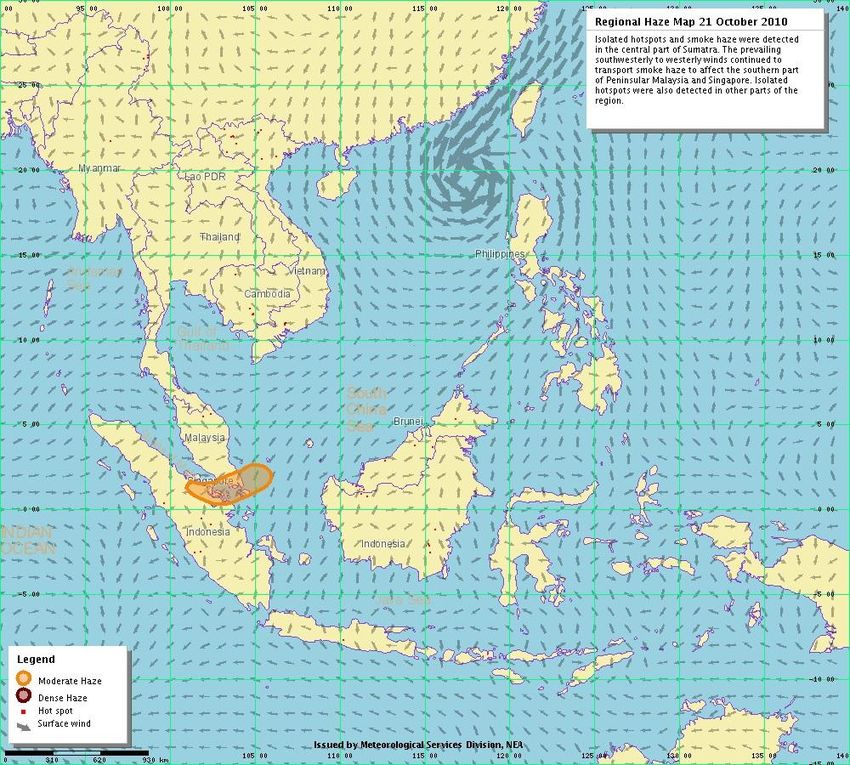
1 millionHybrid Single Particle Lagrangian Integrated Trajectory (HYSPLIT)
model of NOAA’s Air Resources Laboratory
Yahoo! Singapore News
Transboundary The 24-h average PM10 concentration was ~150 µg m-3,
smoke haze reaching a maximum 3-hours average of 166 µg m-3 (PSI =
108, unhelthy conditions) on October 21 at 6 p.m.
Oct. 20-22, 2010~5% of adults and 20% of
children have asthma.
Prevalence of asthma in
children aged 13-14 years
Singapore 24%
USA 18%
Taiwan 13%
Malaysia 12%
Hong Kong 11%
Sept. 2011 (Pearce et al., 2007)
Cancer-related deaths have increased from 15% to 27% in the
last 30 years, with lung cancer the leading cause of cancer in men
and the second most common in women (Seow et al., 2004).DOES SINGAPORE HAVE CLEAN AIR? Singapore is far from being a smoky and polluted industrial city. However, due to the lack of publicly available air quality data, we cannot conclude that Singapore has clean air. Science-based air quality management following a multi- pollutants approach will help Singapore continue to improve its air quality, promote financial investment, local economic growth and increase international competitiveness. At the same time Singapore will reinforce its position as a livable and more sustainable city, with the unique opportunity of leading air quality and greenhouse gas management in Southeast Asia.
BUILT & NATURAL
               ENVIRONMENT

                                                   Air quality
            Urban atmosphere                       Greenhouse gases

                                                   Climatology

 Characterization of     Flux measurements    Urban heat island
inhalable particles in    of CO2 and energy
      specific
 microenvironments
Flux measurements of
CO2 and energy
Telok Kurau, Singapore
22 m
Diurnal CO2 fluxes. The black line correspond to the average flux measured
during one year and the dashed lines indicate ±1 standard deviation of the
observed fluxes. The shaded areas are the estimated emissions by bottom-up
Eddy Covariance System approaches (i.e. emission factors and activity data).Characterization of inhalable particles in
selected microenvironments
The purpose of this study is to obtain Results from this study will provide information
information on the chemical and physical to the corresponding environmental and health
properties of inhalable particles in selected agencies to evaluate existing air toxics
microenvironments of Singapore using regulations and to identify areas of potential
portable and real time monitors. improvement in their air quality programs.
PM1, PM2.5, PM10 Particles # CO CO2
Conc.
Langan
pPAHs & Active T15n LI-840 &
DustTrak Surf. Area
CPC Black carbon CR1000
TSI 8534 Position
TSI-3007
Garmin
Photoelectric Aerosol Sensor GPS
& Diffusion Charger Microaethelometer
PAS 2000CE & DC2000CE MS AE51Passenger cars: 394 h-1
Taxis: 248 h-1
Aerosol pollution in Motorcycles: 105 h-1
Temp.: 27.7 ± 0.7°C
Buses: 69 h-1
bus stops Light good vehicles:
Heavy good vehicles:
195 h-1
33 h-1
RH: 78.3 ± 2.9 %
TOTAL: 1044 h-1
Little India
Jan. 13, 2011Aerosol pollution in bus stops The horizontal lines denote median, boxes denote 25th abnd 75th percentiles, and whiskers denote 5th and 95th percentiles.
Aerosol pollution in
selected
microenvironments Around Chinatown Indian temple Chinese temple Courtyard Chinese temple
Bus stop Along Orchard Rd. Hawker center
Offerings burner Incense burner
Particle # Act. Surf. Black
PM2.5 pPAHs CO PM2.5/PM10 PM1/PM2.5 BC/PM1 pPAHs/PM1
Site Conc. Area carbon
(µg m-3) (ng m-3) (ppm) (%) (%) (%) (ng µg-1)
(×103 # cm3) (mm2 m-3) (µg m-3)
Bus stop
(VivoCity)
102±28 97.6±19.0 339±89 502±215 25±13 1.4±0.4 90±4 98±1 33±9 2.8±0.5
Along Orchard Rd.
(Pedestrian)
45±28 48.9±21.6 146±96 108±99 10±10 --- 80±9 98±1 24±27 2.5±2.2
Hawker center
(Food-street Chinatown)
200±156 107.2±48.3 427±305 39±14 11±8 0.9±0.8 93±4 97±1 9±12 0.3±0.3
Around Chinatown
(2011 Chinese New Year)
52±11 31.7±14.9 113±79 29±17 3±2 --- 83±5 93±1 6±4 0.6±0.3
Inside Indian temple 55±29 23.5±3.9 120±124 22±9 3±2 --- 83±6 93±2 6±4 0.5±0.2
Inside Chinese temple 101±7 137.5±5.6 142±38 39±3 3±1 --- 96±3 99±0 3±2 0.4±0.0
Courtyard
123±38 91.8±28.9 145±60 56±14 4±2 --- 91±5 98±1 3±2 0.5±0.2
Chinese temple
Offerings burner
952±3873 48.4±30.7 328±291 123±123 16±29 --- 93±5 97±2 11±15 0.9±1.1
Indian temple
Incense burners
3661±8196 143.6±20.3 1115±382 415±298 19±28 --- 99±1 100±1 2±3 0.4±0.5
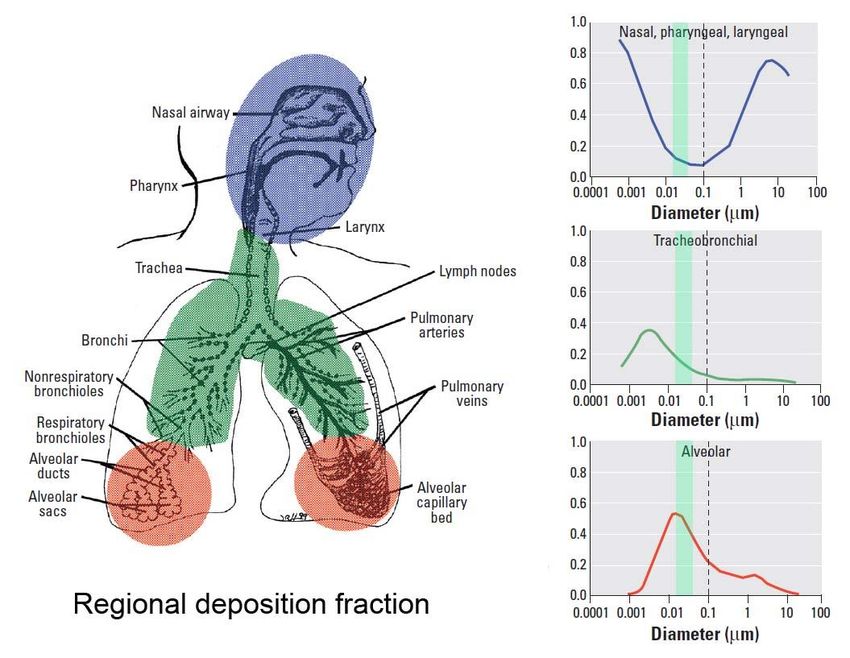
Chinese templeDiameter of average surface
Bukowiecki et al., 2002, Aerosol Science 33, 1139.
Taken from Oberdörster et al. 2005, Env, Health Persp. 113, 823Thanks for your attention
Leslie Norford Matthias Roth
Rex Britter Michelle Quak
Sok Huang Tan
Erik Velasco evelasco@smart.mit.eduYou can also read