Dotabase: a Dota 2 Database Visualizer
←
→
Page content transcription
If your browser does not render page correctly, please read the page content below
Dotabase: a Dota 2 Database Visualizer
Francis Tang (fltang)
Alan Hsueh (athsueh)
Abstract
Our project, “Dotabase” serves to be a tool for new and veteran players of the game,
“Dota 2.” Multiple vises are used in tandem to provide a visual aid for the purposes of learning
the game. A player can enter queried matches in order to observe an informative and
educational representation of their statistics. This paper will describe our methodology and
usage to display statistics in javascript.
1. Introduction/Motivation for Dotabase
Dota, better known as: “Defense of the Ancients,” is a game with a legacy spanning over the
course of a decade. The earliest known concept of Dota was coined in 2003 by an anonymous
individual named “Eul.”1 It began as a playermade custom map for the popular RTS (real time strategy)
game, “Warcraft III.” Thus, successively newer and improved versions of the map were released since
its conception. The current version, which is the sequel known as Dota 2, began development in 2009.
The game underwent beta testing in 2011, and was released just last year, July 9, 2013.
Games are played 5 versus 5, with each player picking a hero out of a pool of over 100
possible heroes. There are many important variables that can be used as statistics, such as kills, deaths,
GPM, (gold earned per minute) XPM, (experience earned per minute) etc. This makes Dota 2 a great
source of variables to display visually. Players then compete on 2 teams, named the “Radiant” and
“Dire.” The goal of the game is to destroy the other team’s main base, which is known as an “ancient.”
On the day of 3/17/2014, there have been 663,760 concurrent players online playing Dota 2,
as taken from the game distribution platform, Steam.2 Clearly, a game with more than half a million
players must have some sort of learning tool. There do exist many sites with guides to playing each of
the many heroes in the game, as well as websites that keep track of player statistics. However, our goal
of Dotabase is to devise something new and unique.
1
http://en.wikipedia.org/wiki/Dota_2
2
http://store.steampowered.com/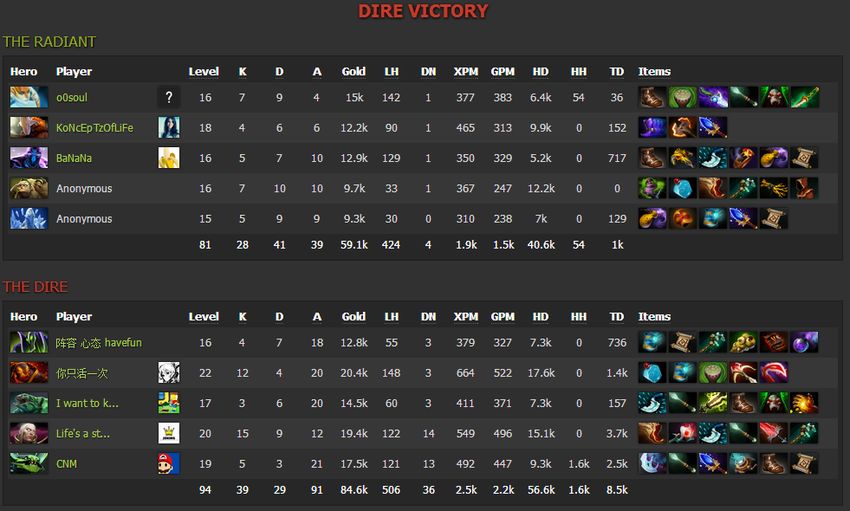
An example of match statistics fetched from dotabuff.com, showing heroes
picked, player names, hero levels, kills, deaths, assists, gold earned, last hits, denies,
XPM, GPM, hero damage, hero healing, tower damage, and items.
2. Background/Related Work
In order to begin our research, we looked at existing Dota statistic websites. The most
prominent website is http://dotabuff.com/, a resource that can query the statistics of any given player.
From there, we figured out how the website fetches player data; match history can be queried from the
official Dota 2 API, hosted by steam.3 The documentation was rather difficult to discern, but we were
able to write code that makes PHP requests to the server. Similarly to program 2, a MySQL/Apache
server was set up in XAMPP to run PHP files.
After obtaining the raw data, there were many methods as to how to go about visualizing player
statistics. The most convenient method was to use visualization techniques provided by d3.4 Our original
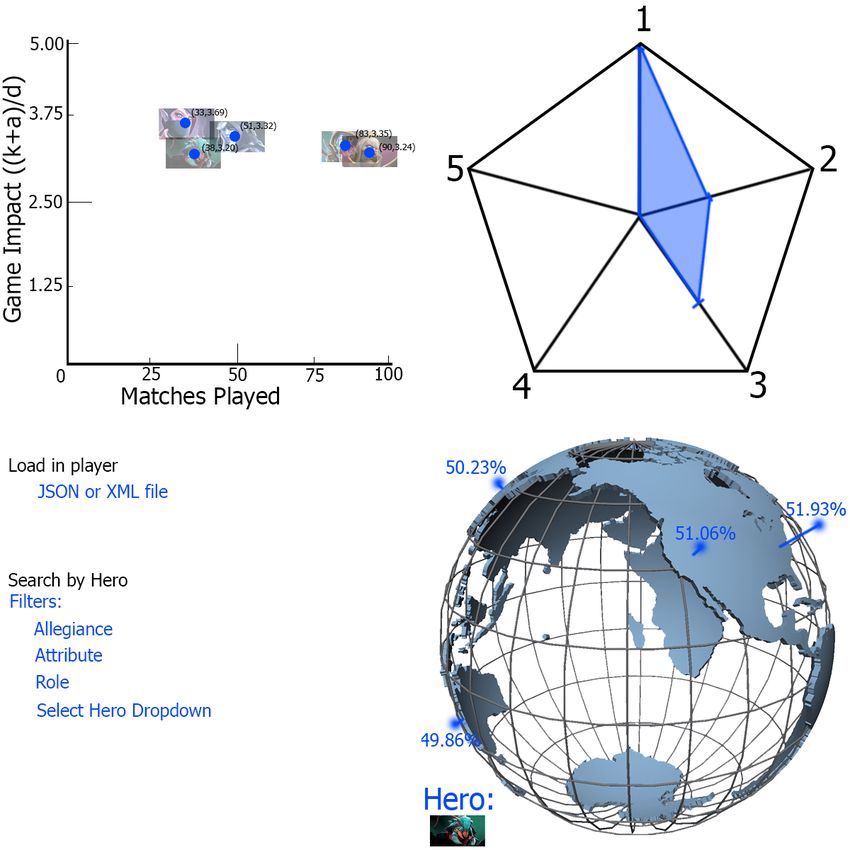
methods listed in our proposal were possible to reproduce in d3’s example vises. These were 3 vises:
1. A 3D scatter plot: displaying multiple heros’ performance for a player.
2. A star plot: show the roles of a player, and their performance for each respective role.
3. A globe: this would show tournament win rate and matches of certain heroes.
3
http://dev.dota2.com/showthread.php?t=47115
4
http://d3js.org/The choice to use multiple vises would enable the feature of brush linking. As shown in the image above, (data which is taken from my profile) the hero displayed in the globe would be chosen in the first and second vises. More specifically, the hero in the example image was Weaver. The scatter plot’s advantage is that most played heroes are readily visible. This is related to the second vis, which is a star plot based on hero role. It follows logically that consecutive games with one hero will be linked to one role. (or 2 in special cases) Yet, each role must be explained first. There are 5 roles, which are the numbers 1 through 5. This represents allocation of gold on the team, role 1 having the most gold and role 5 having the least. In this case, Weaver is a hero of role 3, which is why my proficiency is shown in
the star plot for 3. Notice how proficiency for 4 and 5 are absent; I mostly play roles 13, and all
heroes shown in the first vis are 13 as well. The code for the star plot was provided from two d3
sources.56
Lastly, the third vis will show a hero’s win percentage in global tournaments, and return match
IDs as well. This allows players to view replays of high level games in order to possibly improve their
skill. By the use of all 3 vises in tandem, a player can enter their data, (taken from the Dota 2 API) view
their success with various heroes, observe their role proficiency, and query any professional matches for
a given hero they have played. The way that this vis helps players is by providing match IDs that they
can download onto their Dota 2 client and view for themselves.
Unfortunately, we decided against using the globe visualization. We intended to use cesium.js7, a
javascript library for making 3D globes and 2D maps. The justification for not using this vis will be
explained in our results. With that in mind, we instead developed upon our existing 2 vises and improved
their functionality greatly.
3. Approach
Unlike our previous projects, fetched data was not conveniently formatted in advance. Thus, we
had to write a script in PHP to record values that were formatted our own desired way. This was both
advantageous and advantageous for our purposes, as we could write any file format desired, at the
expense of time that could be used towards actual vis design. Ultimately, we settled upon using .CSV
file format because we had previously used this file format in program 2. Thus, our intention of using
JSON and XML files was redacted.
Code Snippet:
echo $heroRoles[$heroes_data[$match>get_slot($playerSlot)>get('hero_id')]['localized_name']];
echo ",";
$text .= $heroRoles[$heroes_data[$match>get_slot($playerSlot)>get('hero_id')]['localized_name']].",";
echo $match>get_slot($playerSlot)>get('kills');
echo ",";
$text .= $match>get_slot($playerSlot)>get('kills').",";
echo $match>get_slot($playerSlot)>get('deaths');
echo ",";
$text .= $match>get_slot($playerSlot)>get('deaths').",";
In terms of what variables we needed to query, we decided in the end to query:
1. Match ID
2. Hero name
3. Kills
5
https://gist.github.com/nbremer/6506614
6
https://github.com/alangrafu/radarchartd3
7
http://cesiumjs.org/4. Deaths
5. Assists
6. Gold per minute
7. Experience per minute
8. Creep kills (last hits)
As shown in our proposal, our final project would consist of three different vis’s displaying
multiple representations of player data and proficiency. The first vis was the most basic, displaying an
array of three variables per hero played; each hero's kills, games played, and win ratio. These variables
can already be displayed from dotabuff.com, but our vis aims to make visual differences readily
apparent to viewers. Moreover, our vis can accept any arbitrary number of matches. For this vis, we
ended up using d3 and x3dom.8
The second vis was simple in complexity, but advanced in terms of finding relevant data needed
for calculations. A star plot plot was used to display a player's skill within the five categories of roles in
Dota 2. The calculations done were professional player averages, which would serve as thresholds for
player skill. Research was first done on concurrent professional team's players. Once the profiles were
retrieved, we returned average stats for their respective roles. In essence, the professional players
served as a benchmark for “outstanding” players with a maximum possible score for their indicated role.
With this in mind, all other players could be compared to this benchmark, returning a value from 1 to 5,
with 1 being poor and 5 being outstanding.
The players used as benchmarks for each respective role were:
Role 1: BurNIng (Team DK, China; http://dotabuff.com/players/90892734)
Role 2: Dendi (Team Natus Vincere, Ukraine; http://dotabuff.com/players/70388657)
Role 3: Funn1k (Team Natus Vincere, Ukraine; http://dotabuff.com/players/86723143)
Role 4: Aui_2000 (Team Cloud 9, USA; http://dotabuff.com/players/40547474)
Role 5: Akke (Team Alliance, Sweden; http://dotabuff.com/players/41288955)
*Team Alliance and Natus Vincere won first and second place in The International 2013, a
$2,874,381 prize pool tournament.
4. Results
A large bulk of the project consisted of fetching data sets, most of which is not visible to users.
This is helpful for practical purposes, as Dotabase runs offline without any issues. Additionally, making
direct calls to the Dota API server directly can become taxing on the server if excessive calls are made.
The current Dotabase folder will contain two player’s data sets, as well as professional player sets: the
latter of which are used for comparisons in the second vis, the star plot. Our project takes in a primary
8
http://bl.ocks.org/hlvoorhees/5986172and secondary data set, which can be compared together in the star plot.
By the resulting graph generated by inputting data of the last 100 matches, many conclusions
can be drawn. The data may be difficult to discern to those unfamiliar with Dota 2, but as an
experienced player there are noticeable correlations. Dota 2 is a game that has undergone many
iterations, and the current version is 6.80 which was released on January 29th. That being said, many
heroes undergo balance changes every patch. Disregarding heroes that have very low games played,
Templar Assassin, Ember Spirit, and Weaver have significant data values. Consider the tier list for
version 6.809, in which Templar Assassin is one of the lowest tier heroes. (4146% win rate) This
corresponds with my very low win rate for Templar Assassin, which is between 3040%. On the other
hand, Weaver remains an average hero, with 4952% win rate. This is displayed correctly as well, as
the win percent correlates at 4050%. The final significant statistic I would like to delineate is Ember
Spirit, with 70% win rate. This hero is in fact one of the newest heroes, being introduced in patch 6.79.
The general population of Dota 2 players have yet to see his potential and counters, meaning that there
9
http://dotabuff.com/blog/20140213pubtierlist680are no conventional methods towards combating Ember Spirit. All in all, my performance correlates to
current trending dota tier lists, which means that they are indeed accurate in gauging an average player’s
win percentage.
The previous two images are of my games played of each role, and my specific “3” role’s
performance. Previously in the hypothesis, a similar distribution of roles played was shown. The
expectations were met; based on the heroes played in the last 100 games, the most prominent are roles
1 through 3. A feature was added to compare the roles of two players. Thus, the blue star plot indicates
my performance as the 3 role, whereas the orange star plot is Eric Anderson's performance. As Eric
does not play as much Dota 2 as I do, my performance should be higher on average. This can be
observed easily, with me surpassing him in every aspect. His deaths are still higher than mine, which is
actually a detriment. It can be concluded that the performance of two players can be accurately
compared.
In this image I have chosen to filter by heros, specifically ember spirit. As observed in the first
vis, my success with this new hero is very evident; my gold per minute average is equal to that of aprofessional player. It is important to note that my deaths are still rather high, which shows additional
room for improvement. Once ember spirit becomes an “old” hero by the standards of average Dota 2
players, they will have developed necessary builds and counters towards him. It is expected that the
statistics should lower over time, provided that I play against more competent players in the future whilst
picking ember spirit.
The added inclusion of role and hero filters allows indepth analysis of players. For the purposes
of categorization, an additional job of ours was to list the possible role(s) over every single hero in Dota
2. This was a tedious, yet rewarding process. For matches read in, each game with a hero is
categorized by roles 1 through 5. Therefore, in our star plot we were able to sort not only by role, but
by hero. Players can already see their performance for each role, but now exact heroes for respective
roles can be pinpointed.
The probable usefulness of the globe vis was very dubious from the start. As stated above, tier
lists do exist. In fact, many heroes see little to no competitive gameplay, despite being picked in public
games. For example, at The International 2013, one third of the heroes were either picked 2 or less
times, with one hero never being picked.10 Moreover, by the time new patches come out and heroes are
changed, their play styles may change as a result. Formerly viable strategies are lost, due to the
constantly changing metagame of Dota 2. The second reason for removing the vis was for the sake of
presentation. The globe itself is in fact the least useful resource, but takes up the most space on the
screen. We want to bring the viewer’s attention to the more important aspects of Dotabase, specifically
the star plot. All the vises produced did not show any unexpected results, but rather correlated with our
hypothesis and other related Dota 2 specific trends. As long as a sufficiently large data set is provided,
useful statistics are readily observable.
5. Conclusion
There was little to hypothesize, but rather it was more important to show that our results were
correctly reflected in Dotabase. It is safe to say that results were produced as expected, considering the
clear role distribution for my matches in the star plot. As a player of 4000 matchmaking rating, my
above average skill in the 3 role was accurately depicted. Yet, my weakest point that I need to work on
is to not die as much as right now. It follows logically that I play to aggressively, and should be more
defensive as the 3 role.
One stretch goal we wish we could have performed was the ability to factor MMR
(matchmaking rating) into skill. 11 Dotabase fails to determine if a player is truly “good” if they have very
few games played. For example, for a person with only a single game played which resulted in an
absolutely one sided victory, they would have an “outstanding” rating. Yet, the first few games played in
Dota 2 will always be in a low skill bracket; experienced players can always make new accounts that
will have grossly skewed stats that do not reflect their true skill. For now, this miscalculation is
10
http://www.gosugamers.net/dota2/features/3406heroesoftheinternational3
11
http://dota2toplist.com/statisticsacceptable, as many other Dota 2 statistic websites (such as Dotabuff) fail in this aspect as well.
In terms of the success of this project, it has exceeded our expectations. It is important to note
that not only is it useful to compare data to pro players, comparisons to players of the same skill level
are also rewarding. This is to say, 5 players of nearly the same skill level could form a team together.
Presently, teams recruit other players by asking for their MMR. This is slightly flawed, as it is possible to
play and win due to your team, not by your own performance. Hence, by using both MMR and
Dotabase, a player’s full potential can be realized. Unfortunately, this cannot fully be implemented as of
now, since MMR is a hidden stat that is viewable only by a single player and their friends. If this feature
becomes public, there is yet hope for an online version of Dotabase.
6. References
● http://en.wikipedia.org/wiki/
● http://store.steampowered.com/
● http://dev.dota2.com/showthread.php?t=47115
● http://dotabuff.com/
● http://d3js.org/
● http://cesiumjs.org/
● http://bl.ocks.org/hlvoorhees/5986172
● http://dota2toplist.com/statistics
● http://www.gosugamers.net/dota2/features/3406heroesoftheinternational3
● https://github.com/alangrafu/radarchartd3
● https://gist.github.com/nbremer/6506614You can also read