DRAFT 2021 Annual Action Plan - City of Niagara Falls Community Development Block Grant, Emergency Solutions Grant, and HOME Investment ...
←
→
Page content transcription
If your browser does not render page correctly, please read the page content below
DRAFT
 2021 Annual Action Plan

Community Development Block Grant,
  Emergency Solutions Grant, and
HOME Investment Partnership Grant

    City of Niagara Falls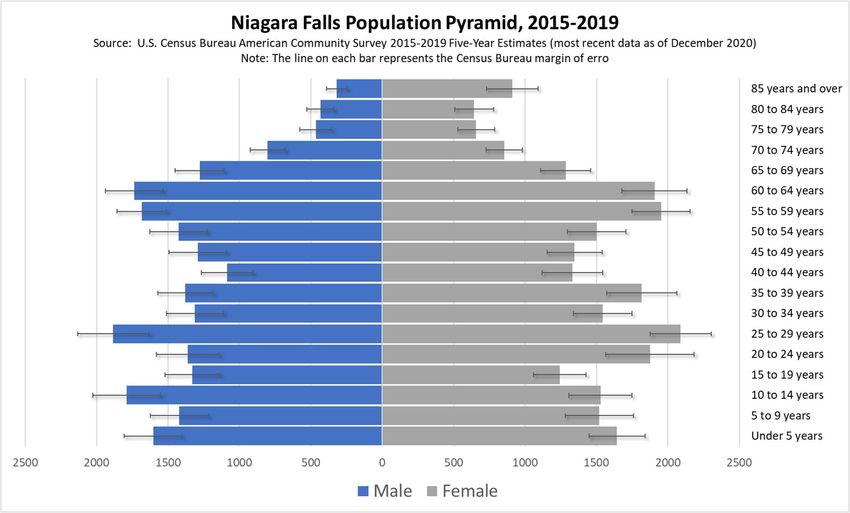
Expected Resources

AP-15 Expected Resources – 91.220(c)(1,2)
Anticipated Resources

  Program    Source       Uses of Funds            Expected Amount Available Year 1                  Narrative Description
            of Funds                          Annual     Program Prior Year       Total:
                                            Allocation: Income: Resources:          $
                                                 $           $          $
  CDBG      public -   Acquisition                                                          Allocations based on final FFY 2021
            federal    Admin and Planning                                                   HUD figures. Annual Action plan built
                       Economic                                                             via public participation and approved
                       Development                                                          by the Niagara Falls City Council.
                       Housing
                       Public
                       Improvements
                       Public Services      2,441,036          ??                      ??
  HOME      public -   Acquisition                                                          Allocations based on final FFY 2021
            federal    Homebuyer                                                            HUD figures. Annual Action plan built
                       assistance                                                           via public participation and approved
                       Homeowner rehab                                                      by the Niagara Falls City
                       Multifamily rental
                       new construction
                       Multifamily rental
                       rehab
                       New construction
                       for ownership
                       TBRA                   448,718                448,718
Program    Source       Uses of Funds              Expected Amount Available Year 1                      Narrative Description
            of Funds                            Annual     Program Prior Year       Total:
                                              Allocation: Income: Resources:          $
                                                   $           $          $
  ESG       public -   Conversion and                                                             Allocations based on final FFY 2021
            federal    rehab for                                                                  HUD figures. Annual Action plan built
                       transitional housing                                                       via public participation and approved
                       Financial Assistance                                                       by the Niagara Falls City
                       Overnight shelter
                       Rapid re-housing
                       (rental assistance)
                       Rental Assistance
                       Services
                       Transitional housing     203,492           0                 203,492

                                                  Table 1 - Expected Resources – Priority Table

Explain how federal funds will leverage those additional resources (private, state and local funds), including a description of how
matching requirements will be satisfied

The City has received a grant from Enterprise Community Partners for housing rehabilitation activities and the program is being used
in concert with existing Community Development programming. Additionally, the Niagara Orleans Regional Land Improvement
Corporation (NORLIC) will participate in some Community Development rehabilitations and demolitions.

In 2019 the City was awarded $10 MM through the New York State Downtown Revitalization Initiative (DRI) for targeted investment
in the City’s North End. Community Development programming will include investments within the North End to, along with DRI
funds, leverage funding from the private sector, area foundations, CDFI’s, and other federal sources.
Annual Goals and Objectives
AP-20 Annual Goals and Objectives
Goals Summary Information
Sort Goal Name Start End Category Geographic Needs Addressed Funding Goal Outcome Indicator
Order Year Year Area
1 Milling and Road 2021 2022 Non-Housing City-Wide Infrastructure CDBG: Public Facility or Infrastructure
Paving Community Target Area $515,000 Activities other than
Development Low/Moderate Income Housing
Benefit
2 Small Business 2021 2022 Non-Housing City-Wide Business Support CDBG: Businesses Assisted
Support Fund Community Target Area & Workforce $100,000
Development Development Jobs Created for Low/Moderate
Income Individuals
3 Targeted 2021 2022 Clearance and City-Wide Slum/Blight CDBG: Structures Demolished
Demolition Demolition Target Area $415,000
4 Owner Occupied 2021 2022 Affordable City-Wide Affordable CDBG: Homeowners Assisted
Residential Housing Target Area Housing $400,000
Rehabilitation
5 Single Family 2021 2022 Affordable City-Wide Affordable CDBG: Homeowners Assisted
Homeownership Housing Target Area Housing $17,030
Initiatives
HOME:
$403,847Sort Goal Name Start End Category Geographic Needs Addressed Funding Goal Outcome Indicator
Order Year Year Area
6 Clean 2021 2022 Non-Housing City-Wide Slum & Blight CDBG: Public Facility or Infrastructure
Neighborhood Community Target Area $107,058 Activities other than
Programming Development Low/Moderate Income Housing
Benefit
7 Youth Mentoring 2021 2022 Non-Housing City-Wide Crime Prevention CDBG: Youth Assisted
and Counseling Community Target Area $143,741
Development
8 Homeless 2021 2022 Non-Housing City-Wide Homeless CDBG: Homeless Prevention
Assistance and Community Target Area Assistance $143,000
Prevention Development Persons Assisted
ESG:
$50,000
9 Increase % of 2021 2022 Homeless City-Wide Rapid ESG: Homeless Person Overnight
Homeless Persons Target Area Rehousing/Street $144,880 Shelter
in Permanent Outreach Overnight/Emergency
Housing Shelter/Transitional Housing
Beds added
Table 2 – Goals Summary
Goal Descriptions
1 Goal Name Milling and Road Paving
Goal Repairing and replacing substandard roads servicing low-income neighborhoods and commercial areas
Description
2 Goal Name Small Business Support FundGoal Provide grants to microenterprise businesses owned and operated by low and moderate income individuals and/or
Description creating jobs for low and moderate income job seekers
3 Goal Name Targeted Demolition
Goal Undertake targeted demolition and clearance of buildings and land features which contribute to spot blight conditions
Description
4 Goal Name Owner Occupied Residential Rehabilitation
Goal Provide funding to eligible property owners for the purposes of rehabilitation
Description
5 Goal Name Single Family Homeownership Activities
Goal Provide assistance with closing costs and counseling for low and moderate income, first-time homebuyers
Description
6 Goal Name Clean Neighborhood Programming
Goal Department of Public Works - Special Operations Project. Targeted clean-up task force that includes activities from both
Description the Departments of Public Works and Code Enforcement.
7 Goal Name Youth Mentoring and Counseling
Goal Provide after school and summer programming for youth, as well as counseling to provide a proactive approach to
Description address crime prevention
8 Goal Name Homeless Assistance and Prevention
Goal Provides housing assistance to individuals and families who are homeless or in jeopardy of becoming homeless
Description
9 Goal Name Increase Percentage of Homeless Persons in Permanent Housing
Goal Rapid Re-housing provides services to homeless individuals through housing search, counseling and legal aid assistance
Description
Table 3 – Goals DescriptionsProjects
AP-35 Projects – 91.220(d)
Projects
# Project Name
1 Owner Occupied Rehabilitation
2 Small Business Support Fund
3 Clean Neighborhood Program
4 Niagara Falls Housing Authority Summer & After School Programming
5 Milling and Road Paving
6 Demolition Initiative
7 Niagara Falls Memorial Medical Center Schoellkopf Facility Improvements
8 Heart Love & Soul Project Daybreak and HLS Net Services
9 YWCA Counseling for Homeless Children
10 Youth Motivation, Inc, Crime Prevention and Youth Counseling
11 Consumer Credit Counseling – Financial Counseling and Homeownership
Program
12 Homeownership – Closing Costs Assistance and Homebuyer Education
12 YWCA – Women and Children’s Shelter
13 Community Missions Emergency Shelter Operations
14 Pinnacle Community Service – Passage House Shelter Operations
15 Pinnacle Community Service – Casey House Shelter Operations
16 Single Family Homeownership Initiatives
17 Program Administration
Table 4 - ProjectsAP-50 Geographic Distribution – 91.220(f)
Description of the geographic areas of the entitlement (including areas of low-income and
minority concentration) where assistance will be directed
Geographic Distribution
Target Area Percentage of Funds
City-Wide Target Area 100
Table 5 - Geographic Distribution
Rationale for the priorities for allocating investments geographically
City-Wide Target Area: Since this program is to benefit low-moderate income persons, geography is not
a factor in this target area.
Niagara Falls Community Development Area: Funds will go towards addressing deteriorated properties
to alleviate conditions set forth in 24 CFR 570.208(b) through residential rehabilitation programs.
AP-55 Affordable Housing – 91.220(g)
Introduction
The City of Niagara Falls will advance affordable housing by providing closing cost assistance and
rehabilitation deferred loans to low to moderate income households. The City of Niagara Falls will also
provide housing to homeless or at-risk of homelessness families through rapid re-housing and homeless
prevention grants to homeless service agencies.
AP-60 Public Housing – 91.220(h)
Introduction
The City of Niagara Falls collaborates with the Niagara Falls Housing Authority (NFHA) to encourage
public housing improvements and public housing resident involvement.
The City of Niagara Falls also manages a Section 8 program that supports Housing Choice Vouchers,
Project Based Vouchers, and Homeownership programs.
The City of Niagara Falls 2020-2024 Strategic Plan supports the NFHA and City of Niagara Falls PHA Plans
through expanding the supply of decent, affordable housing in Niagara Falls through use of CDBG andHOME funds. The Housing Choice Voucher program provides residents with housing choice, which is a way to deconcentrate areas of poverty. The City of Niagara Falls also funds youth services directed primarily towards NFHA residents. Actions planned during the next year to address the needs to public housing The City of Niagara Falls will work with the Niagara Falls Housing Collaborative, comprised of NFNHS and CCNDC, using CHDO funds to renovate rental units for the purpose of Project Based Vouchers. Actions to encourage public housing residents to become more involved in management and participate in homeownership The City of Niagara Falls will market its Family Self-Sufficiency program to its current clients as well as new clients expected through an opening of the Leased Housing Waiting List. The City of Niagara Falls will market its closing cost assistance grant and home ownership auction programs to residents of NFHA public housing. If the PHA is designated as troubled, describe the manner in which financial assistance will be provided or other assistance Neither PHAs in Niagara Falls are designated as troubled at this time. AP-65 Homeless and Other Special Needs Activities – 91.220(i) Introduction The City of Niagara Falls is committed to serving the needs of the homeless and at-risk of homelessness populations in Niagara Falls. The 2020 Annual Action Plan program year will serve as a means to increase understanding of the needs, create baseline data to measure against future years, and to develop strategies and best practices in serving homeless and at-risk of homelessness populations in a more pro-active fashion. Describe the jurisdictions one-year goals and actions for reducing and ending homelessness including Goal: Improve Coordinated Entry Implementation in Niagara Falls Actions: The City of Niagara Falls is working with HAWNY to develop a more pro-active Coordinated Entry approach that puts more resources towards street outreach and assessment. The City of Niagara Falls, the CoC, and other service agencies will work together to secure additional sources of funding for
street outreach and assessment.

Goal: Create Performance Metrics and Standards Based on Need and Capacity

Actions: The City of Niagara Falls is working with HAWNY to develop goals, metrics, and strategies to
address emergency shelter and transitional housing needs in Niagara Falls. The City of Niagara Falls
routinely checks HMIS data and HAWNY quarterly performance reports to determine the need of
emergency shelter and transitional housing needs in Niagara Falls. The work on improving Coordinated
Entry will also address the needs of homeless or at-risk of homelessness persons that would typically use
emergency shelter or transitional housing but may be better served through other programs or services.

Goal: Reduce Shelter Stays at ESG-funded Shelters

Actions: The City of Niagara Falls will work closely with ESG-funded Shelter subrecipients and HAWNY to
develop a strategy to reduce shelter stays in Niagara Falls. The Rolling 12-Month Performance Report
for the CoC 1/1/2018-12/31/2018 will be used as the benchmark metric for shelter stay reductions. The
City of Niagara Falls will work with ESG-funded Shelter subrecipients to increase efficiencies and creating
partnerships with other service organizations that may help alleviate or reduce the need to stay in
shelters. The City of Niagara Falls will work with HAWNY to track performance and seek additional
technical assistance in increasing efficiencies and partnerships with other service organizations.

Goal: Develop an empirical risk model and a strategy to guide service providers in providing pro-active
aid to families at-risk of homelessness.

Actions: The City of Niagara Falls, in collaboration with HAWNY, will research and develop an empirical
risk model for families at-risk of homelessness and a strategy to reach families at-risk of homelessness
before need of homeless services such as shelter or rapid-rehousing. Once developed, the City of
Niagara Falls will work with service providers and other partner organizations to implement the strategy
and create baseline data to inform performance tracking going forward.

Reaching out to homeless persons (especially unsheltered persons) and assessing their
individual needs

The Niagara County Coalition for Services to the Homeless is a significant step in the right direction in
terms of outreach and needs assessment for homeless individuals and families. Community Missions of
the Niagara Frontier, as well as Heart and Soul Food Pantry, YWCA Carolyn's House, The Niagara Action
Program and Family and Children Services all actively interact with homeless persons. Heart Love and
Soul is opening their Daybreak Program in 2020-2021 to centralize access to the services provided to
over 30 different agencies.

The Homelessness Alliance of Western New York has identified the concern that there is a greater issue
of unsheltered or street homelessness than the data shows. The Continuum of Care cannot fund street
outreach, so the City and CoC will be looking at utilizing ESG funding to help identify the true scope of
the problem. Additionally, the City and CoC work with the hospital system and Community Missions to
identify repeat or chronic homelessness and to identify the needs of unsheltered individuals.

Additionally, the City created an ESG project review panel with the Homelessness Alliance of Western
New York to find new and improved ways to increase participation and input. The panel reports to the
Mayor and includes HAWNY, Department of Community Development and Niagara County Social
Services Department staff. The members of the panel are organizations that do not receive ESG funds
via the City of Niagara Falls annual action plan.

Addressing the emergency shelter and transitional housing needs of homeless persons

HAWNY is seeking funding to create additional shelters and beds in Niagara Falls. Currently Pinnacle
Community Services, Community Missions Inc, the YWCA, and Niagara Gospel Rescue Mission provide
emergency shelter and/or transitional housing for homeless individuals. Additionally, the Niagara
County Department of Social Services provides hotel and motel placement to meet emergency shelter
and transitional housing needs. The homeless service providers have identified individuals and families
fleeing domestic abuse as a significant issue in Niagara County. The YWCA and Pinnacle have shelters
specifically designed to create a safe haven for victims of domestic abuse and to match individuals with
services needed to gain independence and independent living.

Helping homeless persons (especially chronically homeless individuals and families, families
with children, veterans and their families, and unaccompanied youth) make the transition to
permanent housing and independent living, including shortening the period of time that
individuals and families experience homelessness, facilitating access for homeless individuals
and families to affordable housing units, and preventing individuals and families who were
recently homeless from becoming homeless again

The Homelessness Alliance of Western New York secured a $3.6MM grant for a two-year Youth
Homeless Demonstration Project, whereby Community Missions, Inc. and Pinnacle Community Services
will receive funds to combat homelessness in youth or other at-risk populations. Pinnacle will provide
intake services and will assign a caseworker to individuals and families to help meet specific needs
including rapid re-housing, securing permanent housing, and being connected with social service
providers as appropriate. Pinnacle currently provides homelessness prevention programming that
provides skills to individuals in small groups, to help maintain housing. Heart Love and Soul is opening
their Daybreak Program to centralize access to the services provided to over 30 different agencies.

Helping low-income individuals and families avoid becoming homeless, especially extremely
low-income individuals and families and those who are: being discharged from publicly
funded institutions and systems of care (such as health care facilities, mental health
facilities, foster care and other youth facilities, and corrections programs and institutions);
or, receiving assistance from public or private agencies that address housing, health, social
services,
employment, education, or youth needs

Niagara County is implementing HUD’s Housing First approach and seeing positive results. Housing First
is intended to eliminate barriers to permanent housing without preconditions such as sobriety,
treatment, or service participation requirements. The broader intake is providing meaningful housing
solutions without pushing the ‘higher-risk’ homeless individuals away. Once secure in housing, the focus
turns to services and other support within the Continuum of Care. Relatedly, the CoC uses the Single
Point of Access mental health referral systems to submit medical, hospitalization, treatment, and
housing information to the relevant service providers.
AP-75 Barriers to Affordable Housing – 91.220(j)
Introduction:

Actions it planned to remove or ameliorate the negative effects of public policies that serve
as barriers to affordable housing such as land use controls, tax policies affecting land, zoning
ordinances, building codes, fees and charges, growth limitations, and policies affecting the
return on residential investment

The City of Niagara Falls provides housing rehabilitation funds to assist with the cost burdens associated
with an older housing stock suffering from decades of disinvestment and is re-working the program to
increase the amount of incentive available per unit in order to bring units up to appropriate Housing
Quality Standards without increasing the rental or overhead burden on renters or homeowners.

A housing survey was conducted through the 2020-2025 Consolidated Planning Process which, along
with demographic data, was used as the basis for the 2021 Housing Analysis. The Housing Analysis
provides recommendations to address issues of affordability and cost burden that the City can pursue,
including:

    •   Update the Analysis of Impediments to Fair Choice Housing
    •   Conduct a Housing Market Assessment and Strategy
    •   Implement and Vacant Lot Management and Reuse Strategy

The City is also working with non-profits developers such as Belmont Housing and Neighborworks to
construct new affordable housing units. Specifically, the City is (i) investigating sites for infill
development, (ii) making city-owned properties available for rehabilitation or redevelopment, and (iii)
making CDBG and HOME funds available to leverage investment in the development of new units.
Belmont is currently working on the former Sacred Heart Church and School to create 42 new units with
rents at 45% of the median, based on a recent market study.

The City is partnering with the Niagara Orleans Regional Land Improvement Corporation (NORLIC) to
provide housing rehabilitation to create or improve affordable units throughout the City and is exploring
the possibility of gifting vacant City-owned properties to NORLIC and Habitat for Humanity for
redevelopment.

AP-85 Other Actions – 91.220(k)

Introduction:

The City of Niagara Falls plans to increase its role in strategic planning and fostering collaboration among
various service agencies in Niagara Falls and the region to better serve the residents of Niagara Falls and
to reduce duplicative programs that give rise to inefficiency in service to residents. Actions planned to address obstacles to meeting underserved needs The City of Niagara Falls conducted a needs assessment and market analysis for its 2020-2025 Strategic Plan. This needs assessment and market analysis and supplemental Housing Brief identified obstacles to meeting underserved needs and a strategy to address obstacles will be developed, adopted, and implemented. The City is considering implementation recommendations from the Analysis including updating the Analysis of Impediments to Fair Housing Choice and developing a Vacant Lot Management and Reuse Strategy. Actions planned to foster and maintain affordable housing The City of Niagara Falls will continue to offer a home ownership auction of City-owned residential properties. The City of Niagara Falls will also create more Project Based Voucher rental units to match the need of current and new Section 8 clients. Actions planned to reduce lead-based paint hazards The City of Niagara Falls will work closely with the Niagara County Department of Health to address homes that are found to have lead-based paint hazards through both City and County-led programs. Actions planned to reduce the number of poverty-level families The City of Niagara Falls will work with the Empire State Poverty Reduction Initiative (ESPRI) and other partner organizations to reduce the number of poverty-level families by addressing root causes of poverty and developing strategies and initiatives to sustain poverty reduction programs and collaboration. Actions planned to develop institutional structure The City of Niagara Falls will continue to develop institutional structure by creating standard operating procedures, re-evaluating current plans and policies, and attending appropriate trainings for staff to gain a mastery over administering HUD CPD programs. Actions planned to enhance coordination between public and private housing and social service agencies The City of Niagara Falls will study the best use of social service agencies' programs for public and private housing agencies and create the discussion to link these programs more closely to serve the housing needs of residents.
Appendix A:

2021 Community Survey and Supplemental
Housing Brief
City of Niagara Falls
               Community Survey and Supplemental Data Brief
                                2020-2021

Introduction
As part of the City of Niagara Falls’ 5-Year Consolidated Plan update, the City of Niagara Falls
Community Development Department sought public input to guide the Plan’s development and
implementation. COVID-19’s impact on public gatherings and required social distancing measures
limited the ability of the City and its consultants to undertake in-person community outreach. The
inability to engage with critical housing organizations and the public meetings resulted in the
deployment of a simple online survey aimed at assessing the housing situation of Niagara Falls
residents. Using Survey Monkey, the survey was deployed on November 9, 2020 and ended on
December 30, 2020. Additionally, hard copies of the survey were prepared and distributed to various
public places, including the City of Niagara Falls Community Development Office, City Hall, and
the Niagara Falls Public Library. Community Development placed announcements and links to the
survey on its website. A large number of housing stakeholders were emailed the link and asked to
distribute the link to their networks and ask anyone who they were engaged with to consider taking
the survey.

Survey Findings
Despite these efforts, the survey only resulted in six valid responses. With such a low response rate,
drawing any conclusions from them as a representative sample of the community is inappropriate.
Survey results are presented as an Appendix to this brief. Rather than try to draw firm conclusions,
there are a number of question responses that might align with the 5-Year Consolidated Plan’s
development and implementation and offer some glimpse into housing in the community.

Generally speaking, the six respondents represented were 66.7% White and 33.3% were Black or
African American, which is close to current 5-year American Community Survey estimates for the
City of Niagara Falls, which is estimated to be 68.0% White and 22.1% Black or African America.
So, from a race and ethnicity perspective, respondents roughly approximate the population, with
Black or African American respondents being slightly overrepresented.

Given the focus on incomes and tenure in HUD programming, questions were asked of
respondents to determine levels of income, housing expenses, and tenure. Five of six respondents
indicated their incomes were above the City’s median household income ($36,346, 2014-2019 5-year
ACS), with one between $50,000 to $74,999; three between $75,000 and $99,999; and one between
$100,000 and $149,999. The other respondent indicated household income of $15,000 to $24,999.

Also, some of the responses were clearly incorrect. For example, question 5 asked “What is your
current housing situation?” which is a question about tenure. Of the six responses, five indicated the
own their own home and one indicated they rent. The next question was for renters only, which
stated “If you rent, would you like to own.” Four people indicated they would like to own but on
the respondent who indicated they rented in the prior question should have answered that question.

                                                   1
If we were to sum up the survey results, what we arrive at is the respondents were, for the most part,
earning more than the City’s median household income, owning their own homes, and satisfied with
their current living arrangements. In other words, they are unlikely to be the households for which
community development programs are developed.
Supplemental Data
Given the survey responses offer little in guidance or direction, the effort made here is to provide
the City of Niagara Falls more up-to-date American Community Survey data related to the
population, households, and housing than is available via IDIS and used for the Consolidated Plan,
which relies on data from the 2011-2015 ACS. With the United States Census Bureau’s release of 5-
year American Community Survey (ACS) estimate updates on December 10, 2020, it represents the
first opportunity to examine data across three consecutive, nonoverlapping 5-year Estimates: 2005-
2009; 2010-2014; 2015-2019.
With this opportunity, the data provide below achieves two objectives. First, as mentioned, it
provides more timely data than in the draft Consolidated Plan. From a policy and program
perspective, having the most timely and accurate data possible is preferred. Second, the data aligns
with the survey question as it relates to income and housing characteristics of the intended survey
population, providing some depth and further insight into people, households, and housing in the
City of Niagara Falls. The intent here is to support efforts by Community Development by
providing a number of key data variables that relate to its efforts but also can be helpful in
understanding current conditions in the City of Niagara Falls.
Additionally, since the City, as a housing market, does not exist in insolation but rather, is a
submarket within a larger market place. To contextualize this, in some cases, data is provided for
Niagara County and the cities of Lockport and North Tonawanda and the towns of Lewiston,
Lockport, Niagara, Pendleton, and Wheatfield.
2Population Profile
Population Change
As is certainly well known, population in the City declined over these three consecutive time periods
and is now less than 50,000 people. The estimated decrease in population since 2005-2009 is 3,460
people, or -6.7%. A decline in population, clearly, can have impacts on housing. It is more
important, however, to assess the change in households, as discussed below in the Household
Profile section.
Table 1: Population Change
2005-2009 2010-2014 2015-2019 Change % Change
City of Niagara Falls 51,712 49,679 48,252 -3,460 -6.70%
City of Lockport 20,770 20,957 20,490 -280 -1.34%
City of North Tonawanda 31,362 31,245 30,487 -875 -2.80%
Lewiston 16,633 16,188 15,830 -803 -2.63%
Lockport 20,251 20,380 20,027 -224 -1.34%
Niagara 8,433 8,278 8,151 -282 -3.34%
Pendleton 6,300 6,483 6,700 400 6.34%
Wheatfield 16,450 18,249 18,140 1,690 10.27%
Niagara County 214,613 214,973 209,281 -5,332 -2.48%
Age
In addition to the impact of population change, the age of the population has important implications
for housing. Over the next 10 years, the population of people in the United States over 75 will
increased from 23 million to more than 34 million. As the population ages, its housing needs
change. For those seeking to age in place, smaller units that are more accessible are likely to be in
demand. Simultaneously, a community with a younger population, especially families, will require
appropriately sized housing to accommodate families with children.
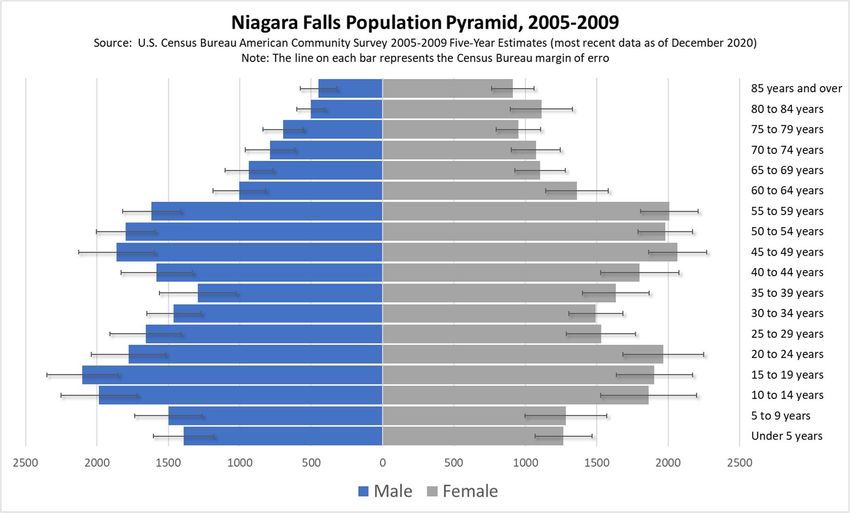
The median age in Niagara Falls has decreased from 39.6 years old to 38.1 years old. Niagara
County, as well as North Tonawanda and Lockport, have experienced an increase in their median
ages. Niagara County’s in 2015-2019 43.2 years old, more than five years older than Niagara Falls.
One way to better conceptualize the impact of age on a community, and connect it to housing, is the
dependency ratio, which measures the percentage of the population who are dependent on the
working age population for support. Those considered dependent are those ages 0 to 14 and 65 and
older. It is calculated simple at the total population of people age 0 to 14 ang 65 and older, divided
by the sum of those aged 15 to 64. The resulting ratio, when multiplied by 100, indicates how many
dependents there are for every 100 people of working age. An increase in this value over time
indicates an increase in the number of dependents and can have impacts on local government
decisions raging from schools and housing to social services and health care.
In Niagara Falls, the dependency ratio increased from 2005-2019, from 52.5 to 55.2. In other words,
there are three more dependents per 100 people of working age in Niagara Falls. However, this does
not explain how the youth (0 to 14 years old) and aged (65 years old and older) populations have
changed. For this, youth and age dependency ratios can be calculated to determine any changes in
these cohorts. Here the calculation is straight forward, dividing the youth and aged population totals
3by the working age total. What this reveals for Niagara Falls is the youth dependency ratio has
increased from 27.4 to 30.6 while the aged ratio decreased from 25.1 to 24.6.
Some care has to be taken here when interpreting these results given the City’s decrease in
population. In other words, an increase or decrease in the dependency ratio is not necessarily
indicative of an increase or decrease in the population totals for the given cohorts. What has
happened in Niagara Fall is, as total population has decreased, the number of people 0 to 14 has
actually increased, from 9,292 to 9,507 (+215) while both the working age and aged populations
have decreased, from 33,899 to 31,100 (-2,799) and 8,521 to 7,645 (-876), respectively.
Table 2: Age Distribution
Age Group 2005-09 2014-19 Change % Change
0-14 9,292 9,507 215 2.3%
15-64 33,899 31,100 -2,799 -8.3%
65+ 8,521 7,645 -876 -10.3%
The follow page provides population pyramids for selected age cohorts for 2005-2009 and 2014-
2019 as a way to visualize the changing age of the community.
4Figure 1: Population Pyramids, 2005-2009 and 2015-2019
5Race and Ethnicity
The City of Niagara Falls, like many other cities in the United States, is increasingly more diverse
today than in the past. In Niagara Falls, the increased diversity of the population is happening
through two distinct patterns. First, the white population has decreased, from 39,277 in 2005-2009
to 32,830 in 2015-2019. This -16.4% decrease in the white population resulted in the percent of the
City’s white population decreasing from 76.0% to 68.0%. Second, other races and ethnicities have
increased in the City, including Black/African American, Asian, and those identifying as Two or
More Races. As these populations have increased while the white population decreases, the racial
and ethnic composition of the City becomes more diverse.
Table 3: Race and Ethnicity
2005-2009 2010-2014 2015-2019
Race/Ethnicity Count Percent Count Percent Count Percent
White alone 39,277 76.0% 35,509 71.5% 32,830 68.0%
Black or African American
9,413 18.2% 11,467 23.1% 10,672 22.1%
alone
American Indian and Alaska
623 1.2% 523 1.1% 565 1.2%
Native alone
Asian alone 458 0.9% 442 0.9% 836 1.7%
Native Hawaiian and Other
6 0.01% 38 0.1% 33 0.1%
Pacific Islander alone
Some other race alone 407 0.8% 181 0.4% 449 0.9%
Two or More Races 1,528 3.0% 1,519 3.1% 2,867 5.9%
Total 51,712 100% 49,679 100% 48,252 100%
6Household Profile
Although population change is an important factor in a community’s housing programming and
policy development, the change in the number of households is arguably more important. A
community can decline in population while maintaining the same number of households as the size
of households decreases. As Americans have fewer children and older households that once had
children age in place, population can decrease while the number of households remains stable, or
even increase.
Total Households and Size
Unfortunately, in Niagara Falls, like population, the number of households also decreased from
2005-2009 to 2014-2019, from an estimated 22,939 to 21,571 (-1,367). When communities shed
households, one critical impact that tends to follow is an increase in the number of vacant units,
absent the removal of the units through other means, such as demolition or redevelopment. Sections
below address units and vacancy.
The average size of households in Niagara Falls decreased slightly, from 2.24 pers per household to
2.22 persons per household. The average family household size increased from 3.03 to 3.08 people
per family household. Nonfamily households increased from 1.17 to 1.21.
Table 4: Change in Households and Size
2005-2009 2010-2014 2015-2019
Population in Family Households 40,000 38,501 35,761
Population in Nonfamily Households 11,376 10,846 12,111
Total Population in Households 51,376 49,347 47,872
Number Family Households 13,218 12,099 11,597
Number Nonfamily Household 9,721 9,201 9,975
Number of Households 22,939 21,300 21,572
Average Family Household Size 3.03 3.18 3.08
Average Nonfamily Household Size 1.17 1.18 1.21
Average Household Size 2.24 2.32 2.22
Household Income
Income is arguably the most important factor for households when they seek housing in a given
community. Since the housing market functions as an open market, the more money a household
has to spend, the more housing amenities it can purchase. These amenities are both physical and
geographic. Physical amenities, minimally, are the quality and condition of the unit, the number of
bedrooms, and the number of bathrooms. Geographic amenities include the school district, overall
neighborhood quality, access to public transportation, walkability, and proximity to friends and
family, among others. At the same time, money can limit household options. For low- and
moderate-income households, this can limit the locations within which they can search for housing.
In Niagara Falls, median household incomes, in constant dollars, has decreased slightly from $37,290
in 2005-2009 to $6,346 in 2015-2019. In Niagara County, median household income increased by
$1,080 over the same time period, from $54,441 to $55,522. The other two cities in Niagara County,
Lockport and North Tonawanda, experienced increases in median household income. In Lockport,
it increased from $44,037 to $45,019 (+$981) and in North Tonawanda it increased from $55,284 to
7$58,211 ($2,927). For added context, the median household incomes in the two fastest growing
communities in Niagara County – Pendleton and Wheatfield – had estimated median household
incomes of $97,123 and $82,03 in 2015-2019. Another way to comprehend this is that between
2005-2009 and 2015-2019, the gap between the median household income in Niagara County and
Niagara Falls increased. In the earlier time period, the median household income in Niagara Falls
was 68.5% of the County median household income. In 2015-2019, it decreased to 62.5%.
Table 5: Change in Household Income
2005-2009 Percent 2015-2019 Percent % Change
Less than $10,000 2,743 12.0% 2,470 11.5% -10.0%
$10,000 to $14,999 2,606 11.4% 2,135 9.9% -18.1%
$15,000 to $19,999 1,746 7.6% 1,547 7.2% -11.4%
$20,000 to $24,999 2,262 9.9% 1,769 8.2% -21.8%
$25,000 to $29,999 1,684 7.3% 1,451 6.7% -13.8%
$30,000 to $34,999 1,363 5.9% 1,114 5.2% -18.3%
$35,000 to $39,999 1,101 4.8% 1,018 4.7% -7.5%
$40,000 to $44,999 1,263 5.5% 1,029 4.8% -18.5%
$45,000 to $49,999 925 4.0% 937 4.3% 1.3%
$50,000 to $59,999 1,973 8.6% 1,305 6.0% -33.9%
$60,000 to $74,999 2,059 9.0% 1,780 8.3% -13.6%
$75,000 to $99,999 1,804 7.9% 2,146 9.9% 19.0%
$100,000 to $124,999 821 3.6% 1,247 5.8% 51.9%
$125,000 to $149,999 341 1.5% 691 3.2% 102.6%
$150,000 to $199,999 139 0.6% 554 2.6% 298.6%
$200,000 or More 109 0.5% 379 1.8% 247.7%
Total 22,939 100.0% 21,572 100.0% -6.0%
Household Poverty
Given the relatively low median household incomes in Niagara Falls, assessing poverty is important.
In 2015-2019, it was estimated that one in four (25.6%) households in Niagara Falls was living below
the establish poverty threshold. That is an increase from 21.1% in 2005-2009. In all, there are 674
more households in poverty. To put this on context, the City accounted for almost half of the
County’s households in poverty in 2015-2019 with 46.6%. Its share increased from 43.3% in 2005-
2009.
Table 6: Households in Poverty, by Type
2005-2009 Percent 2010-2014 Percent 2015-2019 Percent
Family Households 2,289 10.0% 2,485 11.7% 2,698 12.5%
Non-Family Households 2,550 11.1% 2,812 13.2% 2,815 13.0%
Total Households in Poverty 4,839 21.1% 5,297 24.9% 5,513 25.6%
Total Households 22,939 100.0% 21,300 100.0% 21,572 100.0%
8Tenure
Tenure is defined as the way in which a household occupies its unit, either as an owner-occupant or
a renter-occupant. In Niagara Falls, the percent of households that own their home has decreased
from 59.1% in 2005-2009 to 55.7% in 2015-2019. Therefore, the percent of renter households has
increased, from 40.9% in 2005-2009 to 44.3% in 2015-2019. As shown in Table 8, lost a large
number of owners while gaining a small number of renters.
Table 7: Tenure
2005-2009 2010-2014 2015-2019
Number Percent Number Percent Number Percent
Owner 13,565 59.1% 11,999 56.3% 12,006 55.7%
Renter 9,374 40.9% 9,301 43.7% 9,566 44.3%
Total 22,939 100.0% 21,300 100.0% 21,572 100.0%
Table 8: Change in Owners and Renters
Gained Owners Gained Owners Lost Owners Lost
Lost Owners Gained Renters
Gained Renters Lost Renters Renters
Pendleton* (182/0) Lockport (T) (595/-150) Lewiston (-52/-60) Lockport (C) (-489/304)
Wheatfield (487/392) North Tonawanda (282/-371) Niagara (-237/205)
Niagara Falls (-1,559/192)
*Renters unchanged; Red = net loss in households
9Housing Profile
Having a grasp on the population and household provides an important foundation to develop
housing programs. The last step is to understand the characteristics of a community’s housing stock.
The purpose is to assess how people and households are housed and how the costs of housing relate
to household incomes. Explored here are the number, type, and size of units available; the rent and
mortgage costs paid by households as a percent of household income; and occupancy and vacancy.
Housing Units and Types
The total number of units in the City decreased from 2005-2009 to 2015-2019 by 1,865 units. A
decline in housing units, along with a decline in households, has a positive impact on the vacancy
rate. If the number of households and housing units decrease one-for-one, the vacancy rate would
remain unchanged given that a household is equal to an occupied unit. In Niagara Falls, the number
of households decreased by only 1,367, meaning the impact on the vacancy rate should be positive,
that is should be reduced, which as shown in the section below on occupancy and vacancy is the
case in Niagara Falls.
Table 9: Residential properties by number of units
2005-2009 2010-2014 2015-2019
Property Type Number Percent Number % Number Percent
1-unit detached structure 15,231 53.8% 15,746 59.8% 16,447 62.2%
1-unit, attached structure 469 1.7% 649 2.5% 668 2.5%
2-4 units 8,295 29.3% 6,109 23.2% 5,625 21.3%
5-19 units 2,219 7.8% 1,597 6.1% 1,887 7.1%
20 or more units 1,430 5.1% 1,816 6.9% 1,640 6.2%
Mobile Home, boat, RV, van, etc. 644 2.3% 429 1.6% 156 0.6%
Total 28,288 100% 26,346 100% 26,423 100%
Upon closer inspection, there was substantial increase in single-family detached homes, an increase
of 1,216, which seems to run counter what one might expect when the number of homeowners
declines. Intuitively, the substantial increase in units in structures with 2-4 units aligns with an
increase in renters. Given that these are ACS estimates, some caution with drawing conclusions
from these changes seems in order.
Unit Size by Tenure
The number of bedrooms is a critical amenity for those seeking housing. An adequate supply of
housing with various numbers of bedrooms represents, on the surface, a housing market offering
opportunities to all size households, regardless if they intend to rent or own. Considering the
following tables, which present the number of households by number of occupants and the number
of bedrooms, we can draw some simplistic observations.
First, there are 8,339 one-person households, which at their most basic, need a unit with no
bedroom (studio) or a single bedroom. However, there are only 2,823 (occupied) no-bedroom and
one-bedroom units. Meaning in many cases, one-person households are likely owning or renting
more housing than they need, which could lead to high rental and ownership costs. Second,
households with five or more people would like need or prefer at least 4 bedrooms, in the case of a
married couple with children, or at possibly five bedrooms in the case of a non-family household.
10There are 1,315 households in Niagara Falls with five or more people. There are, however, only 565
units with five or more bedrooms. And the families and units between these two extremes are likely
also mismatched.
Given the average household size in 2015-2019 was 2.22 persons, it appears the market is out of
balance for households, based on household sizes. There are not enough smaller units for smaller
households and not enough larger units for larger families.
Table 10: Housing Units by Number of Bedrooms
Owners Renters
Number Percent Number Percent
No bedroom 36 0.3% (0.2%) 282 2.9% (1.3%)
1 bedroom 277 2.3% (1.3%) 2,228 23.3% (10.3%)
2 bedrooms 2,456 20.5% (11.4%) 4,012 41.9% (18.6%)
3 bedrooms 7,039 58.6% (32.6%) 2,237 23.4% (10.4%)
4 bedrooms 1,754 14.6% (8.1%) 686 7.2% (3.2%)
5 or more bedrooms 444 3.7% (2.1%) 121 1.3% (0.6%)
Total 12,006 100% (55.7%) 9,566 100% (44.3%)
Table 11: Households by Number of Persons. 2015-2019
Occupied Units by # of
Households Number Number
Bedrooms
1-person household 8,339 0 and 1 Bedroom 2,823
2-person household 6,940 2 bedrooms 6,468
3-person household 2,673 3 bedrooms 9,276
4-person household 2,305 4 bedrooms 2,440
5+ person household 1,315 5+ bedrooms 565
Affordability and Cost Burden
A good understanding of a community’s housing cost is important for developing appropriate plans
and programs. For communities receiving funding from HUD to address low- and moderate-
income households, it is particularly important to ascertain what households are paying in rent and
mortgage costs, especially as it relates to the percent of monthly incomes incurred. In general,
households paying more than 30% of their monthly income on rent or mortgage are said to be cost
burdened. Those spending more than 50% are considered to be severely cost burdened.
The median home value and median contract rent (rent only) have increased by 6.0% and 4.4%,
which is troubling given that median household incomes have declined. Put another way, as the
median income declines and median costs increase, it likely increases the housing cost burden for
many households.
11Table 12: Median Home Value and Median Contract Rent
2005-2009* 2010-2014* 2015-2019 % Change
Median Home Value^ $75,684 $73,008 $77,400 6.0%
Median Contract Rent $495 $501 $523 4.4%
* In 2019 dollars
^ Owner occupied units
The table below indicates that the median gross rent (rent plus utilities) in the City of Niagara Falls
decreased 2.1% from 2005-2009 to 2015-2019. The trend aligns with the County, where it decreased
2.2%. Aside from the Town of Lockport, Niagara Falls had the lowest median gross rent in 2015-
2019. So, although median contract rent increases, the median gross rent decreases, a positive sign
for low- and moderate-income households.
Table 13: Median Gross Rent, 2005-2005 to 2015-2019
2005-2009 2010-2014 2015-2019 Change % Change
Niagara Falls $679 $688 $665 -$14 -2.1%
Lewiston $896 $854 $881 -$15 -1.7%
Lockport (C) $722 $698 $696 -$26 -3.6%
Lockport (T) $631 $605 $591 -$40 -6.3%
Niagara $703 $748 $778 $75 10.6%
North Tonawanda $722 $719 $706 -$16 -2.3%
Pendleton $647 $700 $898 $251 38.7%
Wheatfield $751 $707 $668 -$83 -11.0%
Niagara County $719 $707 $703 -$16 -2.2%
Despite the second lowest median gross rent in the County, which is also lower than the median
gross rent in Erie County ($829), 4,884 (51.1%) renter households in the City are rent burdened,
paying more than 30% of their monthly household income on rent. Of those, more than one in four
renter households (2,689) is severely rent burdened. This represents a decrease in total rent burden
households, down from 5,394 in 2005-2019.
Table 14: Gross Rent as a Percent of Household Income, 2015-2019
0.0%-15.0% 15.0%-29.9% 30.0%-49.9% 50.0% or more Not Computed
Niagara Falls 1,351 2,680 2,195 2,689 651
Lewiston 181 503 194 301 68
Lockport (C) 601 1,593 906 769 219
Lockport (T) 391 495 335 177 96
Niagara 169 422 146 249 30
North Tonawanda 819 1,637 809 734 152
Pendleton 13 59 0 66 35
Wheatfield 278 515 354 293 83
Niagara County 4,283 8,790 5,587 5,619 1,697
12Turning to homeowners, the rate of households paying more than 30% of this monthly income on
housing costs was 19.9%, with 2,386 owners. This is down from 3,780 households in 2005-2009,
which represented 27.9% of owner households.
Table 15: Monthly Owner Costs as Percent of Household Income, 2015-2019
0.0%- 15.0%-
30.0%-49.9% 50.0% or more Not Computed
15.0% 29.9%
Niagara Falls 5,745 3,778 1,198 1,188 97
Lewiston 2,380 1,830 503 271 25
Lockport (C) 2,000 1,827 638 271 30
Lockport (T) 2,701 2,634 723 487 32
Niagara 1,204 888 271 122 7
North Tonawanda 3,977 3,584 1,056 712 97
Pendleton 986 837 218 109 12
Wheatfield 2,549 2245 443 366 21
Niagara County 27,620 22,860 6,969 4,661 433
Occupancy and Vacancy
The vacancy rate in Niagara Falls remains relatively stable but also significantly high. At 18.4%, it
rivals, and in some cases exceeds, the vacant rate of a number of large so-called shrinking cities,
including the City of Buffalo, which has a vacancy rate of 15.8% in the same time period (2015-
2019).
Table 16: Occupancy and Vacancy, 2015-2019
2005-2009 2015-2019
Occupied Vacant (%) Vacant Other (%) Occupied Vacant (%) Vacant Other (%)
Niagara Falls 22,939 5,349 (18.9%) 1,748 (32.7%) 21,572 4,851 (18.4%) 1,311 (27.0%)
Lewiston 6,368 412 (6.1%) 186 (45.1%) 6,256 413 (6.2%) 91 (22.0%)
Lockport (C) 9,039 1,092 (10.8%) 461 (42.2%) 8,854 1,644 (15.7%) 505 (30.7%)
Lockport (T) 7,626 602 (7.3%) 65 (10.8%) 8,071 880 (9.8%) 203 (23.1%)
Niagara 3,540 280 (7.3%) 117 (41.8%) 3,508 219 (5.9%) 27 (12.3%)
Niagara Falls 22,939 5,349 (18.9%) 1,748 (32.7%) 21,572 4,851 (18.4%) 1,311 (27.0%)
North Tonawanda 13,666 646 (4.5%) 382 (59.1%) 13,577 1,398 (9.3%) 463 (33.1%)
Pendleton 2,153 149 (6.95) 82 (55.0%) 2,335 235 (9.1%) 109 (46.4%)
Wheatfield 6,268 598 (8.7%) 218 (36.5%) 7,147 344 (4.6%) 91 (26.5%)
Niagara County 87,854 10,258 (10.5%) 3,655 (35.6%) 88,519 11,854 (11.8%) 3,195 (27.0%)
13Some Considerations
Update the Analysis of Impediments to Fair Housing Choice – Although the Analysis of
Impediments is no longer a required effort of HUD grantees, Niagara Falls Community
Development is still required to affirmatively further fair housing. Currently grantees around the
country are still undertaking the AI as a means to meet their requirements to affirmatively further
fair housing. The AI would represent an opportunity for Community Development to engage with
stakeholders and residents and gather the information that was limited with the survey undertaken
here. Our experience conducting the Analysis of Impediments for Erie County, the City of Buffalo,
and the towns of Amherst, Cheektowaga, Hamburg, and Tonawanda found that stakeholder
meetings uncovered extensive information from the large pool of housing organizations and related
health and human services providers.
Conduct a Housing Market Assessment and Strategy – The City should undertake a detailed
housing market analysis and strategic plan that connects to the programs and strategies undertaken
by Community Development. Understanding the City’s position in the regional market and the
opportunities that exist to (re)position itself for reinvestment and redevelopment is critical in
changing current conditions. A given community’s housing market is producing outcomes based on
both internal and external systems, that work together to produce the results we see on the ground.
In other words, the system is working as currently designed. If a community wants to change the
outcomes in its housing market, it cannot expect the market and current systems (zoning, land use,
transportation, funding) as currently designed to simply create the outcomes a community might
hope for. Instead, a community needs to plan and implement strategic systems changes to affect
outcomes. A housing market assessment and strategy is a critical component in this process,
providing a pathway for local government and a blueprint for residents, both owners and renters,
but also the larger market, including developers and housing organizations.
Vacant Lot Management and Reuse Strategy – Based on a quick review of existing real property
tax records, there are approximately 2,144 vacant residential lots in the City of Niagara Falls, which
like many small and large urban areas, has been impacted by suburbanization and deindustrialization.
Although often seen as a key challenge to neighborhood reinvestment and revitalization, they should
be seen, instead, as a significant opportunity toward achieving neighborhood stabilization,
reinvestment, and revitalization. In other words, rather than seeing vacant lots as obstacles, a
strategic plan to manage and reuse lots envisions them as the foundation upon which neighborhood
conditions can improve. And this does not have to be through new building construction, but
through “clean and green,” urban agriculture, pocket parks, and stormwater uses. This type of effort
typically is identified through the development of a housing market study and strategy, as suggested
above. However, absent a plan to manage vacant lots, the market will continue to ignore these
spaces and they will continue to be a deterrent to progress.
14You can also read