Droneports - Redefining the UAS Industry
←
→
Page content transcription
If your browser does not render page correctly, please read the page content below

Droneports – Redefining
the UAS Industry

     Sallie Traxler, Co-Founder and Director, DronePort Network, Moderator
     Kraettli Epperson, CEO, Vigilant Aerospace Systems, Inc.
     Phil Heard, Portfolio Manager, Cimarron Capital Partners
     JaNae Barnard, Executive Director, Major County Economic Development Corporation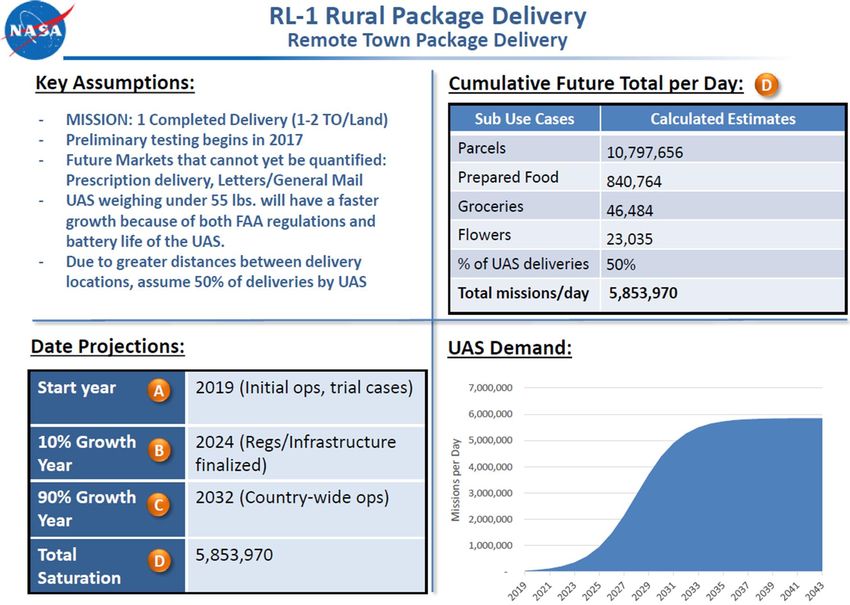
Presented   NASA May 2017, https://ntrs.nasa.gov/archive/nasa/casi.ntrs.nasa.gov/20170006091.pdf
by:
Drone Services Forecast
Examples from NASA (July 2019) representing 790,000 missions per day by 2024.
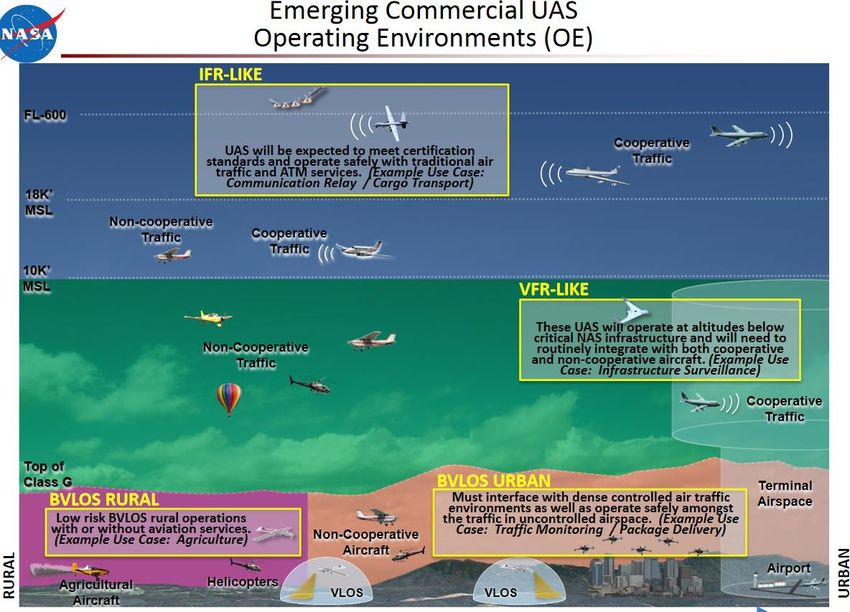
High risk - Flights in unsegregated airspace below 10,000 ft over rural and populated areas.
Low risk - Flights in Class G airspace and other low-risk rural locations.
Very low risk - Flights within Visual Line of Sight, below 400 ft, partially extended by Far Part 107 waivers.
Use case Missions per Safety
day at Risk
saturation
Construction 47,000 Very low
Wind Turbines 140 Very low
Power Lines 270 Low
Insurance Inspection 13,800 Low
Pipeline 3,900 Low
Surveying, Mapping 15,900 Low
Agricultural Survey and Inspection 2,000,000 Very low
Fence Line Security 30,000 Very low
Rapid Aerial Communications 790 Very low
Rail 1,500 Low
Tornado Watching, Flood Damage 1,900 Low
Weather Monitoring 620 High
Disaster and Forest Fire Response 560 High
Rural Package Delivery 5,800,000 Low
Presented
Values rounded. Source: ntrs.nasa.gov/archive/nasa/casi.ntrs.nasa.gov/20190007020.pdf
by:
a 2019 UAS Tech Forum presentation 3
Drone Services Forecast
            Examples from NASA (July 2019) representing 790,000 missions per day by 2024.
            High risk - Flights in unsegregated airspace below 10,000 ft over rural and populated areas.
            Low risk - Flights in Class G airspace and other low-risk rural locations.
            Very low risk - Flights within Visual Line of Sight, below 400 ft, partially extended by Far Part 107 waivers.
            Use case                                    10%                90%             Missions per             Safety
                                                     of market          of market             day at                 Risk
                                                                                            saturation
            Construction                                 2017               2020               47,000              Very low
            Wind Turbines                                                   2025                 140               Very low
            Power Lines                                  2018               2022                 270                 Low
            Insurance Inspection                                            2023               13,800                Low
            Pipeline                                     2019               2022                3,900                Low
            Surveying, Mapping                                              2022               15,900                Low
            Agricultural Survey and Inspection                              2022             2,000,000             Very low
            Fence Line Security                                             2025               30,000              Very low
            Rapid Aerial Communications                  2020               2024                 790               Very low
            Rail                                                            2025                1,500                Low
            Tornado Watching, Flood Damage                                  2026                1,900                Low
            Weather Monitoring                           2022               2030                 620                 High
            Disaster and Forest Fire Response            2023               2028                 560                 High
            Rural Package Delivery                       2024               2032             5,800,000               Low
Presented                                     Values rounded. Source: ntrs.nasa.gov/archive/nasa/casi.ntrs.nasa.gov/20190007020.pdf
by: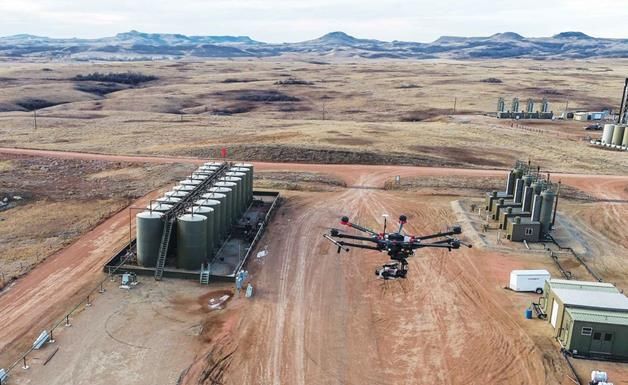
Rural Package Delivery

Presented
by:

Droneport estimates, Oklahoma
                                    Method                     Estimate, 2022
            MSAs, microSAs, and noncore counties                     21
            Uniformly distributed drone services demand              24
            FAA drone use by sector                                  29
            Basic and Unclassified General Aviation Airports          8

Presented
by: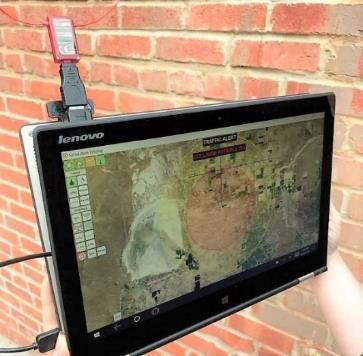
Drone Services Value Growth
Drone services market estimated at $4.4 billion in 2019
Forecast to reach $63.6 billion by 2025 at a CAGR of 55.9% from 2019 to 2025
https://www.marketsandmarkets.com/Market-Reports/drone-services-market-80726041.html
Presented
by:
Contents © 2019 Vigilant Aerospace Systems, Inc., All Rights Reserved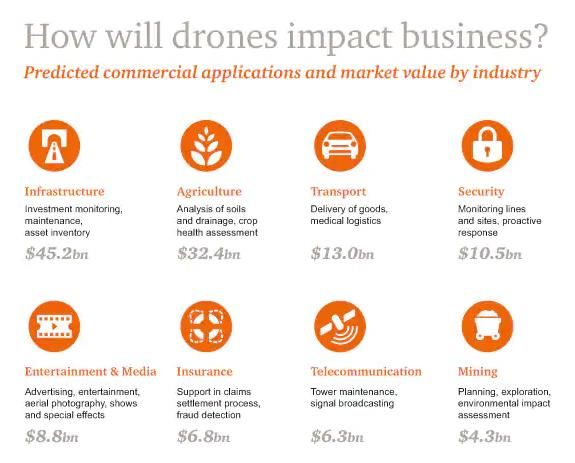
Source: https://www.pwc.pl/pl/pdf/clarity-from-above-pwc.pdf

Presented
by:
            Contents © 2019 Vigilant Aerospace Systems, Inc., All Rights Reserved
The Basic Questions
What do I need to think about to enable
BVLOS flights from my new droneport?
Who are the fliers? What industry are we
serving? How do we enable our
customers?
What does safety mean for us? What will it
mean to the FAA in our context?
What risks do I need to mitigate and what
problems do I need to solve?
What is a good, step-by-step plan for my
droneport to get this done?
Presented Contents © 2019 Vigilant Aerospace Systems, Inc., All Rights Reserved
by:
What is FlightHorizon?
Air safety system based on exclusively-licensed NASA patent
Software solution for individual unmanned aircraft pilots or airspace managers
Situational awareness and active avoidance of other aircraft
Integrates with essential hardware and data sources
Presented
by:
Contents © 2019 Vigilant Aerospace Systems, Inc., All Rights ReservedEXTRA
Presented
by:
a 2019 UAS Tech Forum presentation 11U.S. Non-Model Fleet Forecast
UAS in thousands
1,400
1,250,000
1,200
1,000
800 835,000
600 600,000
400
200
0
2018 2019 2020 2021 2022 2023
Low (annual growth rate 17%) Base (25%) High (36%) Base FY2018-2038
FAA Aerospace Forecast, FY 2019-2039
Presented
by:Presented NASA July 2019. ntrs.nasa.gov/archive/nasa/casi.ntrs.nasa.gov/20190007020.pdf by:
Presented
by:         NASA July 2019. ntrs.nasa.gov/archive/nasa/casi.ntrs.nasa.gov/20190007020.pdf
Markets                       Examples
                 Visual Line of Sight              Construction

                 Rural Low Altitude           Rural Package Delivery

                       VFR-like                 Disaster Response

                 Urban Low Altitude           Urban Package Delivery
                  Urban Passenger                     Air Taxi

                       IFR-like              Thin/Short Haul Commuter

            High Altitude - Long Endurance        Internet Service

                 Traditional Markets                   Cargo

Presented
by:
Uses of General Aviation Airports in Kansas, KDOT 2016
Infrastructure Insp.
Daily
Law Enforcement
Weekly
Search & Rescue
Monthly
Environmental Patrol
Seasonal
Firefighting
Photography & Survey
0 5 10 15 20 25 30 35
Number of Airports
Data from 73 airports, Kansas Aviation Economic Impact Study, KDOT 2016
Presented
by:You can also read