DROUGHE ESTIMATION AND MAPPING - CESBIO Mehrez ZRIBI, Michel le page - theia-land.fr
←
→
Page content transcription
If your browser does not render page correctly, please read the page content below
DROUGHE ESTIMATION AND
      MAPPING
     Mehrez ZRIBI, Michel le page
              CESBIO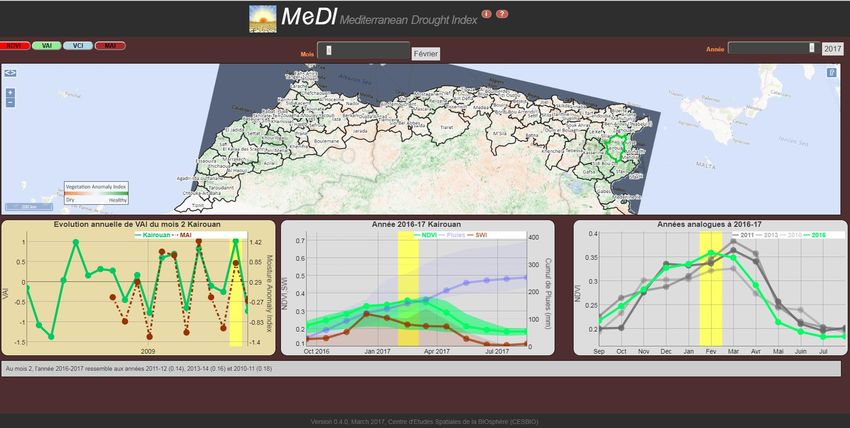
CESBIO/TOULOUSE
                  • Toulouse: second university city in France
                  • The world's largest higher education
                    institution in aerospace engineering
                  • Strong presence of the aeronautics, space
                    and high technology industry
                  • Toulouse III is 6th in the world in the
                    Shanghai ranking in remote sensing
                  • The climate and weather are super pleasant

                                                                 2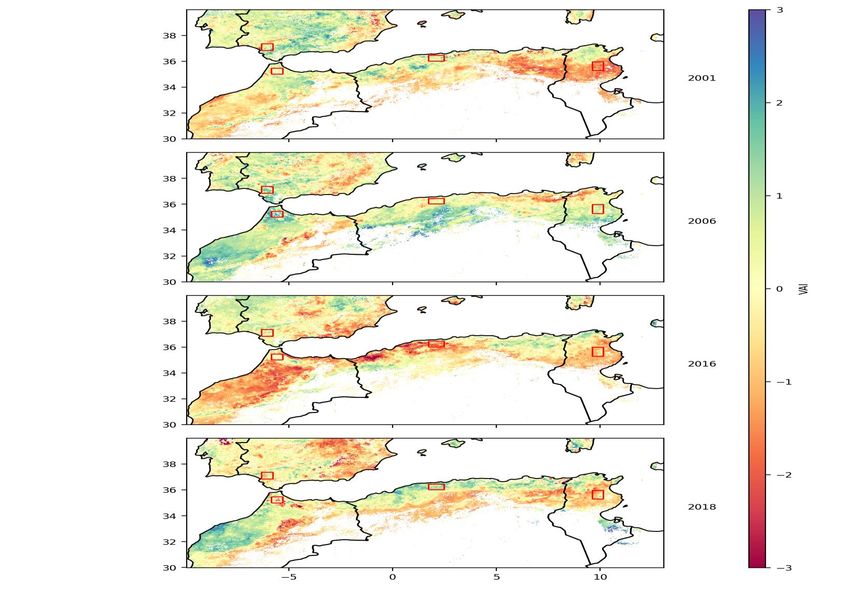
Land surface           Surface-climat        Remote sensing
 modelling
               Water               Agro-
                                ecosystems

                          In situ
                       observations

                                                              3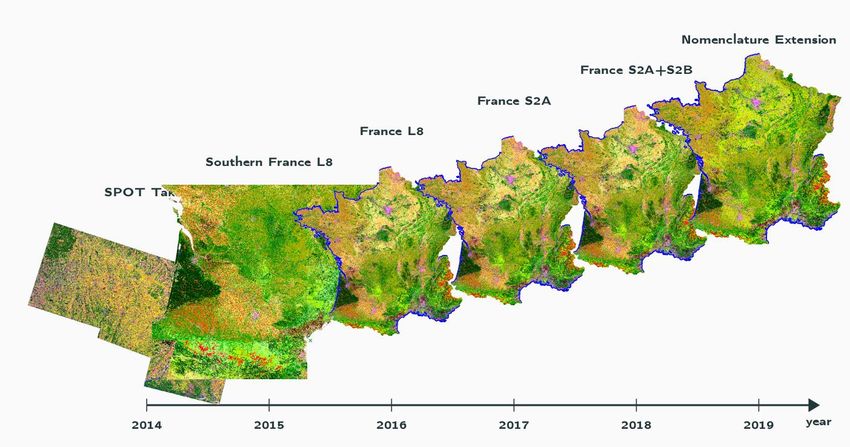
CESBIO and partners observatories

South West: OSR
India: IRP CEFIRSE
Lebanon: GDRI OLIFE
Morocco: LMI TREMA
Tunisia: LMI NAILA

                                                                              4
                              ICOS, JECAM, GEOGLAM, FLUXNET, ZA PYGAR, IR OZCAR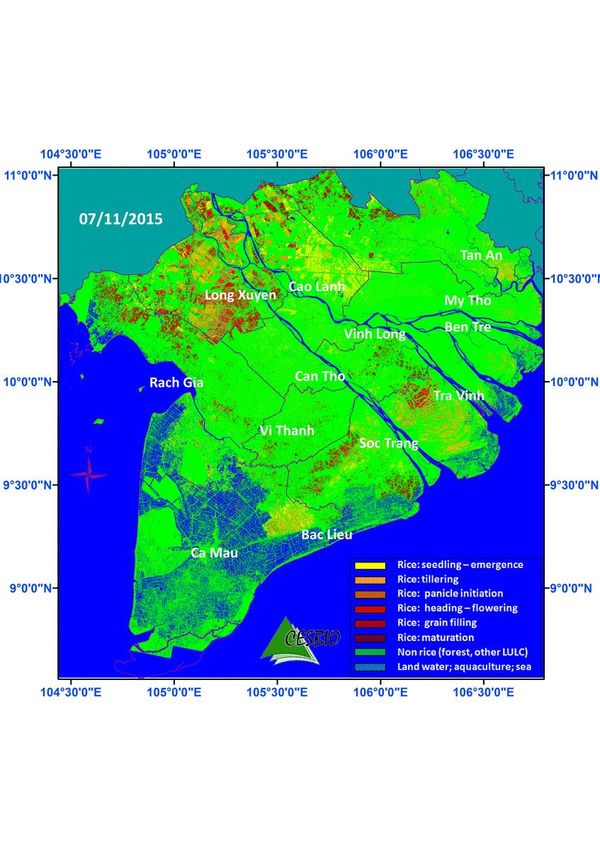
Satellite missions in CESBIO
2008     2010           2012      2014     2016   2018     2020          2022   2024       2026         2028   2030       2032
                         SMOS (ESA CNES)

                                                     VENµS (CNES, IAI)

                                                                                Biomass (ESA), P-Band

        Color codes
       Altimeters                                                                      TRISHNA (CNES/ISRO)
       L-Band Passive

       Optical
       Thermal
       Radar
       Precipitation                                                                                              SMOS-HR

                                                                                                                      5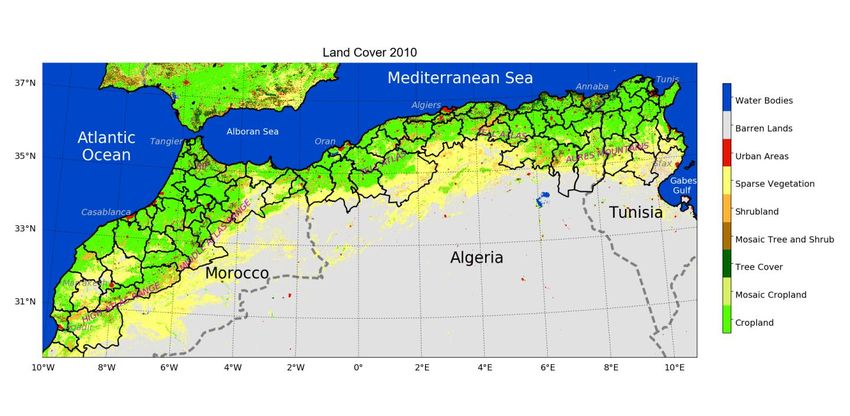
Satellite products

                     6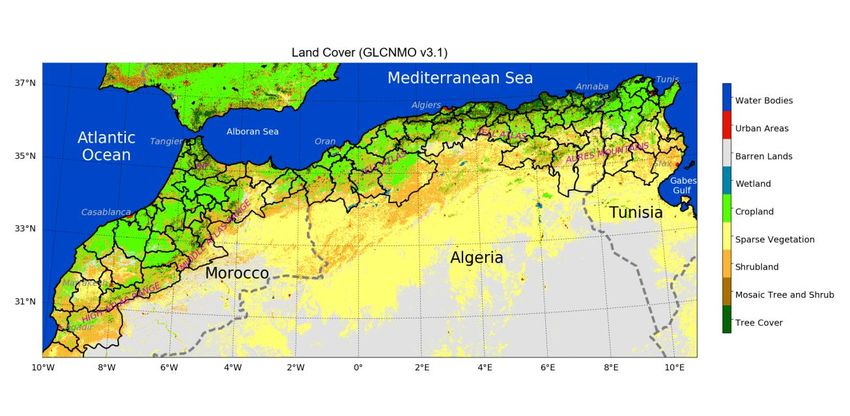
Spatialized plateforms
                                     29 Juin 2006                                  Model de transfert radiatif                             Cartes de Green Area Index
                                                                                  (e.g. BV-net de l'INRA Avignon)                                       m2 feuille/m2 sol
Spot, Landsat,
Sentinel 2                                                                                                                                       29/06/2006
                                                             Initialisation,             NDVI                                                        26/07/2006
                                                                                                                          Forçage,                       09/09/2006
                                                             assimilation
                                                                                                                          calibration
                                                                                                   Modèle
Sentinel 1, Terrasar X                                                                            spatialisé

                     Cartes dynamiques
                          des OSCartes
                                  et des
                            occupation
                              pratiques                                                  SAFYE/                SAFY
                                 du sol                                                  FAO56               Rendement                                    indice foliaire
                              culturales
                                                                                          Eau
                                           8 km                                                        CO2
                            Ré-analyses
                                 Météo                                                            SAFYE-CO2

                                                                                        Exemple de sortie
                                                                                                                                        Validation par stat. régionales
                             Cartes des                                                                                                   (Rendement / Irrigation)
                                   sols

                                                  Validation par stations de
                                                  mesure des flux (ET, Humidité        Bilans C des parcelles de blé en
                                                                                                2011 (gC.m-2)
                                                  sol…)
                                                                                                                                                                            7
Impacts of drought
   • Economic
   • Social
   • environmental
   • Impacts increase in response to increasing vulnerability
     resulting from increased pressure on limited water
     resources, population growth and many other factors.
   • Post-crash response increases vulnerability.
   • The impacts differ from one country to another.
Drought Characteristics
   •   Normal component of climate variability
   •   No universal definition
   •   Complex
   •   Interdisciplinary
   •   Impacts can be economic, social, environmental
   •   Impacts can persist for years
   ❖ The beginning and end of the drought are difficult to
     determine
   ❖ No precise and universally accepted definition of drought
   ❖ Non-structural impacts and spread over a large
     geographical area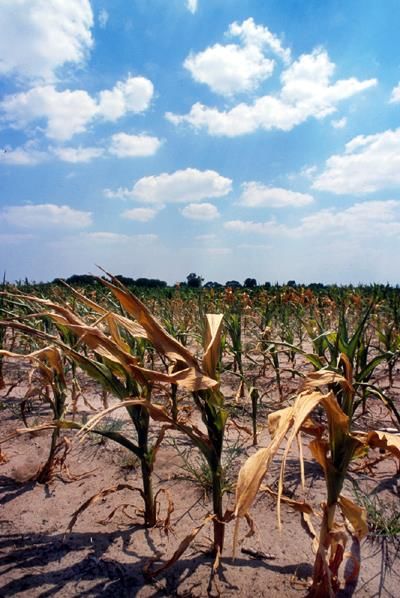
Agricultural Drought
→   Meteorological drought affecting agriculture

→   Usually, the first economic sector to be affected

→   Shortage of precipitation, ET, soil moisture, etc.

→   Demand for water from the plant in relation to
    available soil moisture
Monitoring of Drought • Importance of drought indices → Simplify complex inter-relationships and provide a good communication tool for many audiences → Quantitative assessment of climatic conditions → Provide a historical perspective that can be used in planning and design applications
Data and Methods
Long multi-spectral and multi-
resolution time series

                              SpotVeg, Proba-v – Sentinel-3

                                       MODIS - VIIRS

                    AVHRR

                    ERS

                                             ASCAT (Metop A-C)

                                                 SMOS, SMAP

      1980   1990           2000                2010             2020
Long multi-spectral and multi-
resolution time series
SpotVeg, Proba-v – Sentinel-3
MODIS - VIIRS
AVHRR
ERS
ASCAT (Metop A-C)
SMOS, SMAP
1980 1990 2000 2010 2020Selected Indices
• MODIS NDVI : Vegetation vigor
• MODIS LST : Land Surface Temperature
• ASCAT SWI : Soil Moisture
m (
s i
t )e − (t −ti ) T
SWI (t ) = i
for ti t
e
i
− (t −ti ) TNormalization of Remote Sensing Obs. VAI: Vegetation Anomaly Index NDVI: NDVI at one date NDVImean: mean of NDVI for a selected period s: standard deviation of NDVI → The same normalization is applied to Soil Moisture (MAI) and Temperature (TAI)
Mixed indices

Indi = αi VAIi + βi MAIi

         Indi − Indi    mean
GDIi =
               σInd,i

                               Zribi et al., RS, 2021
Classify drought on two dimensions
VAI Ambiguous: Healthy
vegetation but Dry Soil
DRY
-Inf -2S -1S 0 1S 2S Inf
-Inf
-2S
8 9
-1S 4 5
MAI
0 1
Ambiguous: Low 1S 7 6
vegetation but Wet
Soil 11 10 WET
2S
Inf
Le Page, Zribi, Scientific Reports, 2019Search for similar years using a drought vector
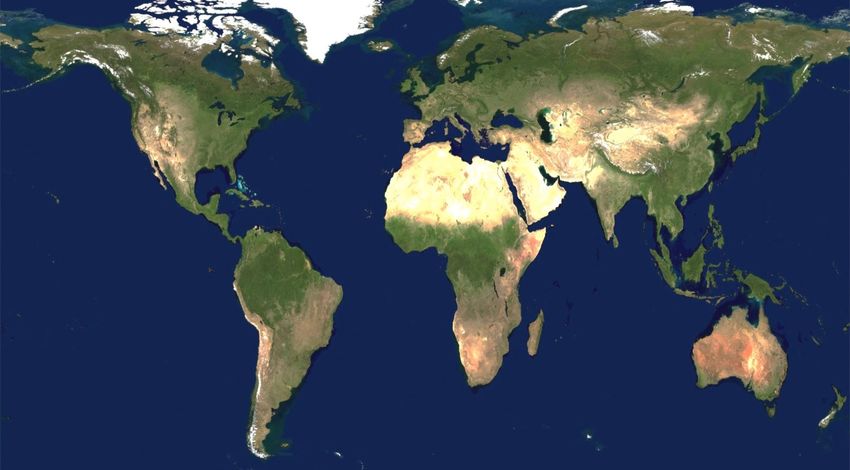
Study Area: North-West Africa

ESA CCI-LC
V2.0.7

GLCNMO V3.1
Caracterization of agricultural calendars
     Minimum of NDVI             Maximum of NDVI

  Average Date of maxNDVI      Stdev of Date of maxNDVI
Occurrences of Situations
VAI
-Inf -2S -1S 0 1S 2S Inf
-Inf
-2S
8 9
-1S 4 5
MAI
0 1
1S 7 6
11 10
2S
Inf
2007 to 2018, November to AprilOccurrences of Situations: Normal and moderate 2007 to 2018, November to April
Occurrences of Situations: Extremes

2007 to 2018, November to April
Occurrences of Situations: Ambiguous

 2007 to 2018, November to April
Drought qualification for the study area
50
VAI
45
% Moderately Dry
-Inf
-Inf -2S -1S 0 1S 2S Inf 40
35 %Very Dry
-2S
8 9
-1S 4 5 30
25
%
MAI
0 1
1S
20
7 6
11 10 15
2S
Inf
10
5
0
Avg.
2008
2009
2010
2011
2012
2013
2014
2015
2016
2017
2018
25
Good Vgt but Dry soil Good Vgt but Dry soil 2
VAI
-Inf -2S -1S 0 1S 2S Inf
Low Vegt but Wet soil 2 Low Vegt but Wet soil
-Inf 20
-2S
8 9
-1S 4 5 15
MAI
%
0 1
1S 7 6 10
11 10
2S
Inf 5
0
Avg.
2008
2009
2010
2012
2013
2014
2017
2018
2011
2015
2016
2007 to 2018, 90 administrative areas. November to April for each agricultural yearDrought qualification for the study area
50
45
% Moderately Dry
40
35 %Very Dry
30
25
% 20
15
10
5
0
Avg.
2008
2009
2010
2011
2012
2013
2014
2015
2016
2017
2018
25
Good Vgt but Dry soil Good Vgt but Dry soil 2
Low Vegt but Wet soil 2 Low Vegt but Wet soil
20
15
%
10
5
0
Avg.
2008
2009
2010
2012
2013
2014
2017
2018
2011
2015
2016
2007 to 2017, November to April for each agricultural yearDrought qualification for the study area
50
45
% Moderately Dry
40
35 %Very Dry
30
25
% 20
15
10
5
0
Avg.
2008
2009
2010
2011
2012
2013
2014
2015
2016
2017
2018
25
Good Vgt but Dry soil Good Vgt but Dry soil 2
Low Vegt but Wet soil 2 Low Vegt but Wet soil
20
15
%
10
5
0
Avg.
2008
2009
2010
2012
2013
2014
2017
2018
2011
2015
2016
2007 to 2017, November to April for each agricultural year50
45
% Moderately Dry
40
35 %Very Dry
Use cases for the peculiar years
30
25
%
20
15
10
5
0
Avg.
2008
2009
2010
2011
2012
2013
2014
2015
2016
2017
2018
25
Good Vgt but Dry soil Good Vgt but Dry soil 2
Low Vegt but Wet soil 2 Low Vegt but Wet soil
20
15
%
10
5
0
Settat, Morocco Aïn Defla, Algeria Kairouan, Tunisia
Avg.
2008
2009
2010
2011
2012
2013
2014
2015
2016
2017
2018
2007-08
2015-16
2017-18
NDVI SWI Cumulative RainfallPerformance of the forecast
Percentage of Percentage of Average Rank
First Analog First or Second
Analog
November 21.2 38.4 4.09
December 32.6 53.0 3.12
January 47.5 72.4 2.46
February 57.3 80.0 2.03
March 71.4 91.7 1.51
April 100 100 1Use Case: Settat, Morocco
Use Case: Settat, Morocco
    1         1         -

    3         1         1

    3         1         1

    2         1         3

    1         1         1
A Webapp with monthly updates
Thank you for your attention
You can also read