E-BOOK AND UNDERGRADUATES' LEARNING OF STATISTICS: A MALAYSIAN PERSPECTIVE
←
→
Page content transcription
If your browser does not render page correctly, please read the page content below
Research and Practice in Technology Enhanced Learning
Vol. 9, No. 2 (2014) 263-281
Ó Asia-Pacific Society for Computers in Education

       E-BOOK AND UNDERGRADUATES’ LEARNING OF STATISTICS:
                    A MALAYSIAN PERSPECTIVE

                                         BIBIANA CHIU-YIONG LIM
                                      Faculty of Business and Design
                           Swinburne University of Technology (Sarawak Campus),
                                       Kuching, Sarawak, Malaysia
                                         blim@swinburne.edu.my

                                              KIAN-SAM HONG
                            Faculty of Cognitive Sciences and Human Development
                                        Universiti Malaysia Sarawak,
                                     Kota Samarahan, Sarawak, Malaysia
                                            hksam@fcs.unimas.my

                                          NORAZILA ABDUL AZIZ
                            Faculty of Cognitive Sciences and Human Development
                                        Universiti Malaysia Sarawak,
                                     Kota Samarahan, Sarawak, Malaysia
                                            anora@fcs.unimas.my

     Universities are trending toward electronic books (e-books) as instructional materials, gradually
     displacing the traditional print books. However, there seems to be an incomplete body of knowledge
     on which e-books presentation formats students prefer, particularly when learning statistics. This
     paper reports the findings of a research conducted to investigate the effects of three e-book formats
     namely, text and static image (T&S), text and animation (T&A) and text and multimedia (T&M) on
     student achievement in a first year undergraduate statistics unit at a private university in Malaysia.
     The e-book used in this study was designed and developed based on Clark and Mayer’s (2011)
     multimedia principles and Cognitive Theory of Multimedia Learning. The findings showed that the
     use of the different e-book formats had significant effect on student achievement in the statistics unit.
     The students using the T&A and T&M e-book formats as instructional materials had higher scores in
     the unit assessment compared to those using the T&S e-book format. In addition, positive learning
     experiences and higher preferences for using the e-books were also reported by the students using
     the T&A and T&M e-book formats. These findings indicate that aspects of e-book design need to
     also be considered when adopting e-book as instructional materials for learning.

     Keywords: Achievement; animation; cognitive theory of multimedia learning; electronic books;
     statistics; multimedia; text and image.

                                                       263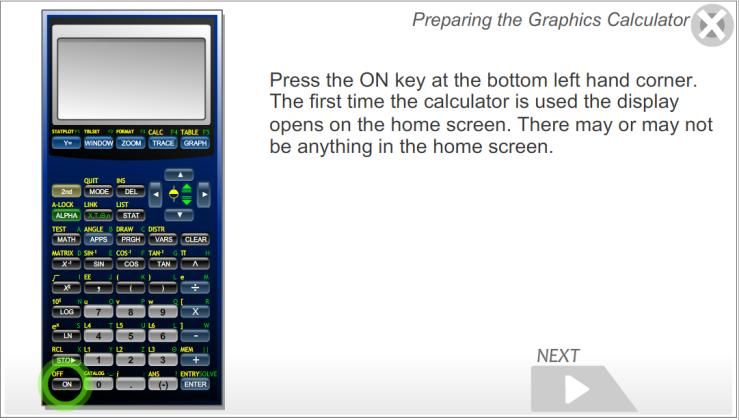
264   B. C.-Y. Lim, K.-S. Hong and N. Abdul Aziz

1. Introduction
Rapid technological advancement and its application in education over the past decade
have changed the way instructors deliver and learners acquire information (Foasberg,
2011). Information is no longer restricted to only print textbooks as in the past. Print
textbooks are gradually being replaced with electronic books (e-books). E-book can be
defined as a book presented in electronic or digital format, either on dedicated e-book
readers such as Apple I-Pad (Smith & Kukulska-Hulme, 2012), Amazon Kindle E-book
Reader (Lebert, 2009), or undedicated devices such as tablet PCs, laptops, desktop
(Genuth, 2008; Lebert, 2009) and mobile phones (Uluyol & Agca, 2012). E-book is
considered as an emerging technology and currently of interest in higher education
setting, especially in the context of e-learning (Appleton, 2005; Baumann, 2010;
Foasberg, 2011; Lonsdale & Armstrong, 2010; Miller, 2010; Rothman, 2006; Wong,
Liong, Lin, Lower, & Lam, 2011). Appleton (2005) observed, “With printed textbooks
being well integrated into traditional teaching and learning in higher education, the next
obvious resource to embed into e-learning would be the e-book” (p. 56). Rothman (2006)
agreed, “If ever a promising technology existed for education, and e-learning in particular,
it would be e-books” (p. 1).
    Major publishers are also interested in promoting and supplying electronic versions of
higher education books. McGraw-Hill Education has 95% of their books published both
electronically and in hardcopy (Warren, 2009). In 2013, it launches its SmartBook, an
interactive and adaptive e-book for tablets, desktops and laptops with voice instruction,
offering tutoring and highlighting information to ease learning (Empson, 2013). Kno
(www.kno.com), an education software company, promotes its newest software of
KnoMe for e-book, where students can “check-in frequently to see near real time stats on
their study behavior, interaction levels, time management and personal progress” (Trew,
2013, para 2). The software also includes features for social sharing, enabling learners to
engage in group discussion activities.
    A number of universities have already initiated the move toward becoming a
“bookless” institution of higher learning (Ghaebi & Fahimifar, 2011). By doing so, their
learners would be able to obtain up-to-date information and be connected to the Internet
with ease. E-book adoption by universities in Malaysia, particularly by the university
libraries, began in 2002. The first university to adopt e-book as part of their library
collection was the Open University of Malaysia (OUM) in June 2002. This was followed
by the University of Malaya (UM), the University of Science Malaysia (USM) and the
University of Putra Malaysia (UPM) in 2008 (Ismail & Zainab, 2005; Letchumanan &
Tarmizi, 2011). Recognizing the need for e-book adoption by Malaysian higher education
learners, the Malaysian Ministry of Education has allocated more than RM1.04 million to
finance university libraries’ subscription to the netLibrary in 2010 (Letchumanan &
Tarmizi, 2011).
    There are a number of e-books presentation formats – electronic textbooks, electronic
static picture books, electronic animated books, electronic talking books, electronic
multimedia books, electronic intelligent books and electronic space books (Ghaebi &
E-book and Undergraduates’ Learning of Statistics: A Malaysian Perspective 265
Fahimifar, 2011). According to Clyde and Delohery (2005), the format frequently used is
the static images with text. In academic libraries, however, the commonly found e-book
formats are electronic textbooks, electronic animated books and electronic multimedia
books (Foasberg, 2011).
E-books can be tailor-made and customized by instructors (Wong et al., 2011). To
ensure that their use would have significant effects on students’ learning, the formats and
the design of the e-books chosen need to be reflective of the students’ learning needs as
well as their learning preferences. Findings from research on learning sciences,
specifically on how to scaffold learning using technology and how to engage students in
their learning process should be accounted for when designing e-books for learning or
adopting its use as instructional materials.
2. Review of Related Literature
The first discussion of e-book as an alternative to traditional print began in 1971 with the
inception of Project Gutenberg, a digital library for books from public domain which, at
present, offers more than 30,000 free public domain e-books through the Internet
(Foasberg, 2011). The spread of the Internet in the 1990s results in more books published
in digital formats (Baumann, 2010). The use of Hyper Text Markup Language (HTML)
compiler enables e-books to act like web pages, making it possible to create a new
learning experience for users (Lai & Newby, 2012). E-book should leverage on dynamic
visual and verbal formats such as animation and multimedia rather than become reliant
on text and static images (Li, Chen, & Sheng, 2013; Richardson, Smith, Lenarcic,
McCrohan, & O’Hare, 2010; Warren, 2009). Dynamic visual and verbal formats which
encompass static words, images, audios, videos, and animations could move students
from assuming a passive role to a more active one, enabling them to be more engaged in
a creative and constructive learning experience (Baumann, 2010; Lai & Newby, 2012).
Findings from recent studies investigating effect of different presentation formats on
learning achievement seem to indicate that the use of multimedia promotes better
learning experience. Zheng, McAlack, Wilmes, Kohler-Evans, and Williamson (2009)
found that students understand better when watching animated images which are
accompanied with auditory explanation compared to simply watching animated images
while verbally reading an onscreen-text explanation. Kuhl, Scheiter, Gerjets, and
Gemballa (2011) also reported that learners are more engaged and gain deeper
understanding when animated or dynamic and static visualizations are used. Similar
findings were also reported by Mason, Tornatora, and Pluchino (2013); they found that
better performances in science were observed among their students when graphics were
used with text as instructional materials.
The e-books used in this study were designed based on Mayer’s (2009) Cognitive
Theory of Multimedia Learning (CTML) and Clark and Mayer’s (2011) multimedia
principles. The multimedia component used in the e-books include a combination of text,
audio, animation, video, still images and interactive content. There are three assumptions
of CTML - (a) Working memory is made up of a dual modality input channel system; (b)266 B. C.-Y. Lim, K.-S. Hong and N. Abdul Aziz
Working memory has a limited capacity; and (c) Learners engage actively in processing
learning materials. Dual modality refers to the use of dual channel of representations
(verbal and non-verbal) to process information, which is argued to be better than the use
of a single channel in enhancing learning experience (Mayer & Moreno, 2003). Each
channel has a certain capacity for information processing in working memory, where
verbal and visual channels can each only process a certain amount of information at one
time (Mayer, 2001). The last assumption highlights the need for learners to be engaged in
active processing, and for this to happen, the design of the instructional materials must
take into account learners’ prior knowledge and linking it with the new information in an
organized manner so that the information obtained can be transferred into their long term
memory.
Based on the CTML assumptions, Clark and Mayer (2011) further developed seven
multimedia design principles, five of which were applicable in the design of the e-books
used in this study. These principles are (a) Multiple Representation Principle: Learners
learn more deeply from a combination of words and pictures than from words alone; (b)
Contiguity Principle: When giving a multimedia explanation, words should be located
near the corresponding pictures, rather than farther away from them, (c) Split-Attention
Principle: Learners learn more deeply when the text are presented with auditory narration
rather than written text; (d) Coherence Principle: When giving a multimedia explanation,
a damaging effect on learning occurs if interesting but irrelevant words and pictures are
added to the learning materials; and (e) Personalisation Principle: Students learned better
by hearing text in an informal, conversational style compared with a formal style.
The use of e-books for learning has indeed generated much interest among instructors
and students (Guan, 2009). Existing research on e-books have focused on aspects of their
use and usability, including patterns of use, e-book users’ level of satisfaction, awareness
of and attitude toward e-books, and e-book projects such as Virtual Book or Hyper-
Textbook projects (Ghaebi & Fahimifar, 2011; Letchumanan & Tarmizi, 2011). However,
there is still a need for research that investigates students’ experiences with different e-
book and media formats (such as text, static images, animation and multimedia) and
whether these e-book formats affect the students’ level of achievement (Baumann, 2010;
Lebert, 2009; Neumann, Neumann, & Hood, 2011).
3. Purposes of The Study
Despite a great amount of writings devoted to media formats which were used
pervasively in education (Guan, 2009; Kuhl et al., 2011), there were still debates on
which format can enhance learning, particularly in e-book. Hence, this research aimed to
investigate the effects of three e-book formats on students’ achievement in statistics. The
three e-book formats are text and static image (T&S), text and animation (T&A) and text
and multimedia (T&M). The content of the e-books focused on the use of a graphic
calculator (Ti-83 model) for an introductory statistics course. The study also investigated
user’s preferences and usage of the three e-book formats.E-book and Undergraduates’ Learning of Statistics: A Malaysian Perspective 267
4. Research Methodology
4.1. Site and sample
The study was carried out at an Australian university branch campus in Malaysia. It
involved a 12-week learning session in a first year undergraduate statistics course. The
participants of this study (N = 89) were enrolled in the statistics subject of Quantitative
Analysis for the Bachelor of Commerce program and constituted a homogeneous sample
in terms of age. Majority of the participants were local (Malaysian) with a ratio of 7:1
local to international students. The international students were from Bangladesh,
Indonesia, Sri Lanka and Pakistan, to name a few. It was assumed that the participants
had similar background knowledge in statistics and were new to using Ti-83 graphic
calculator and e-book in statistics learning.
Participation in the study was voluntary and there were no extra credit or inducement
given. Once the students were allocated into tutorial groups at the beginning of the
semester through self-selection in the Allocate+ system, each tutorial group was then
assigned to one of the three e-book formats designed for the purpose of this study. Each
participant was also given a notice of Consent Information Statement beforehand and
indicated agreement to participate in the study before it commenced.
4.2. Research design
This study used a quantitative quasi-experiment with non-equivalent group, posttest-only
control group research design. Pretest was not included in the study as the students
enrolled in this statistics course had not been taught to use Ti-83 calculator in their
previous study, and control and treatment group sizes remained constant throughout the
duration of the study. Therefore, the posttest-only design was appropriate for this study
(Gay & Airasian, 2003). A summary of the demographic characteristics of the
participants is presented in Table 1.
Table 1. Participant distribution of each e-book format group of the study.
Demographics Variables T&S T&A T&M Overall
N(30) % N(29) % N(29) % N(89) %
Gender Male 11 36.7 18 60.0 13 44.8 42 47.2
Female 19 63.3 12 40.0 16 55.2 47 52.8
Commerce Accounting 14 46.7 11 36.7 11 37.9 36 40.4
Major Marketing 5 16.7 8 26.7 6 20.7 19 21.3
Human Resource 1 3.3 0 0.0 0 0.0 1 1.1
International Business 4 13.3 7 23.3 3 10.3 14 15.7
Others 6 20.0 4 13.3 9 31.0 19 21.3
Computer Less than 5 years 6 20.0 3 10.0 4 13.8 13 14.6
Usage More than 5 years 24 80.0 27 90.0 25 86.2 76 85.4268 B. C.-Y. Lim, K.-S. Hong and N. Abdul Aziz
4.3. The e-book formats
The e-book formats used in this study were Text and Static image (T&S), Text and
Animation (T&A), and Text and Multimedia (T&M). The T&S format was assigned to
the control group whereas the two treatment groups used the T&A and the T&M formats.
The following presents a brief description of each of the formats used.
Text and Static Image (T&S) e-book
This e-book basically contained static text, pictures, graphs and other static illustrations
which were scanned from the statistics paper-based textbook. A screen shot of this e-
book format is presented as Figure 1.
Text and Animation (T&A) e-book
This e-book included text and animated interpretation of the Ti-83 graphic calculator. A
hyperlink [Animation] was shown next to the explanation of the subtopic and when
clicked, a new Window would show a step by step animated version of Ti-83 graphic
calculator, based on the statistics functions. This is shown in Figure 2a. The T&A e-book
allowed learners to follow the steps of using Ti-83 graphic calculators by clicking the
“Next” button. The animation contained a graphic interpretation with visual elaboration
of a Ti-83 graphic calculator as shown in Figure 2b.
Figure 1. Screen shot of T&S of the e-book.E-book and Undergraduates’ Learning of Statistics: A Malaysian Perspective 269
Figure 2a. Screen shot of an [Animation] hyperlink on the e-book.
Figure 2b. Screen shot of a T&A image of the e-book in a “pop-up” window.
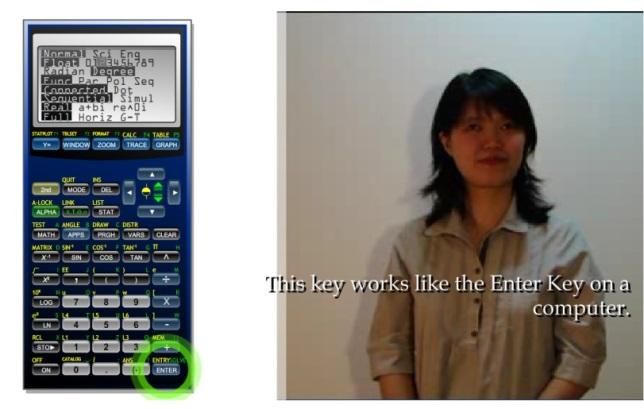
Text and Multimedia (T&M) e-book
The T&M or video presentation was similar to the T&A e-book format, with a hyperlink
[Video] inserted next to the subtopic explanation on how to use the Ti-83 graphic
calculator. When the hyperlink [Video] is clicked, a “pop-up” Window would show a
video with audio presentation, assisted by animated version of Ti-83 graphic calculator.
This is shown in Figure 3.270 B. C.-Y. Lim, K.-S. Hong and N. Abdul Aziz
Figure 3a. Screen shot of a [Video] hyperlink on the e-book.
Figure 3b. Screen shot of a T&M image of the e-book in a “pop-up” window.
4.4. Research instruments
The two treatment groups were assigned to the T&A (X T1) and T&M (XT2) e-book
formats respectively while the control group was assigned to the T&S e-book format (X C).
There were 30 participants each in the T&S and T&A e-book format groups and 29
participants in the T&M e-book format group. A summary of the research design used in
this study is presented in Table 2.E-book and Undergraduates’ Learning of Statistics: A Malaysian Perspective 271
Table 2. Summary of non-equivalent group, posttest-only design.
Groups Treatment Groups Data collection
Group 1 Control (XC) O1→ O2→ O3
Group 2 Treatment (XT1) O1→ O2→ O3
Group 3 Treatment (XT2) O1→ O2→ O3
Note: XC = Text and Static Image, XT1 = Text and Animation, XT2 = Text and Multimedia,
O1 = Mid-Semester Test, O2 = Questionnaire, O3 = Final Examination
As shown in Table 2, data for this study were collected using questionnaire (O2),
Mid-Semester Test (O1) and Final Examination (O 3). Both the Mid-Semester Test and
Final Examination also formed part of the posttest data. Questions for the Mid-Semester
Test and Final Examination were developed by the subject lecturer. Both posttests
consisted of short answer questions. The Mid-Semester Test consisted of 12 questions
while Final Examination contained 13 questions. The one hour Mid-Semester Test
covered Chapter 1 and Chapter 2; meanwhile the three hour Final Examination covered
Chapter 3 to Chapter 8. The Mid-Semester Test carried the weightage of 25% while the
Final Examination carried the weightage of 60% of the overall total mark. The remaining
marks were allocated in Individual Assignment (15%), which was not considered in this
study as Ti-83 graphic calculator was not used to complete this assessment. The Mid-
Semester Test and Final Examination papers were marked and the grades of the
participants were compiled by the subject lecturer without identifying any participants to
the researcher for this research purposes. The researcher did not teach any of the
participants in the three groups during the study. The reliability of the two posttests were
measured based on Cronbach’s alpha values and was considered reliable (Cronbach’s α =
0.844).
The questionnaire used in the study had three open-ended questions as shown in
Table 3 and all participants were involved in answering the questions. The open-ended
questions provided qualitative understanding on students perception on the extent e-book
helped or hindered their learning.
4.5. Data collection procedures
The study began with the researcher introducing the procedures of the study to the
participants during the first week of lecture. During the second week of the study, when
Table 3. Open-ended questions in the questionnaires.
Questions
Looking back on your experience of using the e-book, please share the problems that you have encountered.
In your opinion, is the e-book useful for your learning?
Any other comments that you would like to provide regarding the use of this e-book?272 B. C.-Y. Lim, K.-S. Hong and N. Abdul Aziz
tutorial classes had commenced, the participants were shown how to access the link to the
e-book format online. All of the students were reminded to use the e-book to help them
understand the usage of Ti-83 graphic calculator in solving the tutorial questions
throughout the semester. Besides using the e-book during tutorial sessions, students could
learn using the e-book at home but they could only interact with their classmates who
were in the same treatment group.
The participants were informed to use the e-book (via website) for the first 6 weeks of
the semester to learn how to use the Ti-83 graphic calculator for Chapter 1 and Chapter 2.
At the end of the 6 weeks, participants were given the first posttest, Mid-Semester Test.
After the Mid-Semester Test, the participants continued to use the assigned e-book. At
the end of the semester (after 12 weeks), the participants were given final posttest as part
of the Final Examination administered to measure their learning achievement. The results
of Mid-Semester Test and Final Examination obtained after grading the exam papers
were entered into SPSS. All data were kept anonymous and confidential. The lesson
content in the control group and both treatment groups were the same; however, the
method of presentation for each of the e-book formats was different.
4.6. Data analyses
The data analyses were carried out using SPSS based on the research objectives of the
study. A One-Way between groups Multivariate Analysis of Variance (MANOVA) was
performed to investigate the difference between the three e-book formats in the two
posttests (Mid-Semester Test and Final Exam). Analysis began with evaluation of
assumptions. The six assumptions for MANOVA are: (1) sample sizes, (2) multivariate
normality, (3) linearity, (4) homogeneity of regression, (5) homogeneity of the variance-
covariance matrices, and (6) multicollinearity (Tabachnick & Fidell, 2007).
The open-ended questions survey data provided qualitative understanding of how the
students perceived the use of the different e-book formats. This study employed what is
generally referred to as theme-centered analysis (Babbie, 2013). It is a technique to
extract desired information from data by categorizing the data into meaningful themes
(Babbie, 2013). In this study, excerpts in the form of short phrases or sentences were
selected and studied. Then, the data were grouped into themes and constant comparative
method was used. Maykut and Morehouse (1994) defined constant comparative method
as a process of coding the data by category, comparing meanings across categories,
refining categories, exploring relationships and patterns across categories and integrating
the data. This was followed by the rules of inclusion where statements from the data
served as the basis for including or excluding a unit of analysis in the category (Babbie,
2013; Maykut & Morehouse, 1994). Hence, pieces of data would often intersect to make
meaningful connections and build categories of relevant information. Table 4 shows the
categories related to participants’ perception toward e-book formats.E-book and Undergraduates’ Learning of Statistics: A Malaysian Perspective 273
Table 4. Categories, rules of inclusions, and examples for coding the participants’ perceptions toward e-book
formats.
Categories Rules of inclusion Examples
Physical Participants felt that they were mostly “I need to have a computer to open the e-book while
constraint tired, having fatigue, having eye- having a textbook is easier. My eyes become tired
strain, and having difficulty looking at the computer screen for a long time.”
remembering information especially (Participant A from T&S e-book group)
when using T&S e-book format. This “I have difficulty in recalling what I have read in the e-
was indicated by comments such as book and following the video on screen. Sometime I
“tiredness”, and “dizzy”. felt like I’m just watching a short movie and my mind
wondered elsewhere.” (Participant K from T&M e-
book group)
Time Participants felt that it was time- “I still think printing textbook is better as it saves time.
constraint wasting to use e-book to learn Searching for some information in the e-book is a
statistics which indicated by waste of time and slower. I need to hit the forward
comments such as “waste time”, and button to look for a certain method to use the graphic
“slow”. calculator.” (Participant B from T&S e-book group)
“I think it is a waste of time to sit in front of the
computer and listening to the video. I am somehow
discouraged to follow the video all throughout the
semester.” (Participant J from T&M e-book group)
Onscreen Participants commented that the “I am kind of lazy to access the e-book and to go
design navigation of the e-book was difficult through the pages. I don’t like to click on the page by
problem to follow and the font sizes were too page to read the e-book. I think textbook is still better
small for reading especially T&S e- for easy access.” (Participant F from T&S e-book
book format. Other indications were group)
phrases such as “difficulty in “The font size is too small to read and it is difficult to
navigation”, “font size too small”, read from the screen.” (Participant C from T&S e-book
“difficult to read”, and “design group)
problem”.
Positive Participants found the e-book to be a “I like the idea of having video and sound, seem like a
responses new experience and generally lecture within the e-book. It interests me in learning
motivated (phrases such as “like”, statistics.” (Participant O from T&M e-book group)
“good”, “nice”, and “interested”) the “I think the animation is easy to follow to learn [how to
participants toward using the e-book. use] the calculator. I find it interesting.” (Participant N
from T&A e-book group)
Negative Participants expressed their general “It’s troublesome and the e-book did not help me much
responses negative experiences when using the in learning.” (Participant A from T&S e-book group)
e-books. These were indicated by “I don’t think learning statistics with graphic calculator
comments such as “troublesome”, is going to help in our future (working life) because we
“not helping”, “difficult to follow”, may not use it anymore.” (Participant G from T&A e-
and “boring”. book group)274 B. C.-Y. Lim, K.-S. Hong and N. Abdul Aziz
5. Results
The results shown in Table 5 indicate an improvement in the students’ mean score for
Mid-Semester Test to the mean score of Final Examination. Both scores had a maximum
of 100 marks. The participants assigned to the T&S e-book format scored the lowest in
both Mid-Semester Test and Final Examination as compared to participants in T&A and
T&M groups who scored almost similar results in both the Mid-Semester Test and Final
Examination.
A One-Way between groups Multivariate Analysis of Variance (MANOVA) was
performed to investigate differences between the three e-book formats on the two
posttests (Mid-Semester test and Final Examination) to answer the research question
“Were there differences in the students’ achievement in the statistics subject for the three
e-book formats?” Analysis began with evaluation of assumptions. The testing for the six
assumptions of MANOVA indicated no major violations of these assumptions. Since the
sample size was greater than 30, assumptions of normality and equal variances were of
little concern (Castellan, 2010). The assumptions of univariate normality were not
violated as the test values for Shapiro-Wilk were found to be not significant (p > 0.005).
The Mahalanobis distance test failed to identify any multivariate outliers as the
Mahalanobis distance of all cases was less than χ2 (3) = 16.27 (p > 0.005). The two
posttests were significantly related shown by the significant correlation between the two
posttests (r (88) = 0.743, p < 0.005). Since the correlations among the two posttests were
fairly high, the problem of multicollinearity did not exist (Coakes & Steed, 2003). The
Box’s M statistics test reported a value of 8.76 (p > 0.005) and the Levene’s test of
equality of error variances was not significant (p > 0.005) indicating that the homogeneity
assumption of the covariance matrices was satisfied.
Results from the MANOVA showed that there were significant differences between
the three e-book formats groups for the two posttests (F(4, 85) = 5.48, p < 0.005; Wilks’
Lambda = 0.785; partial ɳ2 = 0.11) with the following results for the Mid-Semester Test
(F (2, 86) = 9.49, p < 0.005, partial ɳ2 = 0.18) and Final Examination (F (2, 86) = 10.24,
p < 0.005, partial ɳ2 = 0.19). An inspection of the mean scores (refer to Table 5) showed
that (1) participants scored higher in Final Exam than Mid-Semester Test, and (2) there
Table 5. Summary of the posttest outcomes for different e-book format groups.
E-book format groups Mid-Semester Test Final Exam
N Mean SD Mean SD
T&S 30 38.70 17.754 50.73 22.690
T&A 30 58.52 17.223 74.83 19.104
T&M 29 53.87 20.170 70.72 24.060
Note.1) T&S = Text and Static Image, T&A = Text and Animation,
T&M = Text and Multimedia, and SD = Standard Deviation.
2) Both Mid-Semester and Final Exam total scores were of 100 marks.E-book and Undergraduates’ Learning of Statistics: A Malaysian Perspective 275
were no difference in Mid-Semester Test and Final Exam scores for participants using
T&A and T&M but both T&A and T&M scores were higher than T&S in Mid-Semester
Test and Final Exam.
Three qualitative questions from the questionnaire were also posed to the participants
after the treatments. In terms of the participants’ experiences with problems faced while
using the e-book, their problems could be classified as “physical constraint”, “time
constraint”, and “onscreen design problem”.
Forty-six out of 53 responses from all three groups indicated “physical constraints” as
a problem. The participants felt tired, fatigue and having eye-strain, especially those
using T&S e-book format. Twenty-four out of 30 participants from T&S e-book format
reported these complaints while twelve out of 30 participants from T&A e-book format
and 10 out of 29 participants from T&M e-book format had similar views. The comments
regarding onscreen problems while using e-book included:
Found it hard to read and eyes are tired and hurt.
Had difficulty in reading from a computer screen.
The e-book looks like the scanned copy of the normal
textbook and it makes my head dizzy reading from the
screen all the time.
Thirty-four out of 53 responses in all three e-book formats commented on time
constraint issue with 16 responses from T&S e-book group, seven responses from T&A
e-book group and 11 responses from T&M e-book group. The usage of e-book formats
was considered as time-wasting and some of the participants thought it would affect the
time they needed to learn statistics, as illustrated by the comments below.
Searching for information in the e-book is a waste of
time.
Wasting time clicking buttons and sit in front of the
computer.
Ten out of the 53 responses commented that the design of the e-books was rather
limited and the navigation of the e-book was difficult to follow. Some of the comments
are shown below.
Lazy to access the e-book and to go through the pages.
Don’t like to click on the page by page to read the e-
book.
The font size is too small to read and it is difficult to
read from the screen.
It could be inferred from the responses that the participants had some problems while
using the e-books. Participants felt uneasy reading from the e-books on the computer
screen while others viewed it as a waste of time and preferred printed textbooks.
Onscreen design problem such as font size and navigation issues could be contributing
factors.276 B. C.-Y. Lim, K.-S. Hong and N. Abdul Aziz
Thirty two out of 89 participants gave their views on the usefulness of e-book for
their learning with 20 participants expressed positive experiences while 12 responded
with negative experiences.
Positive comments from participants include the following.
Interesting to learn statistics with e-book.
Like the animation as it is easy to follow.
Enjoy using the e-book with video.
Negative comments from participants include:
Troublesome to use and e-book did not help in learning.
Difficult to read the e-book.
Prefer an actual book for learning.
On the whole, participants who were using T&M e-book view the e-book usage
positively. They found the e-book helped them in learning the usage of graphic calculator
and statistics. On the other hand, participants of T&S e-book group, generally
commented that the e-book was rather difficult to follow and did not significantly help
them in learning.
When providing additional comments on the use of e-book, 38 of the 53 participants
that responded reported positive experiences while 15 participants had negative
experiences with the e-book. The responses to this open-ended question were similar to
those provided earlier. For instance, Participant Q, who commented that the e-book
helped to make statistics interesting, gave similar response to the second open-ended
question.
The following are examples of positive comments from the participants.
Good to use and not just a boring textbook.
No need to buy a textbook and it is hassle free.
Prefer e-book because can access it anytime using
laptop.
Like the video so did not have to read a lot.
The following are some of the negative comments given by the participants.
Animation is not interesting. Needs to be more
interactive.
Video and the sound were quite boring.
Learning better reading textbook.
In general, participants expressed positive feedback with regard to their learning
experience while using T&M e-book. The participants felt that it was interesting to learn
statistics using e-book, in which they had not encountered before. Nevertheless, they
proposed that the T&M e-book be improved with better video and audio quality.
Although participants in T&A e-book group mostly stated positive comments, they
proposed that the T&A e-book could be improved. One of the suggestions is to include
features that allow users to interact with the animated graphs and images, rather than just
clicking on “Next” button. Lastly, participants who were in the T&S e-book group still
showed preferences in printed textbooks.E-book and Undergraduates’ Learning of Statistics: A Malaysian Perspective 277
In a nutshell, positive comments in all the three open-ended questions are
encouraging and point toward an acceptance and a certain enthusiasm among the
participants, especially in the T&A and T&M e-books usage. The negative comments
suggested that the design of the T&S and T&A e-books can be improved upon. Generally,
the participants welcome the e-books as a tool for learning statistics.
6. Discussions
The results from the quantitative analyses revealed that achievement differed
significantly across e-book formats. The posttest scores clearly pointed to an
improvement in Final Examination, signifying that their knowledge in statistics and Ti-83
calculator usage has been enhanced, through participation in the assigned e-book. These
observations revealed a consistent trend of progression from the beginning to the end of
the instructional term of 12 weeks and participants learned better in statistics by using Ti-
83 calculator as the lessons progressed. Possible explanation for the lower scores in Mid-
Semester Test maybe due to the amount of time spent to use the assigned e-book format
as e-book was introduced for the first time in the statistics course. Although only two
chapters were covered in the Mid-Semester Test, participants may have spent more time
to learn how to use the e-book as the participants had no prior knowledge of using Ti-83
graphic calculator in statistics before. Additionally, placing students in a new situation to
learn statistics, particularly in different media representation in e-books, could have had a
confusing and distracting effect on them before they could get used to the new learning
environment (Clark & Mayer, 2011).
After 12 weeks of using the assigned e-book, the participants had adapted and became
familiar with the e-book, thus putting their efforts on learning statistics and answering the
tutorial questions. Moreover, since there were eight chapters in the Final Examination,
the participants were pre-informed by the instructor on the difficulty level. Extra lessons
were allocated by the instructor to help the participants in dealing with tutorial questions.
For additional practice, the participants were allowed to use the e-books outside the
allocated tutorial sessions so they could spend more time in practicing the tutorial
questions at their own time. This may likely to have positive influence on the higher
scores in the Final Examination.
While the results showed that all participants from three e-book formats scored higher
in Final Examination than Mid-Semester Test, the measured data implies that participants
from T&A and T&M e-book formats attained greater effectiveness in the learning
outcome than did the participants who used the T&S e-book format. Such findings
suggest that using e-book with animation and multimedia would be more effective for
learning rather than using e-book with only text and static image. In other words, using
animation and multimedia produced a greater learning outcome (Mayer, 2001). These
results were consistent with findings by Paas, van Gog, and Sweller (2010) and van Gog
and Rummel (2010), who found that certain learning materials used in different
presentation of information were more effective than others based on performance score
differentials. For instance, Kuhl et al. (2011) and Chen and Sun (2012) found that278 B. C.-Y. Lim, K.-S. Hong and N. Abdul Aziz
learners scores were significantly better when it came to applying what they had learned
after receiving animation multimedia formats rather than a text-only format. Other study
by Lee and Rha (2009) also agreed with the results where students who were exposed to
interactive materials (animation and video) achieved higher scores in examination than
text only materials in a web-based distance education. Furthermore, Wang, Vaughn, and
Liu (2011) and Zhang and Zhou (2003) found that achievement is positively correlated
with multimedia instruction as compared to traditional instruction.
The qualitative responses from the questionnaire further revealed that students from
T&S e-book format faced difficulty with the features of the e-book, particularly when
dealing with just text and graphics on the screen. E-book format with such as this has
shown to have a negative effect on their learning. This was the same conclusion derived
from the significantly lower scores in the achievement for participants in T&S e-book
format group. Hence, it was assumed that the participants showed less preference on T&S
e-book format based on their comments in qualitative questions and their achievement
level. On the other hand, students expressed positive feedback with regards to T&A and
T&M e-book formats and their learning experience. This is further shown in their final
score for the course in which participants in both T&A and T&M e-book groups scored
higher than T&S e-book group. Nevertheless, although participants showed preferences
to the T&A and T&M e-book formats, several comments from the participants seemed to
indicate preferences for print-textbook.
7. Conclusions
The findings of this study showed that there is significant difference in learning
achievement when different e-book formats are used as instructional and learning
materials. Considerations for e-book formats should therefore be part of the design
decisions especially when there’s interest in developing or customizing e-book for
specific learners and subject matters. Future research could determine if results differed
with other subjects such as, reading-based subjects, and how different e-book formats
affect comprehension among students. Although e-books have been available for more
than 40 years, research on e-book in formal instruction is still in its infancy. It is hoped
that findings of this study could spur further research into some of the issues raised to
enrich the literature of e-books (Li et al., 2013; Smith & Kukulska-Hulme, 2012) and to
fill in the gap about the use of e-book in the Asian and Malaysian context of higher
learning. As more and more higher education publishers transform learning content into
interactive materials that leverage on recent technological innovations, the future holds
exciting possibilities for e-books usage and adoption for learning.
References
Appleton, L. (2005). Using electronic textbooks: Promoting, placing and embedding. The
Electronic Library, 23(1), 54–63.
Babbie, E. (2013). The practice of social research (13thed.). Wadsworth: Cengage Learning.E-book and Undergraduates’ Learning of Statistics: A Malaysian Perspective 279
Baumann, M. (2010). E-books: A new school of thought. Information Today, 27(5). Retrieved
September 28, 2013, from http://www.infotoday.com
Castellan, C. M. (2010). Quantitative and qualitative research: A view for clarity. International
Journal of Education, 2(2), 1–14.
Chen, C. M., & Sun, Y. C. (2012). Assessing the effects of different multimedia materials on
emotions and learning performance for visual and verbal style learners. Computers &
Education, 59(4), 1273–1285.
Clark, R. C., & Mayer, R. E. (2011). E-learning and the science of instruction: Proven guidelines
for consumers and designers of multimedia learning (3rded.). San Francisco, CA: John Wiley
and Sons.
Clyde, W., & Delohery, A. (2005). Using technology in teaching. New Have, CT: Yale University
Press.
Coakes, S. J., & Steed, L. G. (2003). SPSS: Analysis without anguish. Milton, Australia: John
Wiley & Sons Ltd.
Empson, R. (2013). McGraw-Hill and Kno offer a peek into the future of textbooks: They’re
dynamic, vocal, adaptive and bring stats to studying. Retrieved September 28, 2013, from
http://techcrunch.com/2013/01/08/mcgraw-hill-kno-offer-a-peek-into-the-future-of-
textbooks-theyre-dynamic-vocal-adaptive-bring-stats-to-studying/
Foasberg, N. (2011). Adoption of e-book readers among college students: A survey. Information
Technology and Libraries, 30(3), 108–128. Retrieved September 28, 2013, from
http://ejournals.bc.edu/ojs/index.php/ital/article/view/1769/1674
Gay, L. R., & Airasian, P. (2003). Educational research: Competencies for analysis and
application (7thed.). Upper Saddle River, NJ: Pearson Education.
Genuth, I. (2008, March 31). Cybookgen3 e-book review. The future of things. Retrieved September
28, 2013 from http://thefutureofthings.com/articles/1013/cybook-gen3-e-bookreview.html
Ghaebi, A., & Fahimifar, S. (2011). E-book acquisition features: Attitude of Iranian information
professionals. The Electronic Library, 29(6), 777–791.
Guan, Y.-H. (2009). A study on the learning efficiency of multimedia-presented, computer-based
science information. Educational Technology & Society, 12(1), 62–72.
Ismail, R., & Zainab, A. N. (2005). The pattern of e-book use amongst undergraduates in Malaysia:
A case of to know is to use. Malaysian Journal of Library & Information Science, 10(2), 1–
23. Retrieved September 28, 2013 from http://arxiv.org/ftp/arxiv/papers/1301/1301.5400.pdf
Kuhl, T., Scheiter, K., Gerjets, P., & Gemballa, S. (2011). Can differences in learning strategies
explain the benefits of learning from static and dynamic visualizations? Computers &
Education, 56(1), 176–187.
Lai, F. Q., & Newby, T. J. (2012). Impact of static graphics, animated graphics and mental imagery
on a complex learning task. Australasian Journal of Educational Technology, 28(1), 91–104.
Retrieved September 28, 2013, from http://www.ascilite.org.au/ajet/ajet28/lai.html
Lebert, M. (2009). A short history of e-books. Retrieved September 28, 2013, from
http://www.gutenberg.org /files/29801/29801-0.txt
Lee, H.-J., & Rha, I. (2009). Influence of structure and interaction on student achievement and
satisfaction in web-based distance learning. Educational Technology & Society, 12(4), 372–
382.
Letchumanan, M., & Tarmizi, R. A. (2011). E-book utilization among mathematics students of
Universiti Putra Malaysia (UPM). Library Hi Tech, 29(1), 109–121.280 B. C.-Y. Lim, K.-S. Hong and N. Abdul Aziz
Li, L. Y., Chen, G. D., & Sheng, J. Y. (2013). Construction of cognitive maps to improve e-book
reading and navigation. Computers & Education, 60(1), 32–39.
Lonsdale, R., & Armstrong, C. (2010). Promoting your e-books: Lessons from the UK JISC
national e-book observatory. Electronic Library and Information Systems, 44(3), 185–206.
Mason, L., Tornatora, M. C., & Pluchino, P. (2013). Do fourth graders integrate text and picture in
processing and learning from an illustrated science text? Evidence from eye-movement
patterns. Computers & Education, 60(1), 95–109.
Mayer, R. E. (2001). Multimedia learning. Cambridge, NY: Cambridge University Press.
Mayer, R. E. (2009). Multimedia learning (2nd ed.). Cambridge, NY: Cambridge University Press.
Mayer, R. E., & Moreno, R. (2003). Nine ways to reduce cognitive load in multimedia learning.
Educational Psychologist, 38(1), 43–52.
Maykut, P., & Morehouse, R. (1994). Beginning qualitative research: A philosophic and practical
guide. London: Falmer Press.
Miller, L. (2010). Is Google leading an e-book revolution? The search giant takes aim at Amazon
in the battle for the booming market in digital books. Retrieved September 28, 2013, from
http://www.salon.com/2010/12/08/google_ebookstore/
Neumann, D. L., Neumann, M. M., & Hood, M. (2011). Evaluating computer-based simulations,
multimedia and animations that help integrate blended learning with lectures in first year
statistics. Australasian Journal of Educational Technology, 27(2), 274–289.
Paas, F., van Gog, T., & Sweller, J. (2010). Cognitive load theory: New conceptualizations,
specifications, and integrated research perspectives. Educational Psychology Review, 22,
115–121.
Richardson, J., Smith, R., Lenarcic, J., McCrohan, R., & O’Hare, R. (2010). The emergence of
social networking through the communal annotations of an e-book system. In Curriculum,
Technology and Transformation for an Unknown Future, Proceedings of Ascilite2010
Conference, Sydney, Australia (pp. 803–807). Sydney: Ascilite. Retrieved September 28,
2013, from http://www.ascilite.org.au/conferences/sydney10/procs/Richardson-concise.pdf
Rothman, D. (2006). E-books: Why they matter for distance education—and how they could get
much better. Innovate: Journal of Online Education, 2(6). Retrieved September 28, 2013,
from http://www.editlib.org/p/104328
Smith, M., & Kukulska-Hulme, A. (2012). Building mobile learning capacity in higher education:
E-books and iPads. In M. Specht, J. Multisilta & M. Sharples (Eds.), Proceedings of the 11th
World Conference on Mobile and Contextual Learning (pp. 298–301). Helsinki: CELSTEC
& CICERO Learning.
Tabachnick, B. G., & Fidell, L. S. (2007). Using multivariate statistics (5thed.). Boston: Allyn and
Bacon.
Trew, J. (2013, January 9). Kno launches “Kno Me” interactive textbook metrics, lets you study
your studying. Retrieved September 28, 2013, from
http://www.engadget.com/2013/01/09/kno-launches-kno-me-interactive-textbook-metrics-
lets-you-stu/
Uluyol, C., & Agca, R. K. (2012). Integrating mobile multimedia into textbooks: 2D barcodes.
Computers & Education, 59(4), 1192–1198.
van Gog, T., & Rummel, N. (2010). Example-based learning: Integrating cognitive and social-
cognitive research perspectives. Educational Psychology Review, 22, 155–174.
Wang, P. Y., Vaughn, B. K., & Liu, M. (2011). The impact of animation interactivity on novices’
learning of introductory statistics. Computers & Education, 56(1), 300–311.E-book and Undergraduates’ Learning of Statistics: A Malaysian Perspective 281
Warren, J. W. (2009). Innovation and the future of e-books. The International Journal of the Book.
6(1), 83–93.
Wong, K., Liong, C., Lin, Z. X., Lower, M., & Lam, P. (2011). E-books as teaching strategy-
preliminary investigation. In Changing Demands, Changing Directions, Proceedings of
Ascilite2011 Conference, Hobart, Tasmania (pp. 1343–1352). Retrieved September 28, 2013,
from http://www.ascilite.org.au/conferences/ hobart11/downloads/papers/Wong-full.pdf
Zhang, D., & Zhou, L. (2003). Enhancing e-learning with interactive multimedia. Information
Resource Management Journal, 16(4), 1–14.
Zheng, R., McAlack, M., Wilmes, B., Kohler-Evans, P., & Williamson, J. (2009). Effects of
multimedia on cognitive load, self-efficacy, and multiple rule-based problem solving. British
Journal of Educational Technology, 40(5), 790–803.You can also read