The Role of Clinical Examination in Midface Volume Correction Using Hyaluronic Acid Fillers: Should Patients Be Stratified by Skin Thickness?
←
→
Page content transcription
If your browser does not render page correctly, please read the page content below
Cosmetic Medicine

                                                                                                            Aesthetic Surgery Journal Open Forum
                                                                                                            2020, 1–12
The Role of Clinical Examination in Midface                                                                 © 2020 The Aesthetic Society.
                                                                                                            This is an Open Access article distrib-
Volume Correction Using Hyaluronic Acid                                                                     uted under the terms of the Creative
                                                                                                            Commons Attribution Non-Commercial
Fillers: Should Patients Be Stratified by Skin                                                              License (http://creativecommons.org/
                                                                                                            licenses/by-nc/4.0/), which permits

                                                                                                                                                       Downloaded from https://academic.oup.com/asjopenforum/article/2/1/ojaa005/5728577 by guest on 26 September 2020
Thickness?                                                                                                  non-commercial re-use, distribution, and
                                                                                                            reproduction in any medium, provided
                                                                                                            the original work is properly cited. For
                                                                                                            commercial re-use, please contact jour-
                                                                                                            nals.permissions@oup.com
                                                                                                            DOI: 10.1093/asjof/ojaa005
Andreas Nikolis, MD, MSc, FRCSC; Kaitlyn M. Enright, MSc;                                                   www.asjopenforum.com
Desislava Lazarova, MD; and John Sampalis, PhD

Abstract
Background: Aesthetic physicians have several hundred injectable products to select from. Due to differences in their
manufacturing technology, these products display varying biophysical qualities, such as their cohesivity and lift capacity.
Currently, there is no guidance to objectively selecting the best product for a particular patient. Therefore, an algorithmic
approach is required to take specific skin characteristics into consideration.
Objectives: To evaluate (1) whether subjects seeking injectable treatments for midfacial volume loss and/or contour defi-
ciency can be stratified based on specific skin characteristics (eg, thickness, fat quantity, bony structure) and (2) whether
particular hyaluronic acid fillers perform best when used in such particular strata.
Methods: This was a prospective, Phase IV, open-label, single-center clinical trial. Thirty female patients with midface/
cheek volume loss and/or contour deficiency were recruited (mean age, 53.5 years; SD, 12.57; range, 35–75 years).
Subjects were treated with either Restylane Lyft (HAL) or Restylane Volyme (HAV) and followed for 4 months post-injection.
Treatment allocation was based on the treating physician’s clinical evaluation and compared with ultrasound evaluation.
Ultrasound images were used to confirm stratification. Safety and efficacy assessments were performed at each study
visit: baseline, week 2, week 4, week 8, and week 16. Subgroup analyses evaluated whether particular strata performed
best when treated with specific products.
Results: The 2 investigative products varied in their efficacy, depending on the characteristics of the subject.
Conclusions: The use of a treatment algorithm may improve outcomes for patients seeking injectable treatments for
midfacial volume loss and contour deficiencies.

Level of Evidence: 2

Editorial Decision date: January 27, 2020; online publish-ahead-of-print February 6, 2020.

                                                                       of Surgical Research, McGill University, Montreal, Quebec,
Dr. Nikolis is an Associate Professor of Plastic Surgery, Université   Canada.
de Montreal and McGill University, Montreal, Quebec, Canada. Ms.
Enright is the Head of the Research Unit, Erevna Innovations Inc,      Corresponding Author:
Clinical Research Unit, Westmount, Quebec, Canada. Dr. Lazarova        Dr. Andreas Nikolis, 376 Victoria Ave. # 400, Westmount, QC,
is the Global Head of Medical Education, Galderma Aesthetics,          Canada H3Z 1C3.
Uppsala, Sweden. Dr. Sampalis is an Associate Professor, Division      E-mail: research@vicpark.com; Instagram: @drandreasnikolis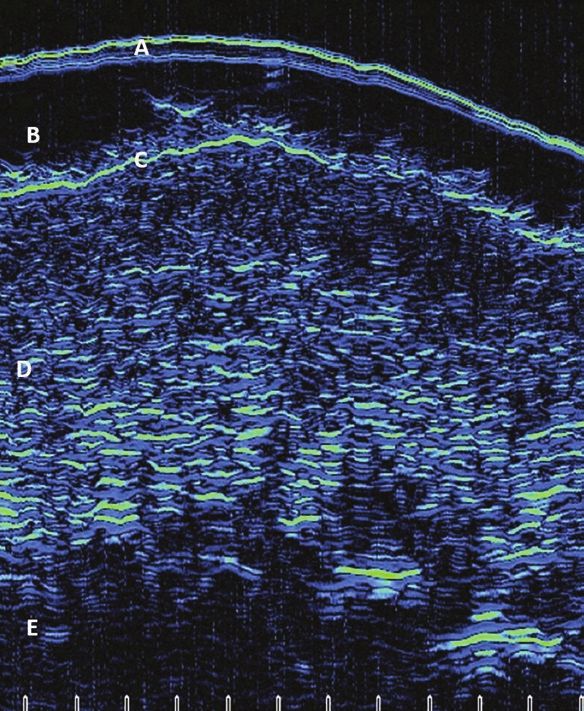
2                                                                                       Aesthetic Surgery Journal Open Forum

Nonsurgical aesthetic procedures for rejuvenation of the           aesthetic outcome, complication rates). The investigators
face include injectables such as botulinum toxin and soft          proposed that in order to optimize aesthetic outcomes,
tissue fillers. These treatments are the most common aes-          treatment assignment (ie, HAL or HAv) should reflect the
thetic procedures performed worldwide.1 Of the over 150            relationship between the subjects’ tissue and characteris-
injectable fillers available on the market today,2 hyaluronic      tics of the selected product. For example, using a higher G′
acid (HA)-based injectables are the most commonly used,            such as HAL on patients with thin skin may result in palpable
with over 1.26 million treatments performed worldwide each         product, creating visible contour irregularities. Therefore,
year.3 Moreover, it is likely that these numbers are under-        subjects with thin skin would be better treated with a product
estimated, as in 2017 over 722,394 HA injections were              with more tissue integration, such as HAV. However, in pa-
performed in the United States alone. Restylane [(HAR),            tients with thick skin, HAV may not provide enough lifting to

                                                                                                                                    Downloaded from https://academic.oup.com/asjopenforum/article/2/1/ojaa005/5728577 by guest on 26 September 2020
Galderma Laboratories, L.P., USA] was the first HA to gain         sufficiently correct their volume loss, thus, they may have
FDA approval in 2003.2 The HAR line of dermal fillers offers       better aesthetic outcomes when treated with HAL.
a wide range of products [2 of which are Restylane Lyft                In order to validate this proposed treatment algorithm
(HAL) and Volyme (HAv), both Galderma Laboratories, L.P.,          (Figure 1), subjects in the present study were assigned
USA], available for administration using varying injection         to one of the 2 strata based on clinical examination and
techniques, to treat multiple indications. Currently, product      treated accordingly. Group A consisted of subjects with
choice and amount of volume used for injectable proced-            poor structural support and volume (eg, atrophy of soft
ures varies between physicians, as there is no standard            tissues, loss of projection), but with an adequate skin en-
for treatment. This inherent weakness is also a strength           velope (ie, thick skin); and Group B consisted of subjects
in aesthetic medicine, as it allows physicians to combine          with poor structural support and volume and with a poor
science and art to personalize patient outcomes. In most           skin envelope (ie, thin skin). Subjects assigned to Group
cases, individual assessment based on the injector’s pref-         A were treated with HAL and subjects assigned to Group B
erence and experience determines final product selection           were treated with HAV. Subjects were then followed up for
and technique. As accurate facial analysis and product             4 months post-injection.
choice are key to ensuring optimal aesthetic outcomes, a
standard of assessment is required to establish best prac-
tices between injectors and to better regulate the use of          Study Question
dermal fillers in aesthetic medicine.                              For subjects seeking injectable treatments for facial
                                                                   volume loss and/or contour deficiency of the midface, is
HAR Product Descriptions                                           it clinically beneficial to stratify them based on their skin
                                                                   characteristics, in order to select the ideal product (ie, HAL
HAL and HAV are HA gels containing lidocaine. The HA
                                                                   or HAV)?
concentration of both products is consistent (ie, 20 mg/
mL), but the products differ in their particle size. HAL has
the largest gel particle size in the family (ie, 10,000 par-       Primary Endpoint
ticles/mL) to provide more lifting, filling, and volumization; 4
and HAV has medium-sized particles to provide volume               The primary endpoint of this study was the change from
with diffuse tissue integration. The 2 products also differ        baseline between the 2 HA products at Week 16 post-
in their manufacturing technology, which impacts their bio-        injection, using the physician-assessed Global Aesthetic
physical characteristics. HAL is manufactured using non-           Improvement Scale (GAIS) as a measure for treatment
animal stabilised HA (NASHA) technology,5 which creates            efficacy.
a firm and cohesive gel with a high G-Prime (G’, ~600 pa)
and very high lift capacity, whereas HAV is manufactured
                                                                   Secondary Endpoints
using Optimal Balance technology (OBT/XpresHAn tech-
nology), which creates a softer, more viscous gel texture          Secondary endpoints of this study included the com-
with a lower G′ (~200 pa) and moderate to high lifting cap-        parison of 2 HA products in the treatment of midface/
acity.6 Both HAL and HAV are available in the United States,       cheek deformities at all visits. This endpoint required the
and Canada.                                                        evaluation of multiple safety and efficacy assessments,
    In the present study, researchers investigated how an          including: (1) physician-assessed efficacy using the GAIS
understanding of the patient’s skin characteristics (eg,           scale; (2) Medicis Midface Volume Scale (MMVS) scores
thickness, volume, projection, elasticity) alongside the bio-      based on blinded review; (3) the patient satisfaction ques-
physical characteristics of different fillers (ie, HAL and HAV),   tionnaire (PSQ); (4) ultrasound evaluations; and (5) adverse
could improve treatment outcomes (eg, injection volumes,           events (AEs).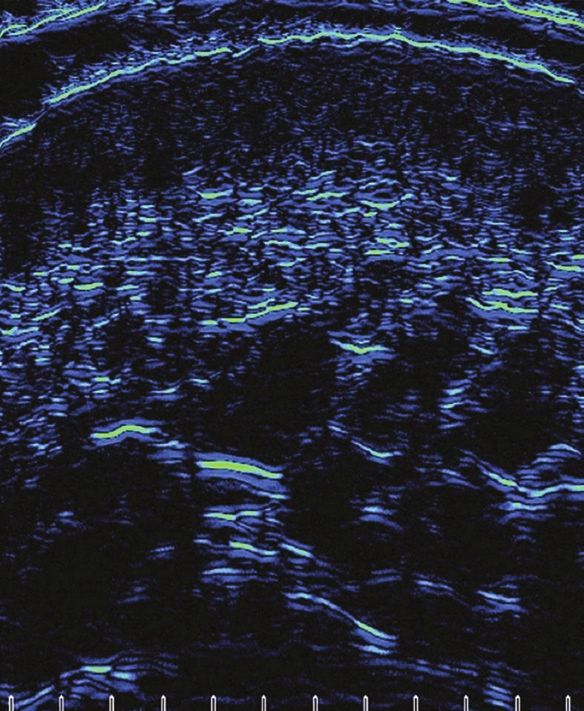
Nikolis et al                                                                                                                  3

                     A

                                                                                                                                     Downloaded from https://academic.oup.com/asjopenforum/article/2/1/ojaa005/5728577 by guest on 26 September 2020
                     B

Figure 1. (A, B) The “Mid- and Lower-Face Algorithm (MLFA)” for facial rejuvenation.

METHODS                                                           Unit (Westmount, Quebec, Canada) from December 2017
                                                                  until December 2018. A total sample size of 30 patients
Study Design                                                      over the age of 30 with midface/cheek volume loss and/or
                                                                  contour deficiency were recruited for this study, providing
This study was conducted in accordance with ethical
                                                                  60 unique hemiface observations.
principles having originated from the contents of the
                                                                     Subjects were treated with either HAL or HAV and fol-
Declaration of Helsinki,7 that are consistent with “Good
                                                                  lowed up for 4 months post-injection. Throughout this time,
Clinical Practice” ICH Tripartite Guidelines and the applic-
                                                                  various safety and efficacy assessments were performed
able laws and regulations of Canada.8 The current investi-
                                                                  during each of the following 5 study visits: Visit 1 (Baseline);
gators, protocol, consent form and all associated research
                                                                  Visit 2 (Week 2 ± 5 days); Visit 3 (Week 4 ± 5 days); Visit 4
documentation and procedures were fully approved by a
                                                                  (Week 8 ± 5 days); and Visit 5 (Week 16 ± 5 days).
centralized research ethics board prior to the commence-
ment of any study-related activities. This study was fully ap-
proved by the external research ethics board “Institutional
                                                                  Eligibility Criteria
Review Board (IRB) Services.”
    This was a prospective, Phase IV, single-center clinical      The main inclusion criteria included female sex, given
trial that took place at the Victoria Park Clinical Research      the known sex-based differences in the skin’s matrix9;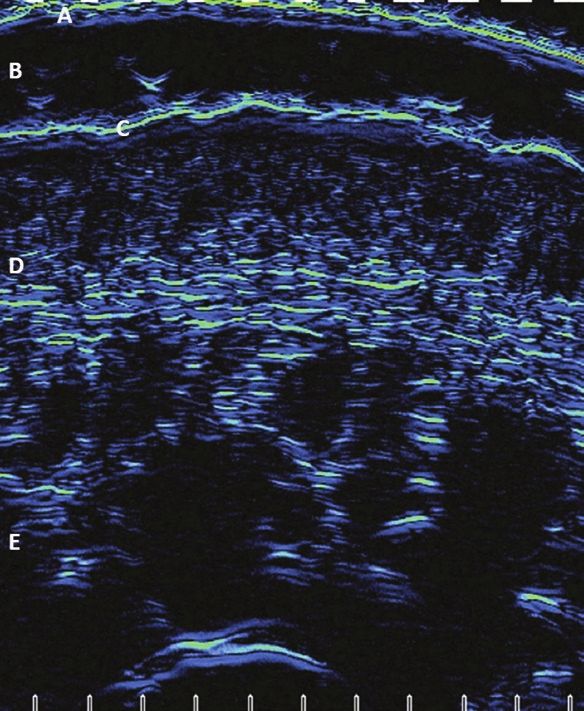
4                                                                                       Aesthetic Surgery Journal Open Forum

between the ages of 30 and 75 years old, given the known                After group assignment, a blinded ultrasound tech-
age-related differences in dermal features9,10; established         nician then performed ultrasound examinations at the
midface/cheek hollowing, based on the investigator’s                indicated sites. All bilateral ultrasound evaluations of
opinion; and an MMVS score of 2 or 3 at baseline. The               the injection areas were taken using a high-frequency
main exclusion criteria included current pregnancy or lac-          ultrasound (EPISCAN-I-200, Longport Inc.). Following ul-
tation; hypersensitivity to HAR products, HA fillers or amide       trasound evaluations, the injecting physician returned
local anesthetics; and skin thickness in the treatment areas        and performed the treatments, as he had previously as-
between 1.29 and 1.49 mm (ie, “normal” thickness), as de-           signed. The injecting physician remained blinded to the
termined by ultrasound at baseline, to ensure no overlap            results of the ultrasound until all study-related proced-
between the 2 strata (ie, thin and thick skin). For a full list     ures were complete and data analyses began. Three-

                                                                                                                                   Downloaded from https://academic.oup.com/asjopenforum/article/2/1/ojaa005/5728577 by guest on 26 September 2020
of the inclusion and exclusion criteria, visit clinicaltrials.gov   dimensional images displaying the marked treatment
and use the search identifier: NCT03381040.                         sites were consulted to ensure consistent placement
                                                                    of the ultrasound probe during assessments, at subse-
                                                                    quent visits.
Procedures                                                              Subjects were seen at Weeks 2 (Visit 2), 4 (Visit 3), 8
During Visit 1 (Baseline), subjects first read and signed an        (Visit 4), and 16 (Visit 5) for follow-up visits. At Week 2,
informed consent form before any study-related activities           a second optional treatment was available to subjects
were performed. Then, a full medical history was taken,             who, in the investigator’s opinion, had not yet reached
including a list of their current medications and concomi-          their optimal aesthetic outcome. All subjects treated at
tant diseases. Women of childbearing potential underwent            Week 2 received the same product as at Baseline. At
a urine pregnancy test, to rule out concurrent pregnancy.           all follow-up visits, the following procedures were per-
Standardized 3D photographs (Vectra M3, Canfield                    formed: 3D photography, GAIS, MMVS, PSQ, clinical ex-
Scientific) were then taken and a blinded evaluator rated           amination, and ultrasonography. Treatments were not
their midface volume loss based on the MMVS. A descrip-             performed at Visits 3, 4, or 5. The GAIS scale was always
tion of all physician- and patient-assessed questionnaires          assessed by the injecting physician, the MMVS was al-
is presented in Supplementary Appendix A, available on-             ways scored by the same blinded evaluator and all ul-
line at www.asjopenforum.com. Clinical examination in-              trasound images were taken and analyzed by the same
volved palpation and the evaluation of variables such as (a)        operator.
the skin envelope thickness (ie, thin, normal, thick); and (2)
the quantity and quality of the subcutaneous tissue. Based          Injection Technique
on clinical examination (eg, visual assessment, palpation,
Slide- and Pinch Tests), the injecting physician allocated          All injections were performed by a single injector and
subjects to treatment group, marked the injection sites and         board-certified plastic surgeon (A.N.). Treatment areas in-
left the room.                                                      cluded the overlapping regions of zygomatic, submalar,
                                                                    and anteromedial cheek (Figure 2). Volumes of product
Group Assignment                                                    used varied between subjects and often within subjects
Our study design utilized nonrandom group assign-                   (bilaterally), given the natural asymmetry of the face.
ment, aimed specifically at maximizing the differences              Volumes used were limited to achieving anatomic correc-
in group mean skin thickness, while minimizing other                tion, up to a maximum of 2 cc per treatment session per
subject characteristics. The use of both products in each           side. This maximum volume was in accordance with the
subgroup was not included in the present study, given               recommended dosage indicated within the product mono-
the findings of previous histological research, which re-           graphs.5,6 Subjects were treated with the aim of achieving
vealed the products’ different levels of tissue integra-            at least a 1-point improvement on the MMVS.12 Injections
tion.11 Upon clinical examination, the use of NASHA in              were performed with sterile 27G × ½ needles, using a slow
thin-skinned patients would have resulted in palpable               injection technique and careful aspiration. Product was
product. This is primarily due to its targeted tissue in-           placed in the deep subcutis tissues of the 3 overlapping
tegration. Conversely, OBT allows for its use even in               regions, for both groups.
thin-skinned patients because it has diffuse product in-
tegration. Therefore, subgroups were not treated with
                                                                    Statistical Methods
both products as histological studies support an increase
of adverse events and unfavorable results (eg, palpable             The program SPSS Statistics (version 20.0) was used for
product in thin-skinned individuals and lack of efficacy in         all data analyses. All evaluations were considered in the
thick-skinned subjects).11                                          assessment of product safety and efficacy. Continuous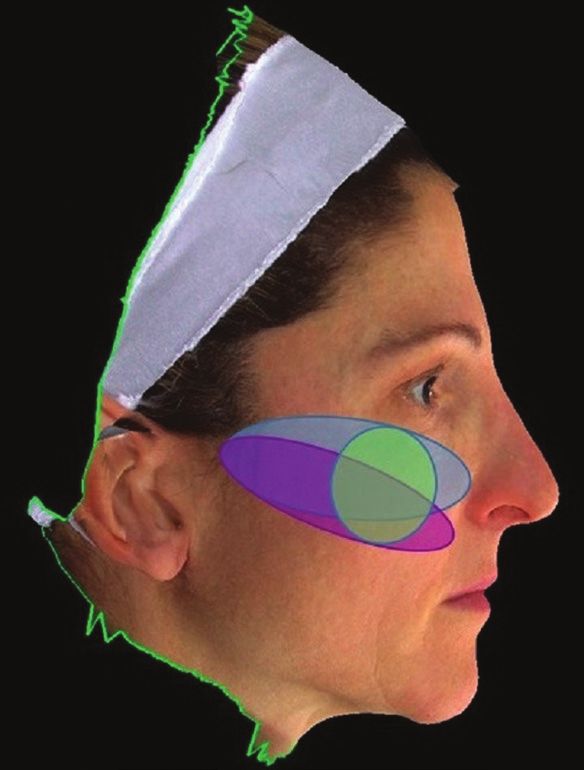
Nikolis et al                                                                                                                 5

                                                                RESULTS
                                                                Subject Characteristics
                                                                Thirty female patients were recruited. Based on clinical
                                                                examination (eg, visual assessment, palpation), 17 subjects
                                                                were characterized as having thick skin and subsequently
                                                                treated with HAL (56.6%); and 13 subjects were charac-
                                                                terized as having thin skin and treated with HAV (43.3%).
                                                                The mean age of the sample was 53.5 years (SD, 12.57;

                                                                                                                                    Downloaded from https://academic.oup.com/asjopenforum/article/2/1/ojaa005/5728577 by guest on 26 September 2020
                                                                range, 35–75 years). The mean age of the HAL group was
                                                                49 years (SD, 10.12) and the mean age of the HAV group
                                                                was 58 years (SD, 13.98). An independent t-test revealed
                                                                that the age differences between the groups were not stat-
                                                                istically significant [t(25) = −1.457; p = 0.157)]. Figures 3 and
                                                                4 depict examples of treatment effect in thin- and thick-
                                                                skinned subjects.

                                                                Ultrasound Determination of Dermal
                                                                Thickness
                                                                Following treatment, ultrasound was used to corroborate
                                                                the clinical examination (Figures 5 and 6). Based on the
                                                                analyses of ultrasound images, dermal thickness signifi-
                                                                cantly correlated with the treatment group (right side:
                                                                Pearson = −0.772; p = 0.000; left side: Pearson = −0.831;
                                                                p = 0.000). Subjects treated with HAL had statistically sig-
Figure 2. Treatment areas targeted in the present trial in a    nificant thicker skin in their bilateral cheeks (right side:
48-year-old female subject. These included the overlapping      M = 1.69, SD = 0.24; left side: M = 1.74, SD = 0.28) than those
regions of zygomatic (blue), submalar (purple), and             treated with HAV (right side: M = 1.18, SD = 0.21; left side:
anteromedial cheek (green).                                     M = 1.23, SD = 0.25; p > 0.00).

data were presented as means ± standard deviation and           Statistical Power
categorical data were presented in percentage values.
Pearson chi‐squared tests were used for the analysis of         Using an effect size based on the means and standard
cross‐tables and ordinal logistic regression analyses were      deviations of the groups’ skin thicknesses at baseline, a
used for the determination of independent predictors of         G*Power calculation revealed that the present study has a
PSQ, GAIS scores. P < 0.05 was accepted to be statistically     power of 0.63.16 This value equates to a study with mod-
significant.                                                    erate statistical power.
    Analyses of the ultrasound images consisted of classi-
fying subjects as having either thin or thick skin, as per      Follow-up and Attrition Rates
standard definitions. Subjects with skin that was 1.5 mm had “thick” skin.13,14 Subjects    112.42 days (range, 108–125 days). By visit 5 (week 16), the
with skin a “normal” skin thickness between 1.20 and            dropout rate was 13.33% (n = 4/30). Two of the patients
1.49 mm were excluded to ensure distinct groups. Subjects       who dropped out were treated with HAL (n = 2/17; 11.76%)
were required to fall within the same group assignment          and 2 were treated with HAV (n = 2/13; 15.38%).
bilaterally. Each ultrasound image was divided into thirds
by vertical lines. Dermal thickness was then measured at
                                                                Adverse Events
these 3 locations, from the end of the epidermis to the start
of the subcutaneous region. As other investigators have         There were no reported serious AEs throughout the dur-
reported, the mean of these 3 values was used in the clas-      ation of the trial. All AEs were mild to moderate in se-
sification of skin thickness.15                                 verity and transient in nature. They included AEs typically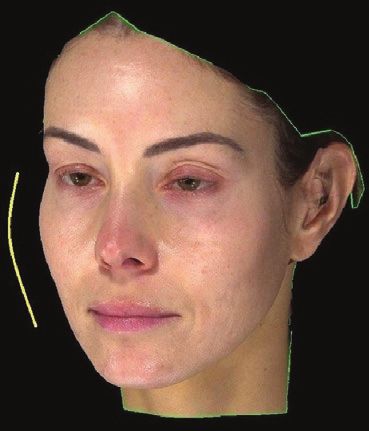
6                                                                                         Aesthetic Surgery Journal Open Forum

     A                                        B                                          C

                                                                                                                                      Downloaded from https://academic.oup.com/asjopenforum/article/2/1/ojaa005/5728577 by guest on 26 September 2020
Figure 3. A 35-year-old female subject appearing to have thin skin based on clinical exam (eg, palpation) and subsequently
treated with HAV. (A) Baseline, (B) middle (week 4), and (C) a composite of the baseline and week 4 images.

     A                                        B                                          C

Figure 4. A 48-year-old female subject appearing to have thick skin based on clinical exam (eg, palpation) and subsequently
treated with HAL. This subject is also depicted in Figure 2. (A) Baseline, (B) middle (week 4), and (C) a composite of the baseline
and week 4 images.

associated with injection (eg, swelling, bruising,) and none        16 (χ 2 = 476,662.78; df = 3; p = 0.000). The evaluator rated
was related to the products. Adverse event incidence rates          that the majority of patients treated with HAL had “much
are presented in Table 1. In total, there were 3 cases of           improved” (n = 8/17; 57.1%), whereas the majority of those
bruising (10%) and 4 cases of swelling (13.33%).                    treated with HAV had “improved” (n = 6/13; 54.5%). This
                                                                    may be due to the greater product integration of HAV,
                                                                    which results in a more natural effect (compare Figures 5
Primary Endpoint                                                    and 6).
Difference in Physician-Assessed Efficacy Between 2
HAR Products at Week 16 (Visit 5) in Comparison to                  Secondary Endpoints
Baseline (Visit 1), Using the GAIS Scale
As can be seen in Table 2, at Week 16 post-injection,               Difference in All Measures Between 2 HAR Products at
there were differences in midfacial improvement between             All Visits
subjects treated with HAL and HAV, as per the physician-            Results of the GAIS, PSQ, and MMVS are displayed by
assessed GAIS scale. A Chi-square goodness-of-fit test re-          group in Table 3, for all visits. For analyses, ordinal lo-
vealed that the proportion of responses in each category            gistic regressions were performed to examine the rela-
of the GAIS significantly differed between groups at Week           tion between treatment group, visit number (independent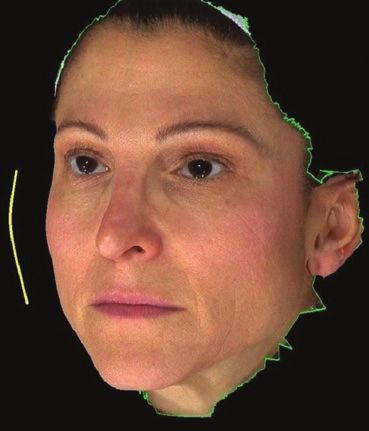
Nikolis et al 7
A B
Downloaded from https://academic.oup.com/asjopenforum/article/2/1/ojaa005/5728577 by guest on 26 September 2020
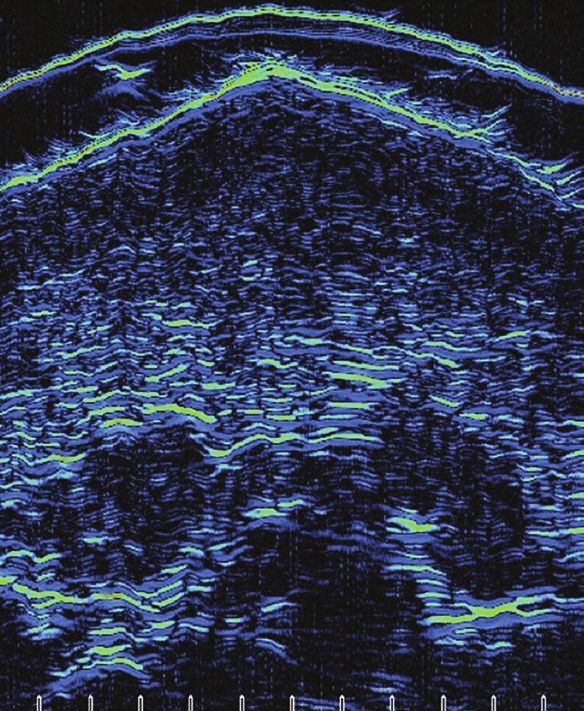
Figure 5. Ultrasound images from the cheek region of a female subject who was classified as having thin skin and treated with
HAv at Baseline and Week 4. (A) Baseline and (B) right (week 4). A, membrane; B, gel; C, epidermis; D, dermis; E, subcutaneous
region.
variables), and scores on the GAIS and PSQ (dependent (2, N = 27) = 3.580, p = 0.167]. The frequency distribution
variables). Chi-squared tests of independence were per- of MMVS scores did not significantly vary between the 2
formed using the likelihood ratio to examine the relation groups, at baseline.
between the treatment group (independent variable) Following the second treatment (ie, Visit 3/Week 4),
and raw scores of the MMVS (dependent variable) at the blinded reviewer noted a one-point improvement
Baseline, as well as treatment group and response rates in 56.25% of subjects (n = 13.5/24). Maximum MMVS re-
at Visit 5. sponse rates (~75%) were noted between Visits 4 (Week
8) and 5 (Week 16). There were no cases throughout the
duration of the study of a negative MMVS response (ie,
Global Aesthetic Improvement Scale appearance of midface volume loss and/or contour defi-
Ordinal logistic regression analyses revealed that GAIS ciency worsening). The maximum MMVS response rate ob-
scores were not significantly predicted by group or visit served was a one-point improvement; there were no cases
number (p > 0.05; Table 3). High rates of aesthetic im- of a 2- or 3-point increase.
provement were noted in both groups, with the injecting At Visit 5/Week 16, subjects treated with either HAL
physician rating >75% of subjects as having at least “im- or HAV had similar improvements in their midfacial
proved” outcomes, throughout the entire duration of the volume and/or contours. The relation between treatment
study. There were no cases of a “worse” global aesthetic group and MMVS response rate was insignificant [χ 2 (2,
appearance. N = 24) = 0.087, p = 0.768]. The frequency distribution of
MMVS response rates did not significantly vary between
the 2 groups.
Medicis Midface Volume Scale
Prior to treatment, groups were similar in terms of the
amount of midfacial volume loss and/or contour de-
Patient Satisfaction Questionnaire
formity found in the samples, as the relation between the Patient satisfaction was assessed using the Patient
treatment group and MMVS scores was insignificant [χ 2 Satisfaction Questionnaire (PSQ) at all follow-up visits.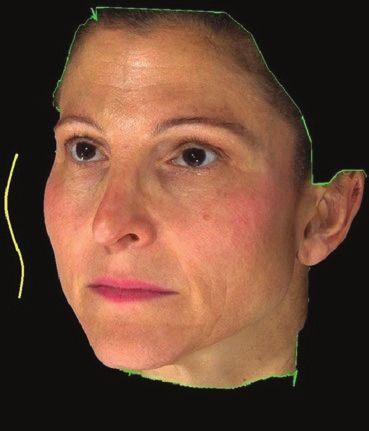
8                                                                                                       Aesthetic Surgery Journal Open Forum

  A                                                                                B

                                                                                                                                                    Downloaded from https://academic.oup.com/asjopenforum/article/2/1/ojaa005/5728577 by guest on 26 September 2020
Figure 6. Ultrasound images from the cheek region of a female subject who was classified as having thick skin and treated
with HAL at Baseline and Week 4. (A) Baseline and (B) right (week 4). A, membrane; B, gel; C, epidermis; D, dermis; E,
subcutaneous region.

Table 1. Adverse Events Present at Each Follow-Up Visit                            > 0.05; Table 3). Subjects treated with HAL reported higher
                                                                                   levels of satisfaction than those treated with HAV.
  Tx group (n)        Visit              Bruising, n (%)        Swelling, n (%)

                                   Mild           Moderate           Mild
                                                                                   Ultrasound Evaluations
  HAL                  2             0              1 (5.8)          2 (11)
                                                                                   Correlations Between Subjective Clinical Examination
  17                   3           1 (5.8)             0               0           and Objective Ultrasound Evaluations
  HAV                  2           1 (7.6)             0            2 (7.6)
                                                                                   Ultrasound classified 5/17 (29.4%) subjects as having thick
                                                                                   skin, despite clinical examination identifying them as
  13                   3             0                 0               0           having thin skin; and it classified 4/13 (30.7%) subjects as
                                                                                   having thin skin, despite clinical examination identifying
AEs were not present at Visits 4 or 5. Visit 2, week 2; Visit 3, week 4; n, fre-
quency; %, relative frequency for group.                                           them as having thick skin. Therefore, objective ultrasound
                                                                                   assessments and subjective clinical examination resulted
                                                                                   in similar findings approximately 70% of the time.
The PSQ is a 5-point, patient-rated scale comprising of
“extremely satisfied,” “satisfied,” “slightly satisfied,” “dis-
                                                                                   Global Aesthetic Improvement Scale, MMVS, and PSQ
satisfied,” and “extremely satisfied.” The PSQ was a paper-
                                                                                   Subgroup Analyses
based questionnaire that was distributed by the study
                                                                                   During post-hoc analyses, data at Visit 5/Week 16 were fur-
coordinator. It was anonymized as subjects were identi-
                                                                                   ther analyzed based on the following 4 subgroups:
fied only by their subject numbers. The treating physician
was not present during the subjects’ evaluations and re-                           1.   HAL+ = Subjects with correctly identified thick skin,
mained blinded to their responses. Ordinal logistic regres-                             treated with HAL (n = 12);
sion analyses revealed that PSQ scores were significantly                          2.   HAL− = Subjects with thin skin, incorrectly identified as
predicted by group (p = 0.007), but not by visit number (p                              having thick skin, treated with HAL (n = 3);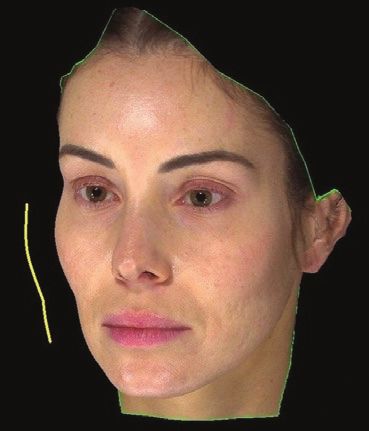
Nikolis et al                                                                                                                                                                                           9

Table 2. Results of the PSQ, GAIS and MMVS Response Rates Per Subgroup at Visit 5/Week 16

  Treatment                         PSQ, n (%)                                           GAIS score, n (%)                                       MMVS response rate           MMVS response rate
  group, n (%)                                                                                                                                    (right side), n (%)           (left side), n (%)

                        Extremely           Satisfied        Very much              Much                 Improved            No change              0               1            0              1
                         satisfied                           improved             improved

  HAL+                  8 (66.66)           4 (33.33)          2 (16.66)          7 (58.33)               3 (25.0)                  0            3 (30.0)       7 (70.0)      2 (20.0)      8 (80.0)
  12 (46.15)

  HAL-                   1 (33.33)          2 (66.66)               0                 1 (33.33)           1 (33.33)              1 (33.33)          0           3 (100.0)     3 (50.0)      3 (50.0)
  3 (11.53)

                                                                                                                                                                                                             Downloaded from https://academic.oup.com/asjopenforum/article/2/1/ojaa005/5728577 by guest on 26 September 2020
  HAV+                  3 (42.85)           4 (57.14)               0             2 (28.57)              5 (71.42)                  0            1 (16.66)      5 (83.33)     1 (16.66)     5 (83.33)
  7 (26.92)

  HAV-                   3 (75.0)            1 (25.0)          3 (75.0)               1 (25.0)                0                     0               0           4 (100.0)     1 (25.0)      3 (75.0)
  4 (15.38)

MMVS response rate was defined as an at least 1-point improvement.
PSQ, Patient Satisfaction Questionnaire; GAIS, Global Aesthetic Improvement Scale; MMVS, Medicis Midface Volume Scale

Table 3. Results of the PSQ, GAIS, and MMVS Response Rates per Groups, at All Visits
  Tx group,    Visit                    PSQ, n (%)                                                GAIS score, n (%)                                 MMVS response rate         MMVS response rate
  n (%)                                                                                                                                              (right side), n (%)         (left side), n (%)

                       Extremely        Satisfied       Slightly          Very much                 Much          Improved                No            0               1          0            1
                        satisfied                       satisfied         improved                improved                              change

  HAL 17         1         —               —               —                  —                      —                   —                   —          —               -—        —            —
  (56.6)
                 2     12 (70.5)         5 (29.5)          0               13 (76.5)              4 (23.5)               0                   0     11 (73.33)     4 (26.66)    11 (73.33)   4 (26.66)

                 3     12 (85.7)         2 (14.3)          0               2 (14.3)                8 (57.1)           4 (28.6)               0      6 (50.0)      6 (50.0)     6 (50.0)      6 (50.0)

                 4      13 (81.2)        3 (18.8)          0               3 (18.7)               6 (37.5)            7 (43.8)               0     5 (35.71)      9 (64.28)    4 (28.57)    10 (71.42)

                 5       9 (60)          6 (40)            0               2 (14.3)                8 (57.1)           4 (28.6)               1      3 (23.1)      10 (76.9)     3 (23.1)    10 (76.9)

  HAV 13         1         —               —               —                  —                      —                   —                   —          —               —         —            —
  (43.3)
                 2      7 (53.8)         4 (30.8)       2 (15.4)           8 (66.7)               3 (25.0)             1 (8.3)               0      9 (75.0)      3 (25.0)     9 (75.0)      3 (25.0)

                 3       6 (50)          5 (41.7)        1 (8.3)            1 (9.1)               8 (72.7)            2 (18.2)               1     5 (41.66)      7 (58.33)    4 (33.33)    8 (66.66)

                 4      5 (45.5)         5 (45.5)        1 (9.0)            1 (9.1)               4 (36.4)            6 (54.5)               0      2 (18.18)     9 (81.81)    3 (27.27)    8 (72.72)

                 5      6 (54.5)         5 (45.5)          0                  0                    3 (27.3)           8 (72.7)               0      2 (18.18)     9 (81.81)    3 (27.27)    8 (72.72)

GAIS scores were not collected at Visit 1 (Baseline) and are therefore not reported. Patient satisfaction questionnaire, GAIS and MMVS categories with zero frequen-
cies are not shown. Medicis Midface Volume Scale response rate was defined as an at least 1-point improvement. Visit 2, week 2; Visit 3, week 4; Visit 4, week 8; Visit
5, week 16; n, frequency; %, relative frequency for a group.
Tx, treatment; PSQ, Patient Satisfaction Questionnaire; GAIS, Global Aesthetic Improvement Scale; MMVS, Medicis Midface Volume Scale.

3.    HAV+ = Subjects with correctly identified thin skin,                                                (SD = 0.62; left side); HAL− = 1.50 cc (SD = 1.08; right side)
      treated with HAV (n = 7);                                                                           and 1.52 cc (SD = 1.17; left side); HAV+ = 1.40 cc (SD = 1.14;
4.    HAV− = Subjects with thick skin, incorrectly identified                                             right side) and 1.32 cc (SD = 1.17; left side); and HAV− = 1.95
      as having thin skin, treated with HAV (n = 4).                                                      cc (SD = 0.36; right side) and 2.22 cc (SD = 0.89; left side).
                                                                                                          Values represent the mean volume administered between
Results of the GAIS, MMVS, and PSQ per subgroup are dis-                                                  Visits 1 and 2. Results of a one-way non-parametric ANOVA
played in Table 2, for Visit 5/Week 16.                                                                   (Kruskal-Wallis test) revealed that volumes did not statis-
                                                                                                          tically vary between subgroups [right side: χ 2(3) = 2.002,
Injection Volumes (Subgroups)                                                                             p = 0.572; left side: χ 2(3) = 0.912, p = 0.823]. From least to
The following mean volumes were used within each sub-                                                     most product used, the mean ranks went in the order of:
group: HAL+ = 1.33 cc (SD = 0.71; right side) and 1.26 cc                                                 1 = HAL+; 2 = HAV−; 3 = HAV+; and 4 = HAL−.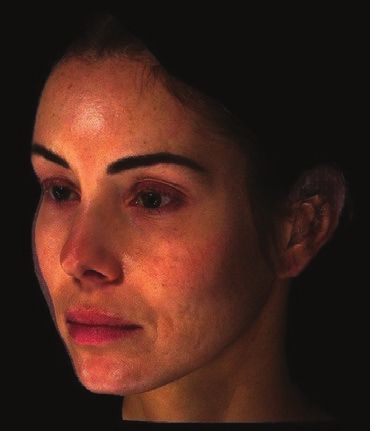
10                                                                                        Aesthetic Surgery Journal Open Forum

Global Aesthetic Improvement Scale (Subgroups)                       study. Patients satisfaction, physician-assessed aesthetic
Results of a one-way non-parametric ANOVA (Kruskal-                  improvement and blinded review all support that both HAL
Wallis test) revealed that the distribution of GAIS scores           and HAV are safe and effective HA injectables for the indi-
varied across subgroups at Visit 5/Week 16 [χ 2(3) = 10.981,         cation of improving midfacial volume loss and/or contour
p = 0.012]. The mean ranks went in the order of: 1 = HAV−;           deficiencies.
2 = HAL+; 3 = HAV+; and 4 = HAL−.
                                                                     Subgroup Analyses
Patient Satisfaction Questionnaire (Subgroups)
Results of a one-way non-parametric ANOVA (Kruskal-                  As the study design involved both thin- and thick-skinned
Wallis test) revealed that the distribution of satisfaction          subjects, which were either correctly or incorrectly matched

                                                                                                                                       Downloaded from https://academic.oup.com/asjopenforum/article/2/1/ojaa005/5728577 by guest on 26 September 2020
scores was not statistically different across subgroups              to treatment, this created a 4-cohort study. Our results dem-
[χ 2(3) = 2.161, p = 0.540]. The mean ranks went in the order        onstrate that in/correctness of treatment allocation results
of: 1 = HAV−; 2 = HAL+; 3 = HAV+; and 4 = HAL−. Overall, high        in differences to the order of the mean ranks between
levels of satisfaction were reported by all subgroups, with          subgroups, in pertinent outcome variables (eg, GAIS, PSQ,
only “extremely satisfied” and “satisfied” being reported            MMVS). For example, thin-skinned subjects who incorrectly
by all subjects at Visit 5/Week 16.                                  received a firm product (minimal diffusion and integration),
                                                                     consistently scored the lowest on satisfaction and improve-
Medicis Midface Volume Scale Grade (Right Side;                      ment parameters; while treating thick-skinned individuals
Subgroups)                                                           with a soft product often required 1.4× more OBT/XpresHAn
Results of a one-way non-parametric ANOVA (Kruskal-                  product than NASHA to maintain similar satisfaction and
Wallis test) revealed that the distribution of the MMVS              improvement results as correctly treated thick-skinned
response rates on the right side was the same across sub-            subjects. In practice, this resulted in the use of 3 syringes
groups, at Visit 5/Week 16 [χ 2(3) = 2.470, p = 0.481]. While        of HAL versus 4 of HAV. These findings are important in
not significantly different, the mean ranks went in the order        terms of developing a cost-effectiveness model for patients.
of: 1 = HAL− and HAV−; 2 = HAV+; and 3 = HAL+, from most             Moreover, our findings support that in order to ensure the
improvement to least.                                                best aesthetic outcomes, injectors should avoid using a hard
                                                                     gel with a high lift capacity, such as HAL, in thin-skinned in-
Medicis Midface Volume Scale Grade (Left Side;                       dividuals; as the HAL− group consistently scored the lowest
Subgroups)                                                           on patient- and physician-assessed scales. Of note, phys-
Results of a one-way non-parametric ANOVA (Kruskal-Wallis            icians were more critical of results than research subjects,
test) revealed that the distribution of MMVS scores on the           but the subgroup trends in terms of patient satisfaction and
left side was the same across subgroups at Visit 5/Week 16           physician-rated efficacy were the same.
[χ2(3) = 0.806, p = 0.848]. While not significantly different, the       As the number of injectable products available to phys-
mean ranks went in the order of: 1 = HAL−; 2 = HAV+; 3 = HAL+;       icians grows, evidence in support of their individual perfor-
and 4 = HAV−, from most improvement to least.                        mance measures is increasingly necessary. There is growing
                                                                     interest in describing how manufacturing technology can af-
DISCUSSION                                                           fect the biophysical characteristics of different products and
                                                                     in turn and how these biophysical characteristics affect bio-
In the present study, investigators utilized treatment algo-         mechanical performance. Previous research has revealed
rithm in an attempt to improve product selection for pa-             how NASHA and OBT technology integrate differently into
tients seeking injectable treatments for midfacial volume            the tissues. Apart from the significant differences in the
loss and contour deficiencies. This personalized approach            technologies, when plotting the G′ to mean product integra-
consisted of a 2-step process: (1) Firstly, subjects were            tion in human skin, researchers found statistically significant
stratified based on their palpable skin characteristics (eg,         correlations. More specifically, they found that products with
skin thickness, subcutaneous fat quantity and positioning,           the lowest G′ have the highest integration score and prod-
bony structure); and then (2) they were assigned to receive          ucts with high G′ have the lowest integration scores.16 Our
a product based on its complimenting biophysical char-               study contributes to and furthers this research by providing
acteristics. Several safety and efficacy assessments were            additional information regarding how variable tissue inte-
performed during the 4 months post-injection, in order to            gration can affect clinical outcomes.
validate this treatment algorithm.                                       Moreover, our findings provide evidence in support of
                                                                     the theory that the unique biophysical characteristics of
                                                                     each filler makes them more appropriate in certain patient
Treatment Group Analyses
                                                                     populations. For example, aging thin skin lacks projection
Overall, both HAR products resulted in acceptable safety             and volume; and correction of these deficiencies requires
and efficacy assessments, throughout the duration of the             larger volumes of soft product. Conversely, aging thick
Nikolis et al 11
skin may maintain volume but loses structure and projec- Limitations
tion. Therefore, only a small amount of stiffer product is
required to replace these deficiencies. The existence of The findings of this study should be seen in light of a few
various skin types underlies the importance of different limitations. For example, a mildly uneven treatment assign-
approaches to facial aesthetics. A significant effect of re- ment (HAL: n = 17; HAV: n = 13) between the groups and
structuring the face can be given by using a product such the small sizes of the subgroups limit the statistical power
as HAL, with a strong lift capacity, or a subtle, natural effect of this trial. However, although the sample sizes were not
can be given by replenishing the skin using a soft product equal, the means and standard deviations associated with
such as HAV. Ultimately, product choice should depend important variables were similar between groups [eg, age,
upon factors such as the degree of correction required MMVS at baseline, attrition and AE rate, injection volumes).
Downloaded from https://academic.oup.com/asjopenforum/article/2/1/ojaa005/5728577 by guest on 26 September 2020
in the anatomical area under evaluation, skin quality, soft This suggests that, except for the predictor variable (ie,
tissue quality, and quantity. skin thickness), groups were more alike than dissimilar.
Therefore, the unequal sample size should have had little
statistical effect. Secondly, various statistical methods are
Comparison of Subjective and Objective available to accommodate unequal sample sizes. For ex-
Measures ample, in the calculation of power, we used Hedges’ g in-
stead of Cohen’s d, which provided a measure of the effect
In most cases (ie, ~70%), ultrasound validated the results size weighted according to the relative size of each sample.
of clinical examination. Therefore, our findings support Thirdly, even simple randomization used in randomized
that clinical examination, consisting of palpation and visu- controlled trials can produce an unbalanced pattern and;
alization, can result in moderate accuracy rates for char- lastly, the validity of trials with unequal randomization ratios
acterizing thin and thick skin types. However, to more are supported by previous research.17-19 In addition, our
accurately measure dermal thickness, objective measures study did not involve a control group, but this was justified
such as ultrasound are required; or perhaps, clinical man- on various grounds. When it comes to comparison trials in
euvers could be standardized to better assess thickness. aesthetic medicine research, it is rare to treat one side of
Regardless of the chosen assessment technique, using the face while maintaining the contralateral side as a con-
these methods enables clinicians to stratify patients in a trol. This is because recruitment becomes extremely diffi-
systematic manner and tailor their treatment regimens by cult, when using this study design. While control groups are
selecting the appropriate product. paramount in research, the use of such a group would not
A possible reason why clinical examination was not have had any validity in the current work. Importantly, using
100% accurate may be due to the difference in dermal one-of-the-two sides as a control would have had too major
thicknesses between the 2 groups. Subjects presenting issues: (1) Patient recruitment would have been extremely
with thick skin had on average only 0.5-mm thicker skin difficult, as subjects would likely not agree to participating
than those in the thin-skinned group. This is likely too small in a trial where they would have gone 4 months looking
of a difference to accurately measure using visual assess- asymmetrical and (2) the likelihood that the research ethics
ments alone. board would reject this study design is high.
There was also a selection bias in that we only investi-
gated the use of the 2 HAR products in women. Therefore,
Strengths
our findings may not be generalizable to men who may
The premise of and information collected in this trial have other pertinent variables that affect choosing the
are easily reproducible, without the need for future in- ideal product. Lastly, the ~70% agreement rate between
vestigators to exactly replicate the current study. This subjective clinical exam and objective ultrasound may be
is because the hypotheses that thick-skinned patients exaggerated for clinicians with less experience than the
are better suited to receive HAL and that thin-skinned injector assessed herein.
patients are better to receive HAV can be predicted
even if future experimental conditions are not identical. CONCLUSIONS
Furthermore, during the course of this study, we evalu-
ated the Pinch and Slide Tests. The results of these In this study, we investigated 2 HA products that varied in
evaluations revealed that there was reproducibility of the their levels of efficacy, depending on the characteristics of
clinical examination and that it does correlate strongly to the subject. As such, each product is best indicated for par-
whether patients are thin or thick skinned. Given the ro- ticular populations. This trial has developed concepts that
bustness of this data, it will be fully presented in a future may be used for the generation of treatment algorithms,
publication. such as: the existence of patient strata based on specific12 Aesthetic Surgery Journal Open Forum
skin characteristics and the possibility of using these strata 7. Goodyear MD, Krleza-Jeric K, Lemmens T. The Declaration
for the purposes of treatment allocation. It is expected that of Helsinki. BMJ. 2007;335(7621):624-625.
these concepts may be applied to other families of fillers. 8. Bhatt A. International Council for Harmonisation E6(R2)
addendum: challenges of implementation. Perspect Clin
Acknowledgments Res. 2017;8(4):162-166.
9. Firooz A, Rajabi-Estarabadi A, Zartab H, Pazhohi N,
Presented at The Canadian Laser and Aesthetic Specialists
Fanian F, Janani L. The influence of gender and age on
Society Annual Educational Symposium, Montreal, Quebec,
the thickness and echo-density of skin. Skin Res Technol.
Canada on November 10, 2018.
2017;23(1):13-20.
10. Darlenski R, Sassning S, Tsankov N, Fluhr JW. Non-
Disclosures
invasive in vivo methods for investigation of the skin bar-
Downloaded from https://academic.oup.com/asjopenforum/article/2/1/ojaa005/5728577 by guest on 26 September 2020
Dr. Nikolis is a consultant, speaker, and research collaborator rier. Eur J Pham Biopharm. 2009;72:295-303.
for Galderma, Allergan, and Merz Pharma. The other authors 11. Lundgren B, Sandkvist U, Berdier N, Gauthier B. Using a
declared no potential conflicts of interest with respect to the new photo scale to compare product integration of dif-
research, authorship, and publication of this article. ferent hyaluronic-based fillers after injection in human ex
vivo skin. J Drugs Derm. 2018;17(9):982.
Funding 12. Bertucci V, Lin X, Axford-Gatley RA, Theisen MJ, Swift A.
This study was funded by an unrestricted educational grant Safety and effectiveness of large gel particle hyaluronic
from Galderma Canada. acid with lidocaine for correction of midface volume loss.
Dermatol Surg. 2013;39(11):1621-1629.
13. Hoffmann K, Stuücker M, Dirschka T, et al. Twenty MHz
REFERENCES B-scan sonography for visualization and skin thick-
1. The American Society for Aesthetic Plastic Surgery. ness measurement of human skin. J Eur Acad Dermatol
Cosmetic Surgery National Data Bank: Statistics 2018. Venereol. 1994;3(3):302-313.
Aesthet Surg J. 2019;39(Suppl_4):1-27. 14. Pellacani G, Seidenari S. Variations in facial skin thickness
2. Bray D, Hopkins C, Roberts DN. A review of dermal fillers and echogenicity with site and age. Acta Derm Venereol.
in facial plastic surgery. Curr Opin Otolaryngol Head Neck 1999;79(5):366-369.
Surg. 2010;18(4):295-302. 15. Van Mulder TJ, de Koeijer M, Theeten H, et al. High fre-
3. The American Society of Aesthetic Plastic Surgery. quency ultrasound to assess skin thickness in healthy
Practice Survey 2008. http://www.surgery.org/sites/de- adults. Vaccine. 2017;35(14):1810-1815.
fault/files/2008stats.pdf. Accessed February 19, 2018. 16. Faul F, Erdfelder E, Buchner A, Lang AG. Statistical power
4. Weiss RA, Moradi A, Bank D, et al. Effectiveness and analyses using G*Power 3.1: tests for correlation and regres-
safety of large gel particle hyaluronic acid with lidocaine sion analyses. Behav Res Methods. 2009;41(4):1149-1160.
for correction of midface volume deficit or contour defi- 17. Avins AL. Can unequal be more fair? Ethics, subject al-
ciency. Dermatol Surg. 2016;42(6):699-709. location, and randomised clinical trials. J Med Ethics.
5. Galderma Laboratories, L.P. Restylane® Lyft™ Lidocaine 1998;24(6):401-408.
- Instructions for Use; 2014. https://www.restylane.com/ 18. Dumville JC, Hahn S, Miles JN, Torgerson DJ. The use of
sites/g/files/jcdfhc206/files/2018-03/Restylane%20 unequal randomisation ratios in clinical trials: a review.
LYFT%20Lidocaine.pdf. Accessed June 4, 2018. Contemp Clin Trials. 2006;27(1):1-12.
6. Galderma Laboratories, L.P. Restylane® Volyme™ Instructions for 19. Akl EA, Briel M, You JJ, et al. Potential impact on estimated
Use; 2016. https://www.restylane.com/ca/sites/g/files/jcdfhc206 treatment effects of information lost to follow-up in ran-
/files/2018-03/Restylane%20Volyme_90-85520-02.pdf. domised controlled trials (LOST-IT): Systematic review.
Accessed June 4, 2018. BMJ. 2012;344(2809):1-12.You can also read