Economic and market overview March 2021 Global In the first week of February, US GDP data was released, showing that real GDP in the US in 2020 ...
←
→
Page content transcription
If your browser does not render page correctly, please read the page content below
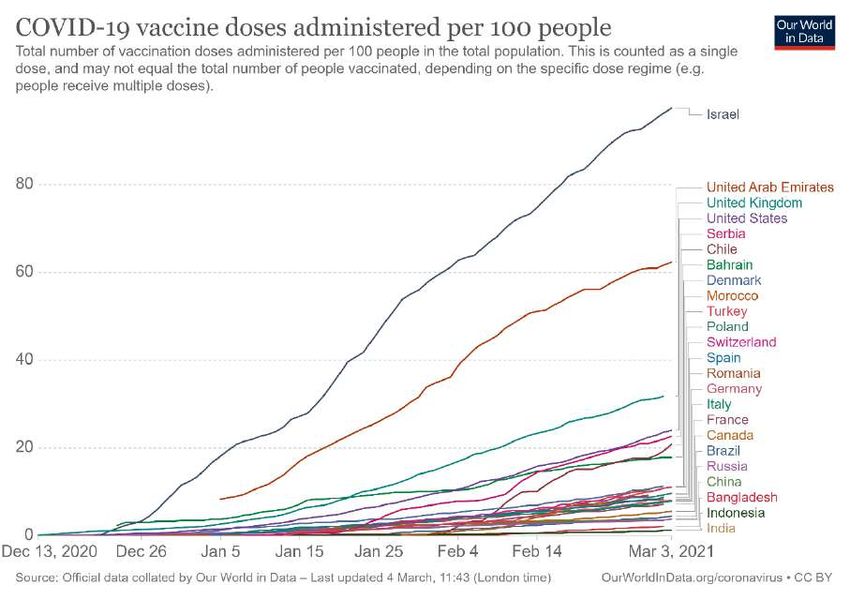
Economic and market overview
March 2021
Global

In the first week of February, US GDP data was released, showing that real GDP in the US in 2020 was
down 3.5% from 2019, the worst performance since 1946.
However, the US economy might have turned the corner according to Sanlam Investments’ February Market Review. Retail
sales picked up substantially from December to January, possibly driven by the latest US stimulus program, which included
$600 billion of direct payments to individuals and unemployment insurance. Unlike the stimulus packages distributed early
in 2020, which were largely saved (or used to drive up Tesla and GameStop’s share prices to dizzy heights), recipients
seemed to spend a large portion of their money this time around. In addition, new infections dropped sharply in January,
making it safer to go out again. US sales data also show a radical shift in consumer behaviour: sales at non-store retailers
were up 28.7% compared to a year ago.
The structural shift to digital platforms boosted the revenue for many of the large players in this sphere. Alphabet reported
strong quarterly advertisement sales, buoyed by heavy digital advertising spending during the holiday shopping quarter.
YouTube ad revenue jumped 46% to $6.9 billion. The virtual world is not without disagreements though; In a digital stare
down, Facebook blocked several news pages in Australia in retaliation to a planned law to force Facebook and Google to
pay Australian publishers for news content.
In the United Kingdom, Chancellor of the exchequer Rishi Sunak delivered his second budget speech on the 3rd of March.
The economic lockdown as a result of the Covid-19 pandemic has had a significant impact on the people and economy of
Great Britain. Despite the government’s furlough scheme and other measures used to protect jobs, more than 700 000
people lost theirs in the last year. Their economy shrunk by 10% (the true definition of decimation) which is the largest
contraction in 300 years, and never has the UK borrowed so much money, outside of wartime, as they have done now. Like
many other developed countries they are likely to have a strong rebound in 2021 and should be back at pre-Covid levels of
economic activity by the end of 2022. A factor that should surely support the economic recovery in the United Kingdom is
their current rate of vaccinations. After Israel and the United Arab Emirates the UK is well ahead of other countries in
administering the vaccine to their adult population. The stark contrast in access to vaccines between developed and
developing countries will be a key factor in the unbalanced global economic recovery that is in progress:
South Africa
Finance Minister Tito Mboweni delivered arguably his most important budget speech to date on 24
February. Most commentators described it as “investor friendly” as it went a long way to signal
government’s intention to reign in the civil servant wage bill and reach a balanced budget by 2023/4.

The term “balanced budget” refers to a situation where the government’s expenses (excluding interest expenditure) equals
its revenue. Aside from much stronger economic growth and the cost of servicing debt, one of the main factors that will
determine whether the South African government can achieve this ambitious goal is the extent to which they can control
the civil servant wage bill. This area alone makes up more than 30% of government expenditure.
It is a very sensitive political matter given the ruling party’s allegiance with labour unions. Nicky Weimar, senior economist
at the Nedbank Group Economic Unit, used the graph below to explain how the largesse of civil servant wage increases over
the last decade will need to be reigned in for the budget to balance in 4 years’ time:

                                                 Civil service wage bill

It’s clear that it will take a focused and combined effort to implement the proposed slowdown in government employees’
salary growth. However, this reduction is paramount as this would have a positive effect on South Africa’s credit ratings and
eventual cost of servicing debt. Every rand saved through lower debt costs translates to a rand that could be used to repair
and create infrastructure, which in turn fuels economic growth and eventually translates into increased tax revenue.
From an income tax point of view very little has changed, with most taxpayers getting marginal relief through an above-
inflation increase in the income tax brackets. The concept of financial emigration is also being phased out with the practical
implication that the South African Revenue Services (as opposed to the Reserve Bank) will be the main entity to administer
capital flowing out of South Africa. Lastly, a reduction in the corporate tax rate (from 28% to 27%) was also proposed for
the 2021/2022 tax year.
 Source: National Budget, Nedbank Group Economic Unit
Market performance
For the fourth month in a row, SA equities as measured by the FTSE/JSE All Share Index (ALSI) had a strong run.
Sanlam Investments reports that an enthusiastic January handed over the baton to an equally fit February, which returned
5.9% in the local equity market. South African listed property is experiencing volatile times but returned 8.6% in February.
Local bonds gained 0.6% and cash returned 0.3%.
On a sectoral basis, Basic Materials, Industrials and Financials returned 11.5%, 4.0% and 4.8% respectively. The MSCI
World index returned 3.2% in rand terms for the month. The rand weakened by 0.6% against the US dollar in February.
Over the past 12 months, the All Share Index made a phenomenal comeback with a 33.2% total return for the year to 28
February. This return was driven primarily by Resources, which continue to perform well ahead of the remaining economic
sectors. Basic Materials are up 66.2% over the past year; Industrials are up 6.2% and Financials are down 4.4%. Listed
property (at -15.8%) is fighting back, but a return to previous highs may remain elusive for a period.
The All Bond Index returned 8.3% for the year, and cash gave 4.8%. The rand strengthened 3.7% against the US dollar but
weakened 6.4% against the euro over the 12 months to end February. Exposure to global equities also paid off handsomely
as the MSCI World Index gave South African investors 24.5% in rand terms.
It is, however, the first time in a while that local equity beat their global counterparts over a rolling 12-month period. Sector
and stock selection was key during this time, however.
1
MARKET INDICES 28 February 2021
(All returns in Rand except where otherwise indicated)
3 months 12 months 5 years
SA equities (JSE All Share Index) 16.1% 33.2% 9.2%
SA property (S&P SA Reit Index) 21.6% -17.1% -8.1%
SA bonds (SA All Bond Index) 3.2% 8.3% 9.8%
SA cash (STeFI) 0.9% 4.9% 6.9%
Global developed equities (MSCI World Index) 3.7% 25.1% 13.8%
Emerging market equities (MSCI Emerging Markets Index) 9.2% 31.4% 14.7%
Global bonds (Bloomberg Barclays Global Aggregate) -3.4% 0.4% 2.8%
2
Rand/dollar -2.1% -3.7% -0.8%
Rand/sterling 2.5% 5.4% -0.8%
Rand/euro -0.7% 6.4% 1.4%
Gold Price (USD) -2.7% 10.5% 7.0%
Oil Price (Brent Crude, USD) 22.8% 37.2% 4.9%
1 Source: Factset
2. A negative number implies fewer rands are being paid per US dollar, so it implies a strengthening of the rand.Commentary – Investment regulations for pension funds. Over the last few years, a lot has been written in financial pages on the possibility of the introduction of prescribed assets for pension funds. “Prescribed assets” refer to a change in Regulation 28 of the Pension Funds act that will require pension funds to invest a minimum portion of their total portfolio into investments prescribed by the government. Examples of such assets would be the bonds or shares of, among others, state-owned enterprises such as Eskom, Transnet, SANRAL and others. This is not a new concept to South Africans. In the lead up to the 1980s, the then Nationalist government legislated prescribed assets in pension funds, peaking in 1977 when a fund had to include at least 77.5% of its assets in a combination of state-owned companies and government bonds. Prescribed assets were abolished in the National Budget of 1989. In a recent webinar Nicky Weimar of Nedbank Group’s economic unit showed that, despite the hype around the importance of infrastructure spend, it remains low at less than 5% of South Africa’s GDP: Official statements from both National Treasury as well as the Department of Finance made it clear that their intention is not to prescribe investments into specific assets but rather enable and encourage investments into infrastructure. Source: National Budget, Nedbank Group Economic Unit To this end National Treasury early in March published some draft amendments to Regulation 28 of the Pension Funds Act. The original (and current) intention of Regulation 28 is to reduce excessive and concentration risk to pension fund member savings and to also ensure protection by limiting the extent to which retirement funds may invest in a particular asset or asset classes. For example – a pension fund cannot invest more than 75% in equities (excluding property securities), more than 10% in gold or more than 5% in the shares of the company whose pension fund it is. The current regulation does not define infrastructure as a specific category, which is currently spread across several asset classes like equity, bonds, loans and private equity. Consequently, current data from retirement funds does not record the exact investment in infrastructure. The proposed amendment therefore introduces a more precise definition of infrastructure to enable much better data capture and measurement.
This definition originates from the Infrastructure Development Act (No 23 of 2014) and reads as follows: “infrastructure”
                       means installations, structures, facilities, systems, services or processes relating to the matters specified in Schedule 1 and
                       which are part of the national infrastructure plan. Schedule 1 of the Act defines the following public installations, structures,
                       facilities, systems or processes as “infrastructure”:

                       National and international airports                              Communication and information technology installations
                       Education institutions                                           Electricity transmission and distribution
                       Health care facilities                                           Human settlements and related infrastructure and facilities
                       Economic facilities                                              Oil or gas pipelines, refineries or other installations
                       Mines                                                            Power stations or installations for harnessing any source of energy
                       Ports and harbours                                               Productive rural and agricultural infrastructure
                       Public roads                                                     Public transport
                       Railways                                                         Sewage works and sanitation
                       Waste infrastructure                                             Water works and water infrastructure

                       The clear intention of National Treasury is to encourage public-private partnerships (PPPs, not to be confused with PPEs) in
                       the maintenance and development of infrastructure.
                       Another proposed change to Regulation 28 is the disaggregation of the asset class “hedge funds, private equity and any
                       other assets” into stand-alone asset classes. This will allow for specific limits to each
                       of these asset classes: no more than 15% in private equity, 10% in hedge funds and 2.5% in other assets.
                       The proposed changes should be viewed in a positive light, and in line with the regulation’s original intention to protect
                       pension fund members from taking on excessive concentration risk. It’s by no means a first step towards the introduction
                       of prescribed assets.

The information and opinions contained in this document are recorded and expressed in good faith and in reliance on sources believed to be credible. No representation, warranty, undertaking or guarantee of
whatever nature is given on the accuracy and/or completeness of such information or the correctness of such opinions. Celerity Investments will have no liability of whatever nature and however arising in respect of
any claim, damages, loss or expenses suffered directly or indirectly by the investor acting on the information contained in this document. Furthermore, due to the fact that Celerity Investments does not act as your
financial advisor, we have not conducted a financial needs analysis and will rely on the needs analysis conducted by your financial advisor. We recommend that you take particular care to consider whether any
information contained in this document is appropriate given your objectives, financial situation and particular needs in view of the fact that there may be limitations on the appropriateness of the advice provided. No
guarantee of investment performance or capital protection should be inferred from any of the information contained in this document. Celerity Investments (Pty) Ltd is an Authorised Financial Services Provider. FSP
No. 47650
You can also read