REGIONAL LABOUR MARKET RESILIENCE INDEX 2020 UNITED STATES - POLICY BRIEF - united states ...

Page created by Clyde Martinez
 
CONTINUE READING
REGIONAL LABOUR MARKET RESILIENCE INDEX 2020 UNITED STATES - POLICY BRIEF - united states ...
REGIONAL LABOUR
MARKET RESILIENCE
INDEX 2020

UNITED STATES

POLICY BRIEF

IN COLLABORATION WITH   WITH SPECIAL FOCUS ON
REGIONAL LABOUR MARKET RESILIENCE INDEX 2020 UNITED STATES - POLICY BRIEF - united states ...
Whiteshield Partners                                                  DISCLAIMER
Strategy & Public Policy Advisory
                                                                      The analysis and drafting of the US Regional Labour Market
Head-Office & Europe Office: 100 Pall Mall, 1st floor, Saint James,   Resilience Index 2020 Policy Brief (hereafter: “Report”) was
London, SW1Y 5NQ, United Kingdom                                      conducted by Whiteshield Partners with the support from its main
Phone/Fax: +442073213744                                              partner ManpowerGroup based on a methodology integrating
                                                                      statistics from international organizations and interviews with the
The US Regional Labour Market Resilience is copyright covered by      Advisory Board members.
the Global Labour Resilience Index. Copyright © 2020 by
Whiteshield Partners.                                                 The Report and any opinions expressed in this publication are the
                                                                      sole responsibility of the authors. All efforts were made to compile
All rights reserved. No part of this publication may be reproduced,   data that is as accurate and recent as possible based on available
stored in a retrieval system, or transmitted, in any form or by any   international sources. Whiteshield Partners, and all entities or
means, electronic, mechanical, photocopying, or otherwise without     partners associated to this Report, do not take any responsibility for
the prior permission of the Whiteshield Partners.                     data that may be inaccurate.

The report is available at
https://www.whiteshieldpartners.com/insights/glri_report

Suggested Citation: Whiteshield Partners, US Regional Labour
Market Resilience Index 2020 Policy Brief

1                  Global Labour Resilience Index 2020 ©
REGIONAL LABOUR MARKET RESILIENCE INDEX 2020 UNITED STATES - POLICY BRIEF - united states ...
US REGIONAL LABOUR
      MARKET RESILIENCE
      RANKING

                                       LRI 2020            1. Structural 2. Policy                                                               LRI 2020 1. Structural 2. Policy
                  US States                                                                                                 US States
                                         rank               Pillar Rank Pillar Rank                                                                rank    Pillar Rank Pillar Rank
District of Columbia*                        1                     13                      1                                         Iowa             27                     40      19
        Massachusetts                        2                     17                      2                                     Hawaii               28                         2   41
                  Maryland                   3                     11                      4                                   Georgia                29                     32      28
                  California                 4                      6                      7                                 Michigan                 30                     27      33
              Washington                     5                     14                      6                                       Idaho              31                     25      35
                   Colorado                  6                     35                      3                                  Missouri                32                     36      29
                  Delaware                   7                      4                      9                                         Ohio             33                     23      37
                Minnesota                    8                     21                      5                                    Indiana               34                     37      31
              Connecticut                    9                      5                     12                         South Dakota                     35                     46      21
              New Jersey                    10                     15                     10                        Montana (US)                      36                     18      40
      New Hampshire                         11                     19                      8                                    Arizona               37                     49      25
                          Utah              12                      3                     18                       South Carolina                     38                     29      39
                      Virginia              13                      7                     17                                 Wyoming                  39                     24      42
                      Oregon                14                     31                     13                                     Florida              40                     48      30
                  New York                  15                     22                     15                                      Maine               41                     51      34
           Rhode Island                     16                     38                     11                              Tennessee                   42                     47      38
                  Nebraska                  17                     33                     14                               Oklahoma                   43                     20      48
                        Illinois            18                      1                     26                           New Mexico                     44                     30      49
                      Kansas                19                     26                     16                                 Alabama                  45                     44      43
                 Wisconsin                  20                      8                     23                                 Kentucky                 46                     42      44
                       Alaska               21                     10                     22                                   Nevada                 47                     41      47
                        Texas               22                     16                     27                                 Arkansas                 48                     45      46
                    Vermont                 23                      9                     32                                Louisiana                 49                     39      50
           North Dakota                     24                     28                     24                              Mississippi                 50                     43      51
           Pennsylvania                     25                     34                     20                          West Virginia                   51                     53      45
         North Carolina                     26                     12                     36
Source: Whiteshield Partners; Note: Based on the Regional Labour Market Resilience Model 2020 constructed for the United States
For a review of the methodology see appendix 1 of the ‘Global Labour Resilience Index 2020: The Geography of Work’
* As the federal capital, the District of Columbia has a special status under the constitution that gives the United States Congress exclusive jurisdiction over the District.

                          Global Labour Resilience Index 2020 ©                                                                                                                           2
7/10
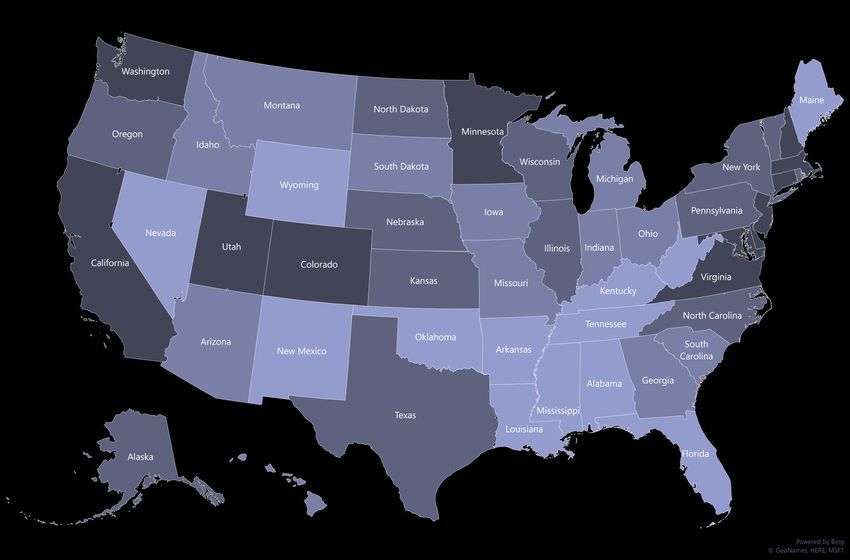
                                                                                                                                                                                                                                         Best universities in America are
                                                                                                                                                                                                                                         situated on east coast
                THE US LABOUR
                                                                                                                                                                                                                                             East coast states score 33%
                MARKET RESILIENCE                                                                                                                                                                                                           better than US LRI average in
                HEATMAP 2020                                                                                                    Wyoming scores 32%
                                                                                                                              below the LRI average for     Illinois is an example of a
                                                                                                                                                                                                  Many states in the rustbelt are
                                                                                                                                                                                                 classified as ‘policy turnarounds’
                                                                                                                                                                                                                                              education and 12% above
                                                                                                                                                                                                                                               average in employment
                                                                                                                                US states for gender             state whose policy              with poor scores for income per
                                                                                                                                       equality            performance, particularly in          capita and innovation reflecting
                                                                                                                                                          education and employment is              the regions decline as heavy
                7/10                                                                                                                                       driven primarily by Chicago,
                                                                                                                                                          which is responsible for over
                                                                                                                                                                                                 industry and manufacturing was
                                                                                                                                                                                                             off-shored
                Of the most resilient US                                                                                                                         75% of state GRP
                states are located on the
                two coasts

                                           21:1
                                  Ratio of venture
                               capital per capita in
                              San Francisco to the                                                                                                                                                                                      District of Columbia ranks first in US
                                 national average                                                                                                                                                                                         LRI. The district benefits from its
                                                                                                                                                                                                                                        young demographics, high income
          California scores much higher                                                                                                                                                                                                  per capita and the presence of the
           than the US LRI average for                                                                                                                                                                                                  federal government with associated
             US states for technology,                                                                                                                                                                                                            economic benefits
                  innovation and
            entrepreneurship reflecting
          the innovation clusters driving
                the state’s success
                                                                                                                                                                                                                                 -40%
                                                                                                                                                                                                                                 Below US average for
                                                                                                                                                                                                                                 technological infrastructure

             Colorado and Utah have become                                                                                                                                                                                                     Southeastern states:
               resilience leaders through the                                                                                                El Paso                                                                                  Location of 5/10 of the most unequal
             combination of a young workforce                                                                                                                                                                                         states and the poorest technological
              and a focus on diversifying into                                                                                                                                                                                            infrastructure in the country,
              advanced technology industries                                                                                                                                                                                           restricting economic development,
                                                                                                                                                                                                                                        social cohesion and sustainable
                                                                                                                                                                                                                                                      growth

                                                                                                                                                              Texas’s structural labour market
                                                                                                                                                             resilience sustained by 4 growth
                                                                                                                                                            poles of El Paso, Austin, Houston
                                                                                                                                                                                                                                                            7/10
                                                                                                                                                            and Dallas. Policy gaps to address                                                  Of the least resilient US
                                                                                                                                                            in education and innovation which                                                   states are located in the
                Labour resilience segmentation                                                                                                               are below the average for the US                                                                South-West
                                                                                                                                                               states in the Whiteshield LRI                Florida is the 2nd weakest state on
                                                                                                                                                                                                             the structural pillar, in particular
                        Tier 1                 Tier 2                 Tier 3                  Tier 4                                                                                                        with an increase in the number of
                                                                                                                                                                                                                retirees and high inequality

Source: Whiteshield Partners
Note: Segmentation by tier based on results of the US Labour Market Resilience model. Darker shades mean greater labour market resilience

3                       Global Labour Resilience Index 2020 ©                                                                                                                                                                                                                    4
US REGIONAL LABOUR MARKET RESILIENCE
                                             PERFORMANCE MATRIX

                                                     Policy potentials: States with high economic
                                               development and low inequality have high potential to                                          Resilience leaders: Innovation and
                                                improve further through increased investment in ICT                                        technology hubs with strong educational
                                                 infrastructure, facilitating education attainment and                                          institutions and solid structural
                                                          developing innovational capacity                                                                 foundations

                                             Policy potentials                                                              Resilience leaders

                                                                                              Virginia
                                                                                                                                  Delaware California
                                                                                 Iowa           Kansas New Hampshire
Policy laggards                                                                         Wisconsin
                  Average Structural Score

                                                                       Indiana
                                                                                            Georgia       Illinois
  Structural Pillar

                                                                South Dakota                            Wyoming            New
                                                                                                     Idaho                 York
                                                                    North Carolina
                                             Louisiana   Arkansas                                 Pennsylvania

                                                                                           Arizona                                      Policy turnaround
                                                                                                                                  Policy turnaround: States which need to
                                                                                                                                nurture innovation and invest in technological
                                                                                                                                capabilities to develop nascent industries and
                                                                                                         Resilience                        attract talent competitively
                                                                                                         laggards
                                                                                  Average Policy Score

                  Policy laggards: States with below                                                        Policy Pillar
                 average structural and policy scores.
                  Key areas to target include income
                    inequality, ICT availability and                                             Structural laggards: States with severe structural issues, reflecting
                       economic diversification                                                long-term concerns in areas such as demographic decline, economic
                                                                                                   diversification and rising inequality. Fundamental reforms are
                                                                                                     needed to ensure sustainability of labour market resilience

Source: Whiteshield Partners
Note: Segmentation by tier based on results of the US Regional Labour Market Resilience model

5                                                    Global Labour Resilience Index 2020 ©
REGIONAL CASE STUDIES

Global Labour Resilience Index 2020 ©
POLICY POTENTIAL: CONNECTING
                                                                                           GROWTH POLES IN TEXAS
                                                                     Dallas
                                                                       Houston
      El Paso                                                                              Four growth poles in Texas are the key drivers
                                                                     Austin                for its balanced economy

                                                                                                                      Structural Pillar: 16th    22nd
                                                                                                                          Policy Pillar: 27th    LRI Rank

                       20%                                                               65%                                      75%
                 Share of U.S exports                                                Service sector                          Texas’s share of US
                                                                                  contribution to private                  petrochemical production
                                                                                      sector activity

      DALLAS

                                                                                               •    30% contribution to Texas GSP
                                                       TEXAS’S
                                                       BUSINESS AND                            •    Population: 1.3 million
                                                       FINANCIAL HUB                           •    Cost of doing business: 3% lower than national average
                                                                                               •    14% of population employed in business and financial
                                                                                                    services
      HOUSTON

     •    28% contribution to Texas GSP
     •    Population: 2.13 million
                                                                                                   STRONG ENERGY
     •    Refines 45% of Texas’s oil production                                                    BASE
     •    Energy and mining employs 13% of the city’s
          population
      AUSTIN

                                                                                               • 8% contribution to Texas GSP
                                                      A CENTER FOR
                                                                                               • Population: 0.9 million
                                                      INNOVATION
                                                      AND EDUCATION                            • Highest educated population in Texas (42.8% of people
                                                                                                 aged above 25 have at least a bachelor degree)
                                                                                               • Contributes to 31% of total patents awarded in Texas
      EL PASO

      • 1% contribution to Texas GSP
      • Population: 0.6 million                                                                STRATEGIC
                                                                                               POSITIONING FOR
      • Second largest port of entry between USA and
        Mexico                                                                                 TRADE AND
                                                                                               COMMERCE
      • Highest share of employment is in retail (13%)

Source: Whiteshield Partners, Federal Reserve Bank of Dallas, US. Bureau of Labor Statistics

7                          Global Labour Resilience Index 2020 ©
Chicago                                 POLICY TURNAROUND: MOVING
                                                                                           BEYOND SINGLE CITY DEPENDENCE
                                                                                           IN ILLINOIS

                                                                                                          Structural Pillar: 1st       18th
                                                                                                             Policy Pillar: 26th       LRI Rank

                             86%                                                       85%                      77.4%
                           Counties had                                              Percentage of           Contribution of Chicago
                         population decline                                      Illinois' job gains in          to Illinois GRP
                            post 2010                                            Chicago post - 2009

      CHICAGO

                                                    • Illinois – like much of the Midwest – has faced diverging economic outcomes
                                                      within the state.
                                                    • The emergence of one large city – Chicago – has become the locus point of
                                                      nearly all economic activity within the state, to the detriment of the remaining
                                                      areas.
                                                    • With a large services and financial sectors, Chicago has been insulated than the
                                                      rest of the state from the struggles affecting both the construction and
    CITIZENS ARE                                      manufacturing industries
    SPATIALLY EXCLUDED
                                                    • Chicago has continued to succeed, becoming the 20th largest economy
    FROM THE GROWTH                                   worldwide
    ECONOMY
                                                    • However, this success has not translated into statewide prosperity

        Spatial income divide                                                   Breakdown in trust                Rural-urban divide

Source: Whiteshield Partners, Federal Reserve Bank of Dallas, US. Bureau of Labor Statistics

                           Global Labour Resilience Index 2020 ©                                                                                  8
NEW DEAL FOR LABOUR RESILIENCE
                                                                              CASE: MILWAUKEE

                                                                              Region: Wisconsin
                                                                              Employment Rate: 95%

                                                                                                       Structural Pillar: 8th        20th
                                                                                                         Policy Pillar: 23rd         LRI Rank

                        16                                                  33%                                    26.6%
              Old age dependency                                         Hold BA degree or                            Poverty rate
                     ratio                                                     higher

     CONTEXT                                                       POLICY                                  KEY CHALLENGES

• Milwaukee is in one of the          • Milwaukee is balancing its legacy                               • Further diversification and renewal
  leading regions in the U.S. for       industries with large                                             with a new economic structure
  manufacturing, with the 2nd           manufacturers such as Harley                                    • A severe skills gap problem due to
  largest % of workforce employed       Davidson and Miller with new                                      low high education attainment and
  in manufacturing                      service-based employment                                          ageing population
• As traditional manufacturing has • The city has prioritized innovation                                • High levels of city spatial inequality
  declined, Milwaukee has become        recently with projects such as                                    and racial segregation
  a transition city, diversifying its   Technology Innovation Centre,
  traditional economic structure        MiKE initiative, The Commons
  through innovation                    and Gener8tor

     POLICY PERSPECTIVES                                                       SELECTED BEST PRACTICES

• Introduce digital skills training to promote                                        • UK Digital Skills Innovation Funds: Fund to pilot
  development of service-based employment                                               and scale up innovative programs to address
                                                                                        regional problems
• Connect with employers to develop
  upskilling and lifelong learning programs                                           • ManpowerGroup’s Academy of Advanced
                                                                                        Manufacturing: Industry-led training for veterans
• Engage with the public in developing
  solutions to long-standing economic and
  social issues                                                                       • Scotland’s citizens’ assembly to gain input on
                                                                                        major national questions

Source: Whiteshield Partners, SkillsPlus, ManpowerGroup, UK Government

9                        Global Labour Resilience Index 2020 ©
CONNECTING FOR LABOUR
                                                                               RESILIENCE
                                                                               CASE: SAN FRANCISCO
                                                                               Region: California
                                                                               Employment Rate: 98%

                                                                                                        Structural Pillar: 6th      4th
                                                                                                            Policy Pillar: 7th     LRI Rank

                       52                                                     52%                                        13%
                Companies worth                                           Projected GMP growth                        Projected growth of
                over USD 1 billion                                             (2020-2030)                          tech jobs (2019-2026)

     CONTEXT                                                    POLICY                                      KEY CHALLENGES

• San Francisco is well known as a • The government of San                                               • High levels of inequality and
  global hub for innovation - it is   Francisco has effectively                                            homelessness
  home to tech giants like Alphabet   leveraged tax policies in order to                                 • High cost of living
  and Facebook                        attract companies. Current tax
• San Francisco Bay Area attracted    policy provides clear economic
  40% of total US venture capital     stimulus for clean-tech start-ups.
  investments in 2018               • The city also benefits from
                                      proximity to world’s prestigious
                                      universities like Stanford and UC
                                      Berkeley that creates an inflow of
                                      talent

     POLICY PERSPECTIVES                                                         SELECTED BEST PRACTICES

• Further involve local firms and citizens in                                    • TechSF: Initiative launched to provide education, training
  helping to solve the city’s most pressing                                        and employment assistance for citizens interested in tech
  problems                                                                         jobs
                                                                                 • ConnectSF: initiative to create a vision for public
• Leveraging existing tech capabilities to                                         transport in San Francisco through discussions with
  provide skills and education to lower-                                           community members, focus groups and online forums
  income and disadvantaged citizens                                              • STIR (Startup in Residence): program connecting
                                                                                   government agents with startups to develop technology
                                                                                   products that address civil challenges

Source: ConnectSF, TechSF, World Economic Forum, San Francisco Committee on
Information Technology, Oxford Economics

                        Global Labour Resilience Index 2020 ©                                                                               10
THE FUTURE IS LOCAL:
     MAKING LABOUR
     MARKET RESILIENCE
     HAPPEN AT THE LOCAL
     LEVEL

Global Labour Resilience Index 2020 ©
POLICY PERSPECTIVES                               BEST PRACTICES

                                           Identify priority segments of citizens           YOUTH EMPLOYMENT
             PROFILE                       living in Illinois outside of Chicago            SUPPORT SCHEME
                                           for policy interventions (e.g., age,             (YESS)
                                           gender, ethnicity, geography, needs)

                                           Establish collaborative programs                 DECIDE MADRID
          NEW DEAL                         between local authorities, the
                                           private sector and citizens to
                                           develop a new economic agenda for
                                           Milwaukee

                                           Facilitate diffusion of digital skills           DIGITAL SKILLS
           CONNECT                         and expertise from innovation                    PARTNERSHIP
                                           cluster in San Francisco to                      (DSP)
                                           disadvantaged citizens through
                                           government-industry partnership

                                           Create publicly-funded innovation                ENTREPRENEURS
         ACCELERATE                        accelerators     to   spur    the                PROGRAM
                                           development of new industries in
                                           Illinois or Milwaukee

           SUSTAIN                         Perform yearly analysis of well-                 EU REGIONAL
                                           being of four main growth poles in               ASSESSMENTS
          GOODWILL
                                           Texas to ensure optimal spatial
                                           development

Source: Whiteshield Partners, YESS, Decide Madrid, UK Government, EU Commission: DG Regio

                         Global Labour Resilience Index 2020 ©                                                    12
DOWNLOAD THE FULL REPORT AT:
https://www.whiteshieldpartners.com/insights/glri_report

        INTELLECTUAL PROPERTY OF WHITESHIELD PARTNERS ©
You can also read