Ecotourism Market Segmentation in Bali, Indonesia: Opportunities for implementing REDD+ - MDPI
←
→
Page content transcription
If your browser does not render page correctly, please read the page content below
Article
Ecotourism Market Segmentation in Bali, Indonesia:
Opportunities for implementing REDD+
Gayoung Choi 1, Jongmin Kim 2, Made Yaya Sawitri 3 and Sue Kyoung Lee 1,*
 1 Division of Climate Technology Cooperation, Green Technology Center, Seoul 04554, Korea;
   choigayoung@gtck.re.kr
 2 Department of Forest Sciences, Seoul National University, Seoul 08826, Korea;

   kim.jongmin.jay@snu.ac.kr
 3 Warmadewa University, Bali 80239, Indonesia; Yayasawitri@warmadewa.ac.id

 * Correspondence: sklee@gtck.re.kr

 Received: 23 April 2020; Accepted: 02 June 2020; Published: 5 June 2020

 Abstract: Ecotourism has been promoted in many regions of Indonesia as a viable platform for
 reducing emissions from deforestation and forest degradation in developing countries (REDD+) by
 providing incentives to local communities for their forest conservation efforts. This study aims to
 find opportunities for implementing REDD+ in Bali through ecotourism market segmentation
 analysis, and to provide policy implications to other developing countries under similar
 circumstances. The results indicate that two clusters—“nature-seeking responsible tourists” and
 “wellness-seeking responsible tourists”—were selected as Bali’s target clusters. Since both have
 higher motivation and a more responsible attitude than other clusters, they are capable of not only
 sustaining a symbiotic relationship between the ecotourism destination and the visitor, but also
 attracting potential tourists with similar characteristics, ultimately contributing to the sustainable
 tourism business in the region. In conclusion, building a marketing strategy based on the
 understanding of the tourists will promote forest conservation effectively, while also playing an
 important role in REDD+ implementation by bringing sustainable tourism income to the local
 community.

 Keywords: ecotourism; market segmentation; REDD+; Bali Island; responsible tourist; Indonesia

1. Introduction
     Tourism is one of the fastest-growing industries of the world that contributes significantly to the
rapidly increasing carbon dioxide emissions [1]. Conversely, it has been heavily affected by the
destruction of the environment, which is caused by human intervention and climate change [2]. As
noted in [3], it is generally believed that the tourism sector must implement adaptation strategies for
the continuous and inevitable impacts of climate change, while also considering participation in
mitigation efforts to avoid the increased damages inflicted by climate change, which have become
too large to be resolved through adaptation. To this end, the tourism sector is seeking sustainable
ways of doing business in the wake of growing concerns over environmental degradation. With that
said, ecotourism is considered the most reliable choice against climate change because it not only
generates financial profits but also conserves the local environmental resources by encouraging low-
impact and non-consumptive usage patterns [4].
     The 3rd Asia-Pacific Rainforest Summit (APRS Indonesia 2018), themed “Protecting forests and
people, supporting economic growth”, was filled with discussions regarding better ways to achieve
socioeconomic developments and carbon emission reduction goals together. During the summit,
ecotourism was acknowledged as an “on-the-ground way to aid land rehabilitation and biodiversity
conservation while still turning a profit” [5]. This was also discussed within the reducing emissions

Land 2020, 9, 186; doi:10.3390/land9060186                                      www.mdpi.com/journal/land
Land 2020, 9, 186 2 of 16
from deforestation and forest degradation in developing countries (REDD+) framework. Considering
that the core aspect of REDD+ is a benefit-sharing mechanism, locally-led ecotourism, or so-called
community-based ecotourism (CBET), could serve as an additional financial pipeline for the local
communities in compensation of their efforts towards conservation of the natural environment. The
World Travel and Tourism Council (WTTC) has also suggested that “governments should combine
tourism with REDD+ actions to develop and incentivize small scale, high-value nature-based tourism
in forest communities that can provide alternative sources of income” [6].
Indonesia—as the largest archipelago in the world and a country with one of the most profound
natural resources—has continued its efforts toward developing ecotourism to conserve
environmental resources and improve the welfare of the local community. Currently, ecotourism
contributes to 45% of Indonesia’s entire income from the tourism sector [7]. Consequently, ecotourism
has been promoted in many regions of Indonesia as a viable means to protect its natural rain forests
and help the indigenous communities to uncover alternative sources of income for sustainable
development in line with REDD+ interventions.
Despite the national efforts to develop ecotourism in line with enhancing REDD+
implementation, many tourism destinations in Indonesia are still in need of more efficient
management strategies for conserving nature and helping local communities. Consequently, it is
necessary for local managers of ecotourism destinations to understand the tourists’ motivations and
attitudes towards the natural environment and local residents, in order to develop a more proper and
suitable management plan for the ecotourism destinations. In particular, recent research has focused
on “environmentally responsible tourists”, who behave pro-environmentally and cautiously in order
to conserve the local environment [8]. This would be the ideal segment of the tourists that one would
choose as a target for marketing, adding to the conventional sustainable destination management
strategy [9]. Previous studies [10] have shown that tourists in this segment were more concerned with
conserving the region’s natural and cultural resources and paying more for it. In other words, eco-
friendly tourists will play an important role in helping REDD+ implementation by promoting local
forest conservation and bringing tourism income to the community.
In this context, this study examined the following objectives: (1) conducting a market
segmentation analysis using the two factors of motivation and responsible attitude; (2) determining
valid cluster-appropriate strategies based on the results of the analysis, and finally, (3) finding
opportunities for implementing REDD+ in Bali and other developing countries under similar
circumstances. This enhanced market knowledge could enable local tourism operators to optimize
the tour experience of visitors and improve revenue generation of local communities while
conserving natural resources. This also highlights the relationship between REDD+ and communities,
on how they could evolve together in an incentive-based conservation context [11]. The implications
drawn from this study provide guidance to those REDD+ practitioners and policymakers in
developing countries who desire to implement incentive-based conservation mechanisms.
2. Literature Review
2.1. REDD+ and Ecotourism
At the 11th Conference of Parties (COP) of the United Nations Framework Convention on
Climate Change (UNFCCC) in 2005, REDD was first negotiated with the aim of reducing carbon
emissions through enhanced forest management in developing countries. The main concept of REDD
is to reduce carbon emissions by providing financial incentives for carbon sequestration resulting
from decreased deforestation and forest degradation in developing countries. This is because
deforestation will continue unless their basic economic needs are improved [12,13].
Two years later, at the COP 13 in Bali, 2007, REDD became a key mechanism of the mitigation
agenda in the Bali Road Map. Subsequently, REDD was modified to REDD+ including three
additional aims—the role of conservation, sustainable management of forests, and enhancement of
forest carbon stocks [14–16]. It was later evolved to include co-benefits to carbon sequestration, such
as biodiversity and strengthening the rights of indigenous communities [17].Land 2020, 9, 186 3 of 16
As mentioned above, the core of the REDD+ mechanism is to provide developing countries with
financial incentives to protect their forests rather than to deforest, so as to reduce greenhouse gas
emissions. These activities aim to protect and enhance the existing carbon storage represented by old
growth forests, and also have aesthetic importance to tourists, as well as biological and ecological
importance [18]. In that sense, forests may become important tourism destinations. In other words,
tourism activities are “the most coherent, non-extractive, economic activities for forest communities
and can act as a major tool for REDD+” [6].
As a form of sustainable tourism, ecotourism is capable of serving as a viable platform for
REDD+ by providing incentives to local communities for their forest conservation efforts. Although
the precise definition of ecotourism has been much debated and studied, the following key elements
are generally included: (i) reference to where ecotourism occurs, e.g., natural areas; (ii) conservation;
(iii) culture; (iv) benefits to locals; and (v) education [19]. In other words, ecotourism can help to
conserve the natural, cultural, and other tourist resources so that future generations can continue to
use them while benefiting present societies [20]. This is in line with the core idea of REDD+, in that it
is possible to achieve the economic benefits of local communities by tourism activities while reducing
emissions through nature conservation.
As seen in Figure 1, the authors of [18] have framed a model for an ecotourism paradigm that
clarifies the relationship between tourism, biodiversity, local communities, and REDD+. Within this
framework, each element is influencing the other, and REDD+ serves as a platform for these elements.
Figure 1. Relationship between local communities, biodiversity, ecotourism, and REDD+ (adapted
from [18], modified from [21]).
For this reason, many developing countries are introducing REDD+ and promoting ecotourism
development as a means to bring benefits to the local community. For example, community-based
forest management (CBFM) in protected forestland area is the most important strategy for Tanzania
to develop REDD+ [22]. As for the CBFM, ecotourism can increase income, stimulate new businesses
through tourism, improve living standards, and create jobs for local residents. Similar cases in
Indonesia include that of Biak Island, where the forest management units applied customary
community partnerships to implement ecotourism and operate timber concessions [23]. These
REDD+ oriented approaches have the potential to improve the economic and livelihood values of
forests than logging.
In conclusion, ecotourism in the context of REDD+ can be an alternative for many developing
countries where forest conservation is difficult for economic purposes.Land 2020, 9, 186 4 of 16
2.2. Ecotourism Development in Bali Island
Bali is located at the east of Java and is the westernmost of the Lesser Sunda Islands in the
Indonesian archipelago. Bali is also well known as “the primary home for the Hindu community in
Indonesia, with 83.5% of the population adhering to Balinese Hinduism” [24]. Over the past decades,
Bali’s unique culture and environmental resources have attracted a large number of Western
travelers, making the island the most important international tourism destination of Indonesia. The
island’s tourism industry has quickly become its main economic driver [25].
However, such rapid developments came with costs. With the increasing number of tourists,
Bali was helplessly exposed to increasing damage to natural resources, disease outbreaks, social
conflicts, and changes in the tourists’ attitude that are considered harmful to local culture [26]. As the
island started paying its toll for the relentless development, sustainability became a popular topic of
discussion. In 1989, the Bali Sustainable Development Project (1989–1996)—funded by the Canadian
International Development Agency (CIDA)—was implemented with an aim to develop an
“institutional capacity and human and societal resources to promote and enhance sustainable
development on this fragile island” [27].
Over the years, sustainable tourism concepts such as community-based ecotourism (CBET) have
become notable forms of tourism in Bali. For example, in 2002, four village communities have
gathered and established a CBET village network named Jaringan Ekowisata Desa (JED), driven to
create tourism that is “by and for the people” [28]. Through this initiative, the network aims to achieve
the development of tourism projects that are planned and managed by the local community, which
seeks to minimize the negative impact on society and the environment along with income generation
for community development [28].
2.3. Market Segmentation: Understanding Tourist Motivations and Attitudes
Market segmentation refers to subdividing a market which is composed of heterogeneous
customers into multiple sub-markets composed of homogeneous customers, grouping the buyers
based on their preferences [29,30]. In this context, market segmentation would enable the tourism site
managers to subdivide the tourists into segments, better comprehend their preferences, and
communicate more efficiently. In previous tourism literature, a number of segmentation criteria, such
as geographic characteristics, socio-demographics, benefits, psychographics, activities, expenditures,
and communication channels have been employed [31].
There are many variables used for segmentation approaches in understanding tourists’
characteristics, but motivation is one of the most effective and crucial indicators to explain the
behavior of tourists [32–35]. The motivation of tourists can be defined as “the combination of needs
and desires that affect the propensity to travel” [36]. Therefore, analyzing motivations of tourists
provides a tourism operator with an enhanced comprehension of their preferences [37], which is vital
in developing tourism products and devising marketing strategies and promotions. Previous studies
[38] have shown that the motivation factor can be categorized into the following: escape, relaxation,
relationship enhancement, and self-development. For ecotourism, in particular, the motivation of
ecotourists is generally “wanting to experience and learn about nature” [39–43]. However, as noted
by Beaumont [39], not all ecotourists have already turned to the pro-environment cause or are
interested in environmental concerns [44,45].
In this sense, attitude can be used as a complementary variable for market segmentation.
Tourists’ responsible attitudes toward host communities play a significant part in sustainable tourism
management of the destinations. Attitude predicts a person's behavior and refers to all judgmental
beliefs about a specific perceptual object, such as a person, object, service, subject, or concept [46]. In
fact, selectively targeting the segment of tourists who are conscious about conserving local
environments and resources has already been suggested as a viable approach to the sustainable
management of a destination [47]. The author of [48] has argued that such approaches complement
current sustainable tourism management tools that have usually worked with tourists at the
destination rather than selectively inviting them to the destination. As Dolnicar [10] noted, the “eco-
segments”, who have much attention on the natural environment and are willing to spend moreLand 2020, 9, 186 5 of 16
money and stay longer at the destination than other segment groups, are highly attractive
characteristics for implementing sustainable tourism. Adongo, Taale, and Adam [49] investigated
that tourists with anthropocentric features have a positive empathic attitude to nature conservation.
For that reason, statistical data (socio-demographic profile, tourism behavior, motivations, and
attitude) of tourists visiting ecotourism destinations have been regularly collected in some developed
countries, and marketing strategies for each tourist attraction are established on the basis of these
data [31,50,51].
From the REDD+ implementation point of view, it is very important to find the “appropriate
segment” that will help forest conservation and local economic development. This is because there
must be no other damage from tourism in order to achieve REDD+ based on ecotourism.
3. Materials and Methods
3.1. Research Sites
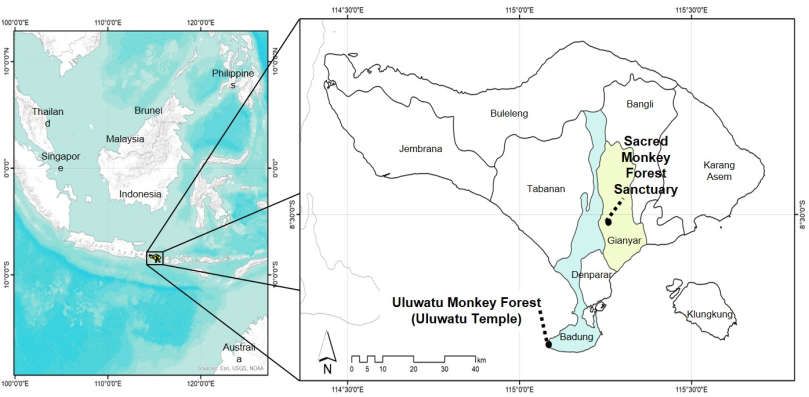
Data for this research were collected through a survey of tourists at two major ecotourism sites
of Bali: Sacred Monkey Forest Sanctuary, which is located in the mountainous regions of northern
Bali, and Uluwatu Monkey Forest, which is also known as Uluwatu Temple, located in the
southernmost area of Bali, as shown in Figure 2. In Bali, free-ranging commensal macaques are closely
connected with people around Hindu temple sites and tourist areas, where they represent not only
cultural and spiritual value, but also the economic value of local communities [52]
Figure 2. Research sites.
The Sacred Monkey Forest Sanctuary is located in the Padangtegal Village (Desa Padangtegal in
Balinese), Ubud. This sanctuary is well known in the international tourism destinations in Bali,
consisting of forestlands with the Balinese long-tailed macaques (Macaca fascicularis) and various
species of trees according to the management authority [53]. However, the Monkey Forest is not only
a tourism attraction but also an important element of Balinese culture in Ubud [54]. Located inside
the Sanctuary are three temples that were built in the 14th century, with traditional rituals still
practiced by local community members to worship the gods and goddesses of Hinduism.
The Uluwatu Monkey Forest is also inhabited by the Balinese long-tailed macaques, and they
are treated as the loyal guardians of the temple. Uluwatu Temple (Pura Uluwatu in Balinese) was
built at the top of the rock cliff of South Kuta, the southernmost area of Bali. The temple is a popular
destination for archeologists for its relics from the 10th century when the temple is known to be built.Land 2020, 9, 186 6 of 16
3.2. Questionnaire Design
After minor revisions in light of the results of a pilot study conducted in February 2019, a
questionnaire was drafted to collect information regarding (1) tourism behavior, (2) motivations, (3)
attitudes, (4) visitor experience, and (5) demographics, in the two major ecotourism destinations of
Bali. The first part—specific motivation items (4 categories, 18 statements)—was adopted from [55],
and the second part—(14 statements) measuring visitors’ attitudes toward aspects of responsible
tourism behavior—was adopted from [56]. Respondents were asked to indicate their responses on a
five-point Likert scale.
3.3. Data Collection
The survey was carried out from March to April 2019 among tourists visiting the Sacred Monkey
Forest Sanctuary and Uluwatu Monkey Forest. The survey was written in two languages—English
and Bahasa Indonesian—for the sake of a smoother data collection process. With cooperation from
local government authorities, a team of local surveyors from Warmadewa University distributed self-
administered questionnaires to the randomly chosen respondents at the exits of each premises
throughout the operation hours of 09:00–18:00, resulting in the collection of 756 questionnaires from
the 2 sites.
3.4. Analysis
The questionnaires were then analyzed through the six-step statistical procedure that this study
has employed: 1) motivation factor analysis, (2) motivation factor clustering, (3) responsible attitude
factor analysis, (4) responsible attitude comparison of clusters, (5) cluster selection, and lastly, (6)
derivation of cluster-appropriate strategy.
4. Results
4.1. Sample Profile
The general demographics of the 756 respondents are provided in Table 1. Of the respondents,
54.3% were women and 45.7% were men. The 20s (45.1%), 30s (28.3%), and 40s (11.6%) were the three
most common age groups. In education, college graduates (46.3%) and those with master’s degrees
(23.1%) formed the majority. The most common companions of these visitors were spouse/partner
(39.2%), followed by relatives/friends (27.7%), and then family with children (20.8%). There was a
small portion of those traveling on package tours (2.1%). In nationality, the majority of tourists are
from countries in Asia (38.8%) followed by Europe (32.1%), with nearly half of them (47.3%) earning
less than 3000 USD. However, those with a monthly income of 5000–5999 USD were the third most
populous group in the category (15.7%).Land 2020, 9, 186 7 of 16
Table 1 Demographic background of sampling.
Demographics N %
Male 337 45.7
Gender
Female 401 54.3
10–19 48 6.5
20–29 335 45.1
30–39 210 28.3
Age 40–49 86 11.6
50–59 33 4.4
60–69 26 3.5
70s or older 5 0.7
Below Middle 48 6.5
Tech/Voc School (Enrolled) 22 3.0
Tech/Voc School (Graduated) 50 6.8
Education
In College/Univ 105 14.3
College/Univ (Grad) 340 46.3
Master’s degree or above 170 23.1
Africa 10 1.5
Asia 264 38.8
Europe 218 32.1
Nationality
North America 94 13.8
South America 15 2.2
Oceania 79 11.6
less than 1000 87 13.3
1000–1999 124 18.9
2000–2999 99 15.1
3000–3999 63 9.6
4000–4999 62 9.5
Monthly Income (USD) 5000–5999 103 15.7
6000–6999 38 5.8
7000–7999 23 3.5
8000–8999 12 1.8
9000–9999 14 2.1
10,000 and more 30 4.6
Alone 30 4.0
Spouse/Partner 292 39.2
Family with Children 155 20.8
Companions
Relatives/Friends 206 27.7
Other Group of Peers 46 6.2
Package Tour 16 2.1
4.2. Motivation-Based Segmentation
The results of the factor analysis on motivation are presented in Table 2. Different from previous
research [55]—in which there were 18 statements and 4 factors: escape, healthy activities, learning
about nature, and cohesion—3 factors (15 motivation statements) were extracted from the factor
analysis in this study: (a) healing (healthy and escape), (b) nature, and (c) cohesion. This was largely
because two of the factors—escape and healthy activities—merged into one in this study. As Bali is
also the world’s largest yoga community, one’s intention to travel for the purpose of yoga could
exhibit both factors of escape and healthy activities simultaneously.Land 2020, 9, 186 8 of 16
Table 2. Motivation factor analysis.
Factor
Healing
Item
(Healthy Nature Cohesion
and Escape)
Helps me to stay in shape .776
Develops my skills and ability .756
Improves my physical health .751
I thought it would be challenging .743
For the solitude .698
Get away from other people .659
Be in a natural setting .779
Observe the scenic beauty .722
Enjoy the sound and smell of nature .700
Experience the tranquility .639
Learn more about nature .635
I could be with friends/family .818
I could do things with my companion .677
To be with others who enjoy the same .654
Eigen Value 4.791 2.087 1.186
Cronbach alpha .849 .774 .651
Through cluster analysis using the factor scores of healing, nature, and cohesion, respondents
were divided into four clusters, as shown in Table 3. Factor scores are expressed as low (lower than
−0.44), mid (−0.44. 0.44), and high (higher than 0.44).
Based on clustering results, it is quite apparent that Cluster 1 has relatively lower motivation
factor scores, while Clusters 2, 3, and 4 have relatively higher motivation factor scores. The result of
the Analysis of Variance (ANOVA) test of motivation factors of the clusters revealed a noticeably
high F-value of above 200, indicating that the differences among motivation factors according to the
clusters were significant.
Table 3. Motivation-based segmentation.
Factors Cluster 1 Cluster 2 Cluster 3 Cluster 4 F
Mid Mid Low High
Healing 339.04**
(0.221) (−0.306) (−1.247) (0.785)
Segmentation
Low High High Mid
Nature 219.12**
(−0.961) (0.753) (0.538) (0.109)
Low Mid High High
Cohesion 352.61**
(−1.692) (−0.205) (0.630) (0.501)
238 106 169 243
N(%)
(31.5%) (14.0%) (22.4%) (32.1%)
** p < 0.01
4.3. Responsible Attitude Comparison of the Clusters
Different from previous research [33]—in which there were 14 statements—a total of 13
statements were used in this study; one statement was eliminated because it exhibited a factor loading
of less than 0.6, as shown in Table 4.Land 2020, 9, 186 9 of 16
Table 4. Attitude factors analysis.
Factor
Question Loading
1
09. It is good to learn and understand natural environment of the destinations. .781
13. It is good to make efforts in learning and understanding local culture. .771
04. It is good to follow nature conservation rules at the destinations. .766
05. It is good to respect locals’ lives and their cultures when traveling. .765
14. It is good to have opportunities of meeting local people and understanding their cultures. .738
06. It is good to use environment-friendly travel packages and/or facilities. .733
10. It is good that a part of my travel expenses is spent on improving locals’ welfare. .710
08. It is good to use restaurants /accommodations operated by locals. .706
03. It is good that a part of my travel expenses is spent on nature conservation. .693
12. It is good to know about local lifestyles before visiting the destination. .691
02. It is good to know about the natural environment of the destinations before visiting there. .666
01. It is good to follow local norms or rules when traveling. .659
07. It is good to actively participate in environmental education programs when traveling. .652
Eigen Value 6.722
Cronbach alpha .920
The results of the mean comparison between clusters of the factor scores of responsible attitudes
are shown in Table 5. The results of the ANOVA test indicated that the differences among the groups
were significant. Factor scores are expressed as low (lower than 0.0), mid (0.1–0.2), and high (higher
than 0.3), respectively. Cluster 1—which exhibited relatively lower overall motivational factor
scores—showed the lowest responsible attitude score, and Cluster 3 had the middle-level score. In
contrast, Cluster 2 and Cluster 4 scored the highest.
Table 5. Responsible attitude comparison of the clusters.
Steps Factors Cluster 1 Cluster 2 Cluster 3 Cluster 4 F
Healing Mid Mid Low High 339.04**
Nature Low High High Mid 219.12**
Segmentation Cohesion Low Mid High High 352.61**
238 106 169 243
N(%)
(31.5%) (14.0%) (22.4%) (32.1%)
Attitude
Low High Mid High
49.43**
(−0.603) (0.337) (0.199) (0.320)
** p < 0.01
4.4. Market Segmentation
Thus far, the motivational factors were analyzed in Step 1 and on the basis of the findings, the
tourists were subdivided into segments in Step 2. In Step 3, the tourists’ responsible attitude factors
were analyzed; in Step 4, it was confirmed that Clusters 2 and 4 had the highest responsible attitude
factor scores, as shown in Table 6. The four clusters were labeled as “general tourists”, “nature-
seeking responsible tourists”, “nature-cohesion seeking tourists”, and “wellness seeking responsible
tourists”. Among the clusters, two clusters (Clusters 2 and 4) were selected as target segments, based
on these rationales: (1) the clusters of tourists with higher factor scores in motivation and responsible
attitude would be the ideal segments for ecotourism sites to synergize together in the symbiotic
relationship between the sites and the visitors. (2) Satisfying the tourists from the selected ideal
clusters would not only be relatively easier to achieve than the other clusters with relatively lower
motivation and responsible attitude factor scores, but also more likely to induce more visits from
other tourists who are in the same (or similar) segments, through referrals and recommendations,
thereby expanding the ecotourism business sustainably.Land 2020, 9, 186 10 of 16
Table 6. Market segmentation.
Steps Factors Cluster 1 Cluster 2 Cluster 3 Cluster 4
Healing Mid Mid Low High
Nature Low High High Mid
Segmentation
Cohesion Low Mid High High
N% 31.5% 14.0% 22.4% 32.1%
Low High Mid High
Attitude
Targeting (−0.603) (0.337) (0.199) (0.320)
Target X O X O
Nature-seeking
General Nature-cohesion Wellness-seeking
Label responsible
tourists seeking tourists responsible tourists
tourists
Table 7 shows the results of the comparison between clusters on gender, age, education,
companion, nationality, monthly income, and budget. For each variable, either chi-square or ANOVA
has been applied accordingly. If the differences between the groups were significant, the distinctive
features of Cluster 2 or Cluster 4 were shaded.Land 2020, 9, 186 11 of 16
Table 7. Cluster profiling and comparison: demographic variables.
χ2 / F
Percentage (%)
(p-value)
Categories
Cluster Cluster Cluster
Total Cluster 4
1 2 3
Male 45.7% 52.2% 40.6% 38.0% 46.9% χ2 =9.10
Gender
Female 54.3% 47.8% 59.4% 62.0% 53.1% (0.028)
10–19 6.5% 6.4% 5.0% 9.0% 5.4%
20–29 45.1% 46.8% 46.5% 43.4% 44.0%
30–39 28.3% 25.5% 33.7% 28.9% 28.2%
χ2=19.46
Age 40–49 11.6% 11.1% 5.9% 11.4% 14.5%
(0.364)
50–59 4.4% 4.7% 5.0% 3.0% 5.0%
60–69 3.5% 5.5% 3.0% 2.4% 2.5%
70s or older .7% 0.0% 1.0% 1.8% .4%
≤Middle School 6.5% 6.0% 7.0% 7.2% 6.3%
Vocational School 3.0% 2.2% 1.0% 2.4% 5.1%
Associate 6.8% 7.8% 3.0% 4.8% 8.9%
χ2=36.61
Education University 14.3% 16.4% 17.0% 16.9% 9.3%
(0.001)
Bachelor’s 46.3% 49.6% 43.0% 35.5% 51.9%
Master’s degree or
23.1% 18.1% 29.0% 33.1% 18.6%
higher
Alone 4.0% 1.3% 16.2% 1.8% 2.9%
Spouse/Partner 39.2% 41.4% 41.0% 40.2% 35.6%
Family with Children 20.8% 22.0% 5.7% 16.0% 29.7% χ2=79.89
Partners
Relatives/Friends 27.7% 25.4% 30.5% 36.1% 22.6% (0.000)
Other Group of Peers 6.2% 6.9% 4.8% 4.7% 7.1%
Package Tour 2.1% 3.0% 1.9% 1.2% 2.1%
Africa 1.5% 2.8% 1.1% 0.0% 1.3%
Asia 38.8% 41.7% 22.2% 15.6% 57.7%
Europe 32.1% 30.6% 46.7% 46.9% 18.1% χ2=102.7
Nationality
North America 13.8% 9.7% 17.8% 22.4% 10.6% (0.000)
South America 2.2% 2.3% 4.4% .7% 2.2%
Oceania 11.6% 13.0% 7.8% 14.3% 10.1%
Less than 1000 13.3% 12.0% 9.4% 15.1% 14.8%
1000–1999 18.9% 21.5% 14.1% 11.8% 23.4%
2000–2999 15.1% 12.4% 18.8% 11.2% 19.1%
3000–3999 9.6% 10.0% 7.1% 11.8% 8.6%
Monthly 4000–4999 9.5% 10.0% 9.4% 5.9% 11.5%
5000–5999 15.7% 19.1% 14.1% 16.4% 12.4% χ2=59.33
Income
(USD) (0.001)
6000–6999 5.8% 7.2% 8.2% 7.2% 2.4%
7000–7999 3.5% 2.9% 3.5% 5.3% 2.9%
8000–8999 1.8% 1.0% 3.5% 2.6% 1.4%
9000–9999 2.1% 1.0% 5.9% 2.0% 1.9%
more than 10,000 4.6% 2.9% 5.9% 10.5% 1.4%
Group Size F=3.518
5.46 5.94 2.91 4.25 7.26
(Number of persons, A) (0.015)
Daily Budget per Capita F=3.653
Budget 63.7 60.4 89.6 64.5 53.5
(USD; B) (0.013)
Daily Budget per Group
347.8 358.8 260.7 274.1 388.4 -
(USD; A*B)
4.5. Cluster-Appropriate Strategy
The characteristics of Cluster 2 (nature-seeking responsible tourists) and Cluster 4 (wellness-
seeking responsible tourist) can be summarized as shown in Table 8. Cluster 2 is described as
European women with advanced educational backgrounds of the above master’s level with relatively
high monthly income; they preferred to indulge in nature by traveling alone. The tourists in thisLand 2020, 9, 186 12 of 16
cluster are most likely to be attracted by images or visual effects that present comfortable and well-
managed facilities in the vicinity of a magnificent natural vista. They have shown patterns to travel
individually, but with their high level of income, they tend to make copious expenditures during
their travels, which makes them an attractive target cluster for ecotourism managers.
Cluster 4 could be characterized as Asians who preferred to travel in groups of families,
relatives, friends, and children, in a more restful fashion; this strongly reflects their motivation factors
of healing and cohesion. Therefore, they are likely to be more easily drawn to destinations that project
and emphasize images of a family vacation, a family trip, or group activities. The members of this
cluster exhibited a relatively lower level of monthly income (1000–2999 USD) compared to other
clusters. Thus, while their per capita spending would also be relatively smaller than that of other
clusters, their total spending would be a large sum as they travel in groups. Additionally, since the
ecotourists in this cluster tend to travel in groups, the range and effects of their referrals and
recommendations to their peers would be presumed to be wider and faster than the individual
travelers, based on their headcounts.
Table 8. Summary of characteristics of Clusters 2 and 4.
Category Cluster 2 Cluster 4
Common High Satisfaction Level of Bali
Motivation Factors Nature Healing, Cohesion
Gender Female No significance
Education Above Master’s Bachelor’s and Voc/Tech Schools
Partners Alone Family with Children
Nationality Europe Asia
Monthly Income More than USD 9000 USD 1000–2999
Expenditure Traveling alone but large expenditure Traveling in groups but small expenditure
Features per capita per capita
5. Discussion and Conclusions
This research was based on the precondition that efficient management of ecotourism sites could
be achieved by discovering the characteristics of the tourists, as the ecotourism market would be
segmented based on the motivations, and that the segmented clusters would exhibit differentiated
levels of responsible attitude towards ecotourism sites. This is because effective management of the
ecotourism destination can be achieved by understanding the tourists, and REDD+ can be realized
based on this.
To achieve the objectives, a questionnaire containing sets of statements and questions were
distributed to randomly chosen tourists as they were exiting Sacred Monkey Forest Sanctuary and
Uluwatu Monkey Forest, the two most popular ecotourism destinations of Bali, Indonesia. The
collected responses enabled the measurement of the ecotourists’ motivations and responsible
attitudes. With these responses, a market segmentation analysis was performed.
In conclusion, two clusters (nature-seeking responsible tourists, wellness-seeking responsible
tourists) were selected as Bali’s target clusters based on the following rationales: (1) clusters with high
motivation and responsible attitude factor scores would also be better for the management of the
sites, since the ecotourism sites and tourists share a symbiotic relationship. (2) Satisfying these ideal
clusters would not only be relatively easier than other clusters with lower motivation and responsible
attitude factor scores, but also a more effective method to attract potential tourists with similar
characteristics, contributing to sustainable tourism business in the region.
Cluster 2 (nature-seeking responsible tourists) was best characterized as European women with
a high level of education (master’s degree or above) and a high level of monthly income (9000 USD
or above), who preferred to travel alone. It would be safe to predict that tourists in this cluster would
most likely be drawn to comfortable and well-maintained facilities surrounded by—or near the sights
of—nature, based on their preferences and high level of monthly income. This is the same tendency
as seen in previous research on the characteristics of ecotourists [57]; they were highly educated, hadLand 2020, 9, 186 13 of 16
higher income, consisted of mostly females, and were more likely to travel alone compared to mass
tourists. In contrast, Cluster 4 (wellness-seeking responsible tourists) was defined as a group of
Asians who traveled as groups of families, relatives, friends, and children. The tourists in this cluster
tend to have a relatively lower level of education (bachelor’s degree or lower) and monthly income
(between 1000 and 2999 USD). Therefore, it could be predicted that they would prefer sites equipped
with family (or group)-oriented activities. While their individual budget may be relatively lower, the
budget per group is high as they travel in relatively larger groups. However, given that travel is one
of the best forms of education for children and family bonding [58], this opportunity will allow the
cultivation of “responsible tourist” from a long-term perspective if proper education is provided to
them.
With the characteristics of each cluster uncovered, it became possible to identify the preferences
and tendencies of the diverse segments of tourists, which further enabled this research to progress
into the step of deriving the proper marketing strategy. This is in line with the result of previous
studies which have investigated tourists’ motivations and attitudes, which are useful variables in
market segmentation [37,38,59,60]. The results of this study indicate that the attitude factor is a useful
criterion for segmenting the tourist market and motivating tourists to visit ecotourism sites, along
with motivation factors. The attitude factor is also relevant in market segmentation because it
provides a more comprehensive basis that measures eco-friendly actions and responsible attitudes
toward local communities.
Changes in tourism values, interests, and preferences have spawned a growing tourist segment
that tends to protect the natural and cultural environment. This market segment is growing rapidly
[61]. As mentioned in [61], the increasing number of tourists declaring themselves as ecotourists has
implications for the concept’s implementation and ecotourism activities’ practice. However, as
pointed out by Beaumont [39], not all ecotourists have already faced or are interested in
environmental issues [44,45]. Therefore, it is necessary to consider ways to promote pro-
environmental behaviors and attitudes. Ecotourism will be operated efficiently when tourists have
these aspects, and this is the basis for successful REDD+ implementation. In the case of Tanzania [22],
local Non-Governmental Organizations(NGOs) have partnered with the government to operate
ecotourism programs, trying to build a more sustainable ecotourism model through tourist education.
It could be concluded that ecotourism conserves and enhances forest resources and improves
the well-being of local communities through incentive-based conservation mechanisms. In other
words, it helps to maintain the coexistence of forests, people, and wildlife. This also provides practical
guidance to forest-based tourism destinations in developing countries, which have faced a reduction
in global greenhouse gases through sustainable forest protection and carbon storage. However, this
can be done sustainably when more responsible tourists visit the destinations.
According to [61], at least four government agencies (the Ministry of Forestry, the Ministry of
Internal Affairs, the Ministry of Tourism and Creative Economy, and the Ministry of Marine Affairs
and Fisheries) are involved in the development of ecotourism in Indonesia. This shows that REDD+
and ecotourism are very important agendas for Indonesia to conserve tropical forests while achieving
economic development. Therefore, the findings of this research could further be used as a suggestion
for the state government of Bali and their respective agencies and offices that handle ecotourism site
management. The recommendations could contribute by providing valuable insights to them for
developing their marketing strategy and management options for sustainable ecotourism and serving
as useful resources for future research in related fields. Moreover, the implications drawn from this
study provide guidance to those REDD+ practitioners and policymakers in developing countries who
desire to implement incentive-based conservation mechanisms. As pointed out by Peskett et al. [62],
ecotourism has proven helpful for social developments in REDD+ implementation through the effects
such as (1) income from tourism, (2) job creation, (3) improved local services and support, (4) future
income from bundled ecosystem services, (5) maintenance of local environmental services, and
therefore local agricultural production. On that note, this study is meaningful since it has drawn
implications on how to operate ecotourism when promoting REDD+. However, this study also has
limitations in that the research has been conducted only in Bali Island. In future studies, moreLand 2020, 9, 186 14 of 16
practical REDD+ strategies could be derived through tourist surveys focusing on the sites where
REDD+ has been already executed.
Author Contributions: Conceptualization, J.K., G.C.; methodology, G.C., J.K.; software, J.K.; validation, J.K.,
G.C., S.L.; formal analysis, J.K.; investigation, J.K., G.C.; resources, M.S., J.K.; data curation, M.S., J.K.; writing—
original draft preparation, J.K.; writing—review and editing, G.C., J.K., and S.L.; visualization, J.K., G.C., and
S.L.; supervision, G.C., S.L.; project administration, J.K., G.C.; funding acquisition, J.K., G.C., and S.L. All authors
have read and agreed to the published version of the manuscript.
Funding: A field survey of this research was funded by the Seoul National University Asia Center.
Acknowledgments: We would like to thank the Green Technology Center Korea for their kind support and
expertise for publication.
Conflicts of Interest: The authors declare no conflict of interest.
References
1. Paramati, S.R.; Samsul Alam, C.F.C. The Effects of Tourism on Economic Growth and CO2 Emissions: A
Comparison between Developed and Developing Economies. J. Travel Res. 2017, 56, 712–724.
2. ForestIndustries. EU Ecotourism May Be a Solution to the Tourism Industry’s Climate Threat. Available
online: https://forestindustries.eu/content/ecotourism-may-be-solution-tourism-industry’s-climate-threat
(accessed on 16 April 2020).
3. Weaver, D. Can sustainable tourism survive climate change? J. Sustain. Tour. 2011, 19, 5–15.
4. Stem, C.J.; Lassoie, J.P.; Lee, D.R.; Deshler, D.D.; Schelhas, J.W. Community participation in ecotourism
benefits: The link to conservation practices and perspectives. Soc. Nat. Resour. 2003, 16, 387–413.
5. APRS Protecting forests and people, supporting economic growth. In Proceedings of the 3rd Asia-Pacific
Rainforest Summit, Yogyakarta, Indonesia, 23–25 April 2018; p. 20.
6. Lawless, G.; Cbe, A.P.; Petruccelli, C.; Cbe, C.R.; Rutledge, J.C.; Chen, R.; Compton, J.; Hosch, R.; Joyce, S.P.;
Lerch, H.; et al. Climate Change A Joint Approach to Addressing the Challenge; World Travel and Tourism
Council (WTTC): London, UK, 2011.
7. Ollivaud, P.; Haxton, P. Making the Most of Tourism in Indonesia to Promote Sustainable Regional Development;
OECD Working papers No.1535, OECD Publishing, 2019.
8. Kerstetter, D.L.; Hou, J.S.; Lin, C.H. Profiling Taiwanese ecotourists using a behavioral approach. Tour.
Manag. 2004, 25, 491–498.
9. Dolnicar, S.; Long, P. Beyond ecotourism: The environmentally responsible tourist in the general travel
experience. Tour. Anal. 2009, 14, 503–513.
10. Dolnicar, S. Insights into sustainable tourists in Austria: A data-based a priori segmentation approach. J.
Sustain. Tour. 2004, 12, 209–218.
11. Wearing, S.; McDonald, M.; Schweinsberg, S.; Chatterton, P.; Bainbridge, T. Exploring tripartite praxis for
the REDD + forest climate change initiative through community based ecotourism. J. Sustain. Tour. 2020,
28, 377–393.
12. Roe, D.; Harris, C.; Andrade, J. De; Goodwin, H. Addressing Poverty Issues in Tourism Standards A review
of experience. PPT Working Paper 14, Pro-Poor Tourism Partnership. 2003.
13. Kumar, P. The Economics of Ecosystems and Biodiversity: Ecological and Economic Foundations;
UNEP/Earthprint: Nairobi, Kenya, 2010.
14. Minang, P.A.; Van Noordwijk, M.; Duguma, L.A.; Alemagi, D.; Do, T.H.; Bernard, F.; Agung, P.; Robiglio,
V.; Catacutan, D.; Suyanto, S.; et al. REDD+ Readiness progress across countries: Time for reconsideration.
Clim. Policy 2014, 14, 685–708.
15. Thompson, M.C.; Baruah, M.; Carr, E.R. Seeing REDD+ as a project of environmental governance. Environ.
Sci. Policy 2011, 14, 100–110.
16. Umemiya, C.; Rametsteiner, E.; Kraxner, F. Quantifying the impacts of the quality of governance on
deforestation. Environ. Sci. Policy 2010, 13, 695–701.
17. Enrici, A.M.; Hubacek, K. Challenges for REDD+ in Indonesia: A case study of three project sites. Ecol. Soc.
2018, 23, 7
18. Bennathaniel, H.; Diengdoh, Lasara, M. LyngDOH, T.K. Can REDD+ and Ecotourism coexist? Integrating
REDD+ and Ecotourism in Meghalaya : Potential and Implications. In Climate Change and Developing
Countries; Mawlong, B.L., Ed.; Cambridge Scholars Publishing: Newcstle upon Tyne, UK, 2018.Land 2020, 9, 186 15 of 16
19. Fennell, D.A. A content analysis of ecotourism definitions. Curr. Issues Tour. 2001, 4, 403–421.
20. Dimitriou, C.K. From theory to practice of ecotourism: Major obstacles that stand in the way and best
practices that lead to success. Eur. J. Tour. Hosp. Recreat. 2017, 8, 26–37.
21. Ross, S.; Wall, G. Ecotourism: Towards congruence between theory and practice. Tour. Manag. 1999, 20,
123–132.
22. Mwakalobo, A.B.S.; Kajembe, G.C.; Silayo, D.S.; Nzunda, E.; Zahabu, E.; Maliondo, S.; Kimaro, D.N. REDD
and Sustainable Development-Perspective from Tanzania; Tanzania IIED Working Papers: London, UK, 2011.
23. IUCN Indonesia Links REDD + Benefit Sharing with Local Forest Governance; IUCN: Gland, Switzerland, 2016.
24. PENDUDUK, S. Census. Available online: https://sp2010.bps.go.id/index.php/site/tabel?tid=321&wid=0
(accessed on 7 April 2020).
25. Vickers, A. Bali: A Paradise Created; Tuttle Publishing: Rutland County, VT, USA, 2013.
26. Prideaux, B.; Laws, E.; Management, B.F.-T. Undefined Events in Indonesia: Exploring the Limits to Formal
Tourism Trends Forecasting Methods in Complex Crisis Situations; Elsevier: Amsterdam, The Netherland, 2003.
27. Ringer, G. Bali: Balancing environment, economy and culture. Ann. Tour. Res. 1997, 2, 485–487.
28. Byczek, C. Blessings for All? Community-Based Ecotourism in Bali Between Global, National, and Local
Interests-A Case Study. Aseas 2011, 4, 81–106.
29. W. Smith Product differentiation and market segmentation as alternati. Mark. Manag. 1995, 4, 63–65.
30. Makens, P.T.K.J.T.B.J. Marketing for Hospitality and Tourism; 4th ed.; Pearson Education: Upper Saddle River,
NJ, USA, 2009.
31. Jang, S.C.; Morrison, A.M.; O’Leary, J.T. Benefit segmentation of Japanese pleasure travelers to the USA
and Canada: Selecting target markets based on the profitability and risk of individual market segments.
Tour. Manag. 2002, 23, 367–378.
32. Government, Q. Queensland Ecotourism Plan 2013–2020; Queensland, Australia, 2013.
33. Morrison, A. Hospitality and Travel Marketing, 2nd ed.; Albany, NY, USA, 1996.
34. Loker, L.E.; Perdue, R.R. A Benefit-based Segmentation of a Nonresident Summer Travel Market. J. Travel
Res. 1992, 31, 30–35.
35. Crompton, J.L. Motivations for pleasure vacation. Ann. Tour. Res. 1979, 6, 408–424.
36. O’Leary, S.; Deegan, J. Ireland’s Image as a Tourism Destination in France: Attribute Importance and
Performance. J. Travel Res. 2005, 43, 247–256.
37. Bansal, H.; Eiselt, H.A. Exploratory research of tourist motivations and planning. Tour. Manag. 2004, 25,
387–396.
38. Pearce, P.L.; Lee, U.-I. Developing the Travel Career Approach to Tourist Motivation. J. Travel Res. 2005,
43, 226–237.
39. Beaumont, N. Ecotourism and the Conservation Ethic: Recruiting the Uninitiated or Preaching to the
Converted?. J. Sustain. Tour. 2001, 94, 317–341.
40. Saleh, F.; Karwacki, J. Revisiting the ecotourist: The case of grasslands national park. J. Sustain. Tour. 1996,
4, 61–80.
41. McArthur, D.H.-; Weir, S.; Australia’s, B.; (eds.) Undefined Understanding the Australian Nature-Based Tourism
Market; Elsevier: Amsterdam, The Netherland, 1998.
42. Eagles, P.F.J.; Cascagnette, J.W. Canadian ecotourists who are they? Tour. Recreat. Res. 1995, 20, 22–28.
43. Ballantine, J.L.; Eagles, P.F.J. Defining canadian ecotourists. J. Sustain. Tour. 1994, 2, 210–214.
44. Cater, E. Ecotourism in the Third World: Problems and prospects for sustainability. Ecotour. Sustain. Opt.
1994, 69–86.
45. Beckmann, E.A. Evaluation of DCNR Visitor Interpretation Programs with Emphasis on Night Walks and Rockpool
Rambles Summer 1992/93; Department of Conservation and Natural Resources: Victoria, Austrilia, 1993.
46. Ajzen, I. Attitudes, Personality, and Behavior, 2nd ed.; Open University Press: New York, NY, USA, 2005.
47. Inskeep, E. Tourism Planning: An Integrated and Sustainable Development Approach; SAGE Publications: Van
Nostrand Reinhold, New York, NY, USA, 1991.
48. Dolnicar, S. Nature-conserving tourists: The need for a broader perspective. Anatolia 2006, 17, 235–255.
49. Adongo, C.A.; Taale, F.; Adam, I. Tourists’ values and empathic attitude toward sustainable development
in tourism. Ecol. Econ. 2018, 150, 251–263.
50. GTZ report. Shouf Bioshphere Reserve Ecotourism Strategy; 2009.
51. Northeast Michigan Council of Governments. Ecotourism on the Surise Coast : A Marketing Report for Alpena,
Alcona, and Presque Isle countries; Northeast Michigan Council of Governments: Gaylord, MI, USA, 2012.Land 2020, 9, 186 16 of 16
52. Fuentes, A. Naturalcultural encounters in bali: Monkeys, temples, tourists, and ethnoprimatology. Cult.
Anthropol. 2010, 25, 600–624.
53. UBUD Monkey Forest. Available online: https://www.monkeyforestubud.com/ (accessed on 12 September
2019).
54. Wheatley, B.P.; Putra, D.K.H. The Effects of tourism on conservation at the Monkey Forest in Ubud, Bali.
Rev. d’écologie 1994, 49, 245–257.
55. Palacio, V.; Mc Cool, S.F. Identifying ecotourists in belize through benefit segmentation: A preliminary
analysis. J. Sustain. Tour. 1997, 5, 234–243.
56. Kang, M.; Moscardo, G. Exploring cross-cultural differences in attitudes towards responsible tourist
behaviour: A comparison of Korean, British and Australian tourists. Asia Pacific J. Tour. Res. 2006, 11, 303–
320.
57. Crossley, J.; Lee, B. Characteristics of Ecotourists and Mass Tourists. Vis. Leis. Bus. 1994, 13, 2.
58. Backer, E.; Schanzel, H.; Yeoman, I. Family Tourism : Multidisciplinary Perspectives; Channel View
Publications, Bristol, UK, 2012; ISBN 1845413261.
59. Albayrak, T.; Caber, M. Examining the relationship between tourist motivation and satisfaction by two
competing methods. Tour. Manag. 2018, 69, 201–213.
60. Gnoth, J. Tourism motivation and expectation formation. Ann. Tour. Res. 1997, 24, 283–304.
61. Kim, S.; Kang, M.; Sukmajaya, D. Opportunities and Challenges of Ecotourism in ASEAN Countries; Jungmin
Publishing Co.: Seoul, Korea, 2013.
62. Peskett, L.; Huberman, D.; Bowen-Jones, E.; Edwards, G.; Brown, J.; Brown, D.; Luttrell, C.; Clairs, T.;
Curran, L.; Franks, P.; et al. Making REDD Work for the Poor; IUCN: Gland, Switzerland, 2008.
© 2020 by the authors. Licensee MDPI, Basel, Switzerland. This article is an open access
article distributed under the terms and conditions of the Creative Commons Attribution
(CC BY) license (http://creativecommons.org/licenses/by/4.0/).You can also read