Education, Education, Education - Tony Blair and Andrew Adonis Submission to The Times Education Commission June 2021 - Institute for Global Change
←
→
Page content transcription
If your browser does not render page correctly, please read the page content below
1

        Education, Education, Education

‘What the wise parent would wish for their child, so the state must wish for all children’

                                                                     Tony Blair and Andrew Adonis
                                                Submission to The Times Education Commission
                                                                                             June 2021

                                                                                                    1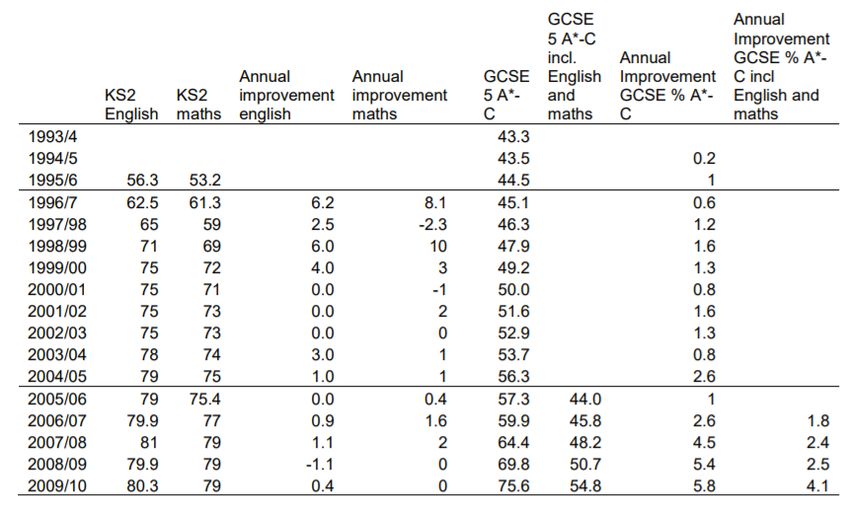
2

‘To govern is to choose’ and it is imperative that government once again chooses to put education at
the top of the nation’s priorities.

The Times Education Commission is timely, for there is no more important challenge facing the
country than to raise the standard of national education after a decade of inadequate progress and
now the COVID-19 crisis. Children and young people have had more than a year of their education
severely disrupted. For the least advantaged, who have suffered grievously, this may lead to a ‘lost
generation’ and a social and economic crisis lasting decades. The government’s response is
insufficient, leading to the resignation of its own Education Recovery Commissioner.

In the 1990s, Britain faced a similar educational crisis, caused by the failure of successive
governments of both parties over many decades to give education the priority it required in terms of
investment and fundamental reform. While an elite had world class opportunities and achieved
highly, in top-end private and state schools and universities, educational failure had become virtually
hereditary in many communities and too little was being done to raise average standards and to
break cycles of disadvantage and underperformance.

This is why ‘education, education, education’ was the mantra of the 1997 government. It wasn’t so
much a slogan as a call to action and a re-setting of national priorities. Our mission was to bring
about systemic, relentless, nationwide educational improvement, with investment and reform
proceeding hand-in-hand. A good deal was achieved over the 13 years of that government – state
spending on education doubled in real terms and standards and high quality provision rose
appreciably – but we believed at the time that this was only the beginning of what needed to be
done to make Britain a top nation for education and skills, and the momentum of the 2000s now
needs urgently to be regained. We saw educational transformation as a permanent revolution, not a
quick fix to be abandoned after barely a decade

This is borne out by OECD data from the ‘PISA’ surveys of comparative educational performance in
literacy, numeracy and science since 2000, which shows that England has almost never
outperformed the international average to a statistically significant degree and that we are far
behind the leading nations. Of acute concern to us today, as it was when we were in government, is
England’s gap with the top performers, both long-term high-achievers such as Singapore and some
relatively new entrants such as Estonia.

We will not become world class for skills and social mobility unless ‘education, education, education’
once again becomes our national mantra. This is a clarion call to all political parties, including our
own, and not just to the governing Conservative party. It is time for education to retake centre stage
as a national reform priority in place of the out-of-date ‘small c’ conservativism of today’s left and
right, the one focused on distractions like renationalisation, the other hiding the absence of
substance by stoking culture wars. We should focus on what matters to the real state of the country
and its people, and seek to unite not divide in pursuit of big worthwhile change. That is our aim.

Making education a national priority in the 1990s

It is relevant and instructive to the present situation to consider the last time – in the 1990s – that
education was propelled from the sidelines of politics and government to become a national priority.

‘Education, education, education’ was far more than a slogan when we put it at the heart of New
Labour’s mission in 1996, before taking office a year later. It was rooted in an analysis of the deep

                                                                                                        2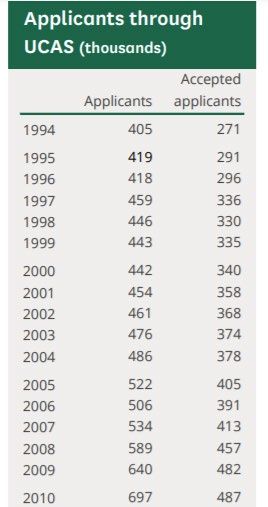
3

national educational failure underpinning Britain’s long-standing social and economic problems; and
it was a deliberate setting of priorities for the forthcoming election and for a government if Labour
won. This paved the way for the programme of investment and reform substantially delivered by
government over the following 13 years.

Andreas Schleicher, creator of the OECD’s pathbreaking international educational studies and
assessments, rightly says that ‘without data, you are just another person with an opinion’. Our
analysis of Britain’s education predicament in the mid-1990s was data driven:

    •   Results of the first national tests in English and maths for all 11 year-olds in 1995 showed far
        fewer than half achieving the literacy and numeracy standard expected of their age.
    •   The typical 16 year-old school leaver achieved only two or three GCSE, without even a good
        pass grade in GCSE English and maths. In more than 1,500 comprehensive schools in England
        in 1997 – more than half of all secondary schools – seven in ten pupils were leaving with
        fewer than five GCSEs at pass grade including English and maths.
    •   Britain had a smaller share of 17- and 18-year olds in full-time education, compared to
        almost all other industrial nations.
    •   Nearly two-thirds of the adult workforce lacked vocational qualifications.
    •   A large proportion of state schools lacked adequate leadership and insufficient well-trained
        and qualified staff, according to the then newly established schools inspectorate OFSTED.
    •   School infrastructure was in a generally substandard, often deplorable condition. The
        majority of schools had poor basic facilities and inadequate specialist facilities, including for
        the teaching of science, the arts and sport, and poor IT.

We were also highly mindful of the fact that in the 1990s the professional and managerial classes
were sending their children to private schools in large numbers (7% of all pupils and nearly 20% of
those undertaking A-level courses), and that this private system was relatively far larger and more
divorced from the state system than in almost all other advanced democratic countries. In doing so
these parents were paying fees generally twice or more the level that the state was providing per
pupil to its own schools, and achieving far better outcomes than in all but a tiny minority of state
schools. Class sizes in private schools were about half the size of state schools, the range of
curriculum provision – including in sport, the arts and science – was far broader than in most state
schools, and facilities were generally far better. More than a quarter of all students proceeding to
the Britain’s highest rated universities came from the 7% of pupils educated in these private schools.

The progressive philosopher R H Tawney observed: ‘what the wise parent would wish for their child,
so the state must wish for all children’. It was starkly obvious to us that there was a gulf between the
preferences of wise parents and the generality of state school provision, and we felt a profound
social and ethical duty to mobilise the full authority and resources of the state to seek to bridge this
gap.

From this analysis, and these ethical foundations, flowed the Labour government’s twin-track
strategy of radical investment and radical reform to promote a step-change in educational
standards. This was led from the very top of the government in No. 10 Downing Street – and had it
not been so, neither the radical investment nor the radical reform would have been put in place, nor
would the job of Education Secretary, and the role of the Education Department, have achieved the
high status within Whitehall that they did under Education Secretaries from David Blunkett (1997-
2001) to Alan Johnson and Ed Balls (2006-10), which was vital also to driving change.

By 2010, independent assessments attested to significant improvements in all the areas identified
above. State education spending doubled in real terms, and rose significantly as a proportion of

                                                                                                       3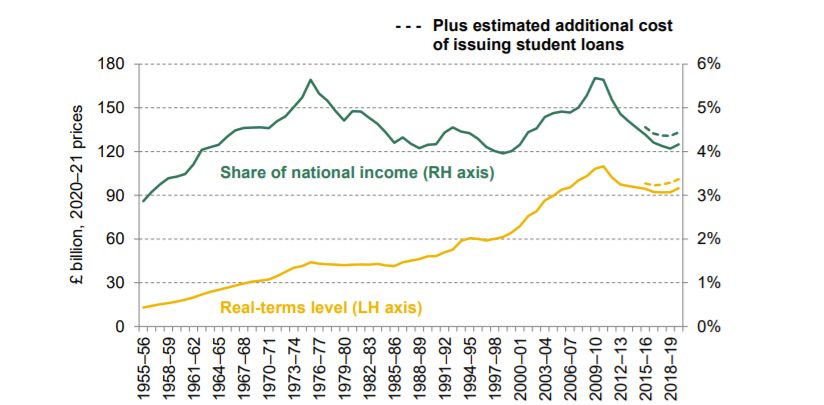
4

national income – including a nearly ten-fold increase in the school capital programme from £700m
to £8bn a year – which supported a reform programme which substantially raised the quantity and
quality of educational provision. The concept of ‘failing schools’, which was a central part of the
public narrative about England’s state education system from the 1970s to the 1990s, had largely
been eradicated by 2010. By 2010 education reform was still work in progress – inequalities
remained significant and standards and opportunities were still not uniformly high enough,
particularly among the half of students not proceeding to university – but there was a national
mission in progress.

The changes made after 1997 were fundamental. Real-terms per pupil funding increased by 110 per
cent from £3,030 in 1997-98 to £6,350 in 2009-10. By 2010 there were 48,000 more teachers and
212,000 more support staff than in 1997. Nearly 4,000 schools were rebuilt or significantly
refurbished and upgraded. By 2010, thanks to national literacy and numeracy strategies
implemented in every primary school in England, the great majority of 11 year-olds were reaching
expected standard in literacy and numeracy. Thanks to similarly thoroughgoing reform in secondary
education, the great majority of 16 year-olds were achieving five or more good GCSE passes, while
the number of failing secondary schools – on basic GCSE performance – had fallen from more than
1,500 schools to just 247. More young people were going on to university than ever before.

Figure 1 gives a snapshot of the improvement in student performance during the 1997-2010
government:

Figure 1: Percentage of Pupils Achieving Expected Levels at Key Stage 2 and 4, 1993/1994 to
2009/2010

Two key effects of the 1997 government’s investment and reform strategy were a significant
reduction in poverty and an increase in social mobility. The 2018 OECD report on social mobility,
citing evidence of change in the first decade of the century, stated: ‘The UK stands out very
specifically … with a sharp decline of income persistence at the bottom’. In the late 1990s six out of
ten of those at the bottom of the income pile were still stuck there four years later; by the early
2010s that had fallen to a bit more than four out of ten. This was the biggest fall in immobility
among those on the lowest incomes in the whole OECD. It was only partly to do with education: the
introduction of a national minimum wage and tax credits for lower income families with children are
also cited. But all these policies were interlocking and investment and reform in education were
critical elements.

                                                                                                      4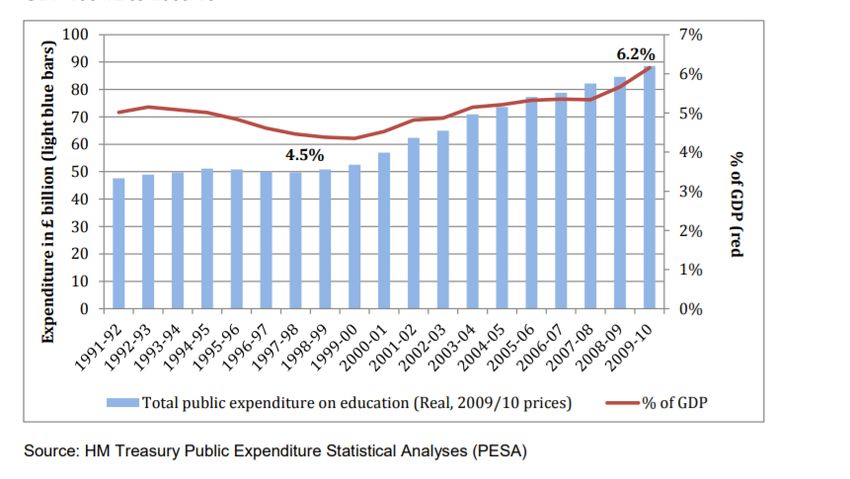
5

The transformation of education under the 1997 government was the result of prioritisation, tough
choices and bold reform, all focused on raising standards and extending opportunities.

The decision to prioritise education was the essential underpinning. Without this prioritisation,
education would have got little of the new resources, legislative change or reformist energy so
essential to the progress made after 1997.

There was nothing inevitable about this prioritisation of education, even by a Labour government.
Neither the Labour governments of Attlee (1945-51) nor Wilson and Callaghan (1964-70 and 1974-
79) had prioritised education either for investment or reform, beyond the introduction of
comprehensive secondary schools in the 1960s and 1970s, a reform largely driven by local
authorities with far too little public investment or real reform. Most of these ‘new’ comprehensives
were in reality the old low grade ‘secondary modern’ schools with new names but an unchanged
ethos of low achievement and aspiration, and high levels of drop out. This is why the first generation
of comprehensives largely failed to drive up educational standards and social change. Incredibly in
retrospect, the biggest education policy decision made by the Wilson government was to delay the
raising of the school leaving age from 15 to 16 because of public spending cuts. When Jim Callaghan,
Harold Wilson’s successor, made his ‘great education speech’ at Ruskin College, Oxford in 1976 it
was thought extraordinary that a prime minister should even make a speech about state education,
since it hadn’t been done by any previous post-war prime minister. Yet Callaghan’s tentative
remarks about the need to raise school standards and promote more and better vocational
education and training, although correct, led to little action either by his government or the
Thatcher government which followed.

The tough choice of the 1997-2010 government was to make education – rather than broader
welfare spending or tax cuts – the national budgetary priority, alongside the NHS, and to make
higher education in particular a legislative priority in order to introduce a new public-private
settlement upon which basis it was possible to radically expand and improve England’s universities.

Legislatively, the single most controversial reform enacted in any sphere by the 1997-2010
government was the Higher Education Act of 2004, introducing a new system of student fees of
£3,000 a year repayable through the tax system after graduation according to ability to pay. Our
reform drew on analysis of Australia’s path-breaking Higher Education Contributions Scheme,
introduced by Bob Hawke’s Labor government in 1989, which lay behind the remarkable rise of
Australia’s universities as world-class institutions in the 1990s. At the time, many of our Labour
colleagues in government and parliament were opposed, including some who agreed that the
reform was highly progressive but thought it politically ‘too hot to handle’. This made it difficult to
proceed because the Opposition parties were also opposed (albeit opportunistically: one of their
first acts on taking power in coalition in 2010 was to treble the fees to £9,000 a year and also to
treble the interest rate on student loans). We nonetheless decided to attempt the reform, despite
the real possibility of defeat – the government’s parliamentary majority fell from its normal 154 to
just five on the introduction of the Bill – because of the imperative, as we saw it, to promote higher
education as a key part of ‘education, education, education’.

The Higher Education Act made it possible to expand significantly the number of university places
towards a goal we set of half of all young people going on to university – a goal which, like the
introduction of tuition fees, was as controversial as it was correct and essential. The reform also
boosted the national research base and regional economies. Universities are critical engines of
growth, civic pride and social mobility, and among the most important regional institutions for
‘levelling up’ nationwide, in today’s catch phrase. The concurrent increased public investment in
medical and scientific research after 1997 further boosted higher education.

However, most of the 1997 government’s ‘investment and reform’ in education focused on the state
school system, which for the most part required not legislation but rather bold governmental

                                                                                                          5
6

leadership, in collaboration with the most dynamic leaders in the education system. For example, Sir
Kevan Collins, who has just resigned as Education Recovery Commissioner, was national director of
the 1997 government’s National Literacy Strategy. He was one of our most valued educational
reformers, leading a transformation in the teaching of basics in primary schools. His work went hand
in hand with a significant cut in primary school class sizes for 5, 6 and 7 year-olds as one of the
government’s first reforms. Equally vital in early years education was the 1997 government’s
foundation of a nationwide under-fives sector, and a more intensive ‘Surestart’ programme for
under-fives in deprived areas, which turned most primary schools into primary and under-fives
institutions. This was another fundamental – and expensive but necessary – reform, learning from
Scandinavian experience of the social and economic benefits of state-provided early years services
allied to schools.

On secondary education, our focus was on eliminating failing comprehensive schools and systematic
underperformance and drop-out. This required programmes to transform the quality of leadership
and organisation and to improve teacher recruitment, of which the four boldest were:

    •   Academies, to completely re-found 400 of the worst performing comprehensives and
        replace them with independently managed all-ability state secondary schools with state-of-
        the-art facilities.

    •   London Challenge, a government-led programme to tackle underperformance
        systematically across England’s largest city, including enhanced support for headteachers
        and school leadership and special incentives to recruit more and better teachers, particularly
        in shortage maths and science specialisms.

    •   Teach First to recruit a new generation of the brightest and best university graduates into
        state school teaching in the toughest areas, starting in London, modelled on the American
        ‘Teach for America’ scheme founded in 1989.

    •   Building Schools for the Future, a programme to rebuild and transform school facilities
        nationwide, including facilities for sports, arts and IT, starting with England’s 3,400
        secondary schools, made possible by an annual school capital budget increased from £700m
        in 1997 to £8,000m by 2010.

In today’s jargon, this was all about ‘levelling up’.

London was the first, in some cases prime, focus of these reforms and investment in secondary
education. Partly this was partly because of its size and the sheer number of pupils previously being
failed by its disproportionately large number of underperforming comprehensive schools. Partly also
it was because London had for decades been a by-word for failure in state education, particularly
under the previous Inner London Education Authority. We believed that if we could ‘crack’ London’s
state school challenge, this would serve as an example and a model for doing so in England’s other
English cities and large towns with similar problems. Such was indeed our policy in the last years of
the government. Programmes modelled on the London Challenge were launched in Greater
Manchester and the Black Country in 2008, and the intention was to intensify these and to extend
them further to other conurbations. (Instead they were abolished by the coalition government after
2010, as was London Challenge.)

It is significant, therefore, that London saw by far the fastest rate of improvement and success in
educational reform after 1997. London’s local education authorities were transformed from the
some of the worst performing to the best performing authorities nationally. Ofsted’s 2010 report on
the London Challenge found that 30% of London’s state secondary schools were judged to be
outstanding. Of the 34 academies in London to have been inspected by then, eight were judged

                                                                                                      6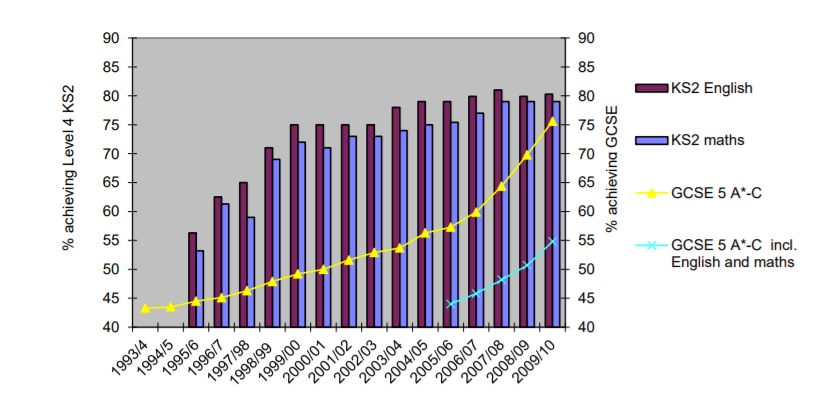
7

outstanding, a remarkable record given the failing schools they had only recently replaced, mostly
with the pupils transferred from the previous failing school. A similar proportion of all inspected
academies nationwide (84) were judged to be outstanding. On attainment, more than 60% of
London pupils were attaining five or more good GCSE passes by 2010, up from just 11% in 1987, and
pupils in the capital were doing better than the rest of the country. In a subsequent 2013 report,
Ofsted concluded that ‘one of the key drivers behind the sustained improvement in London schools
was the success of the London Challenge programme’. It is notable too that in the last (2020) annual
report of Her Majesty’s Chief Inspector of Schools, the proportion of schools in London requiring
special measures or serious improvement is the lowest of any region and half that in most of the rest
of England.

To elaborate on key data, Figure 2 shows that standards rose nationwide across the tenure of the
1997 government, but far faster in London:

Figure 2: Percent of Pupils Eligible for FSM who Achieve Eight or More GCSEs at A*-B Including
English and maths (or equivalent) by region, 2002-2012

As for spending (Fig 3), in 1997 UK education was below OECD average as a percentage of GDP
devoted to education (4.5%), with virtually no real-terms growth over the 18 years of Conservative
government under Margaret Thatcher and John Major. In sharp contrast, after 1997 spending on
education increased by 4.2% a year on average, and by 2010 had reached 6.2%, close to the OECD
average. The fastest growth was in capital spending, which grew by 12.9% a year.

Figure 3: Total Public Expenditure on Education (UK) in Real Terms as a Percentage of GDP
1991/1992 to 2009/2010

                                                                                                     7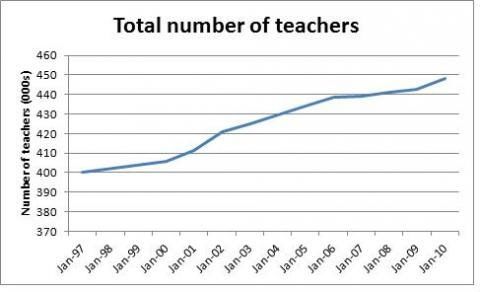
8

                                                                                           1

The impact of the 1997 government’s student finance reforms is brought out in Figure 4. By
introducing repayable loans for fees, it was possible to expand higher education substantially and
equitably while maintaining state spending broadly static in real terms, which enabled extra state
investment to be focused on school-age children and under-fives in state schools, where there was
obviously no question of private contributions. The net effect of these reforms, together with the
substantial real-terms increase in research funding for universities – mainly to strengthen the
science base – was to treble public and private spending on state schools and universities in real
terms, the fastest rate of growth in spending and investment in education in modern times.

On early years and under-fives, between 1997 and 2008/9 spending on early education, including a
free entitlement to education for three- and four-year-olds, grew from £0.9bn to £2.37bn.
Investment in Sure Start, focused on the most deprived families and communities, grew from £5m in
1997 to £1.4bn in 2006. Child-related benefits increased by 60% between 1997 and 2005. Tackling
child poverty was a central part of ‘education, education, education’, and the combined effect of
these educational, childcare and welfare measures was to lift one million children out of poverty.

Figure 4: Total Public Expenditure on Different Tiers of Education 1997/1998 to 2008/2009

                                                                                                     8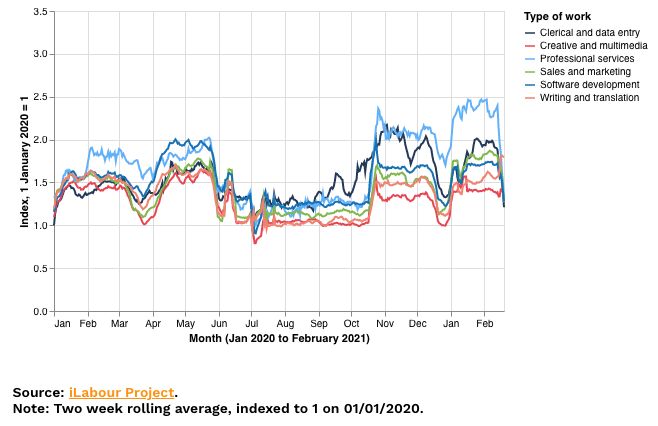
9

                                                                                                                                                                           2

The positive impact of our higher education policies is brought out in Fig 5, which shows the
dramatic rise in student numbers and participation after 1996. Both the number of applicants, and
the number accepted onto courses, rose by more than two-thirds.

Figure 5: University applications and acceptances 1994-2010

2 http://eprints.lse.ac.uk/51214/1/__libfile_REPOSITORY_Content_CASE_CASE%20Social%20policy%20in%20a%20cold%20climate%20series_Working%20papers_spccwp03_full%20text.pdf

                                                                                                                                                                               9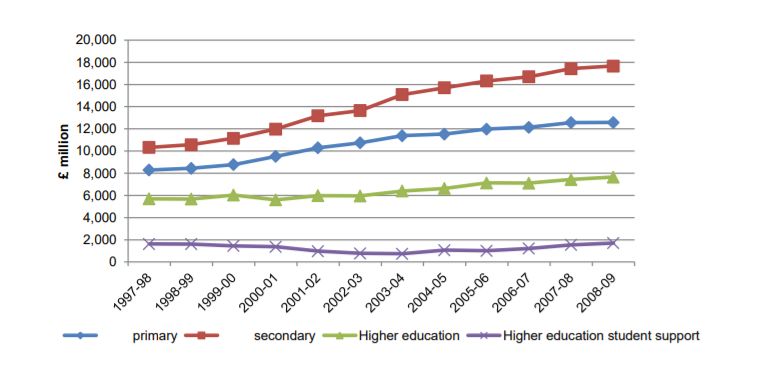
10

In terms of workforce, Fig 6 shows the transformation in teacher numbers between 1997 and 2010:
a more than 10 per cent increase, enabling smaller class sizes as well as better teaching in a wider
range of subjects. In primary schools the pupil:teacher ratio declined from 24:1 in 1998 to under
22:1 by 2010, from 19:1 to 16:1 in nursey education, and from 17:1 to 16:1 in secondary schools.
Larger still was the increase in the number of support staff and of teaching assistants, whose
numbers tripled between 1997 and 2010.

Figure 6: The teacher workforce 1997-2010

                                                                                                                          3

Figure 7 gives the detailed data on test and exam improvement between 1997 and 2010. 4

Figure 7: Percentage Achieving Expected Levels at Key Stage 2 and GCSE 1993/1994 to 2009/2010

On further education, the introduction of the Educational Maintenance Allowance – a participation
allowance paid to students from low income families – helped increase participation rates for 16 to

3   https://fullfact.org/news/did-teacher-numbers-increase-42000-under-labour/
4
    http://eprints.lse.ac.uk/51214/1/__libfile_REPOSITORY_Content_CASE_CASE%20Social%20policy%20in%20a%20cold%20climate%20series_Working%20papers_spccwp03_full%20text.pdf

                                                                                                                                                                             10
11
18 years old, and new vocational qualifications were introduced. In retrospect we failed to move
early or strongly enough on the reform of further education, although spending on the sector rose in
line with spending on state schools. To our mind there is a big lesson here: investment and reform
must go hand in hand as it did on schools and universities. Investment is a necessary but not a
sufficient condition for transformation of an underfunded and underperforming public service.
The obverse is true too: reform without investment, in an underfunded and underperforming public
service, benefits only the few not the many. This was our considered analysis of the reforms of the
later years of the Thatcher/Major government where, particularly under the education
secretaryships of Kenneth Baker (1986-89) and Kenneth Clarke (1990-92), some important and well-
judged state school reforms were begun, including the introduction of the national curriculum, city
technology colleges, Ofsted, national testing in literacy and numeracy, and the Technical and
Vocational Education Initiative. These inspired key reforms of the 1997 government, and we were
perfectly happy to say so publicly at the time in a quest for cross-party consensus. But reforms which
require significant areas of new provision require new investment alongside – as demonstrated in
the private school sector, whose fees rose sharply in the 1980s and 1990s as private schools sought
to reduce their class sizes, improved the quality of their teaching, and transform their facilities. It
was clear to us that if the English upper and upper middle classes were prepared to pay a good deal
more for private education before 1997, then, with a credible reform plan and national leadership,
the English electorate at large could be persuaded to invest more in a transformation of the state
education system on which they depended vitally for the life chances of their children. And so it
proved.
Education since 2010
The full significance and impact of our ‘education, education, education’ strategy of investment and
reform focused on standards only became apparent, even to us, when in 2010 the coalition
government took office with two very different big ideas: austerity, and an assertion of cultural
divisions and elitism by initiating controversies about the school curriculum, the grading of exams,
and ‘free speech’ in universities.
Not all the reform impetus of the 2000s was lost, not least because of the lasting impact of
improvements to the quality of leadership and teaching across the state education. This accounts for
the welcome continued increase – until a plateau was reached in 2018 – in the number of schools
rated good or outstanding by Ofsted, which is a function particularly of an enduring improvement in
school leadership and governance which had taken root.
But Ofsted reports show that inadequate average standards of pupil performance, and the long tail
of under-achievement, have persisted, particularly outside London and the south-east of England.
There were the deep cuts in the state education budget after 2010, and equally damaging has been
the decision by Michael Gove and Dominic Cummings – the driving forces behind education policy
after 2010 – to launch a battle with what they called ‘the blob’, their derogatory term for the
collective leadership of the state education system. It is a cultural war which continues to the
present day. In the current 2021 session of parliament the major piece of education legislation is the
Higher Education (Freedom of Speech) Bill: a reform in search of a problem since free speech is
hardly a key issue on university campuses, least of all after a year when they have been virtually
closed and still not open fully. It is a distraction from the obviously colossal job of educational
reconstruction after COVID19.
1112
To our great regret, after 2010 the coalition government systematically dismantled the 1997
government’s education reform programme in every key respect except the new regime for
university tuition fees – these it trebled, which we would not have done (in 2012 53% of students
across the UK thought university was "good" or "very good" value for money; by 2017 this had
slumped to just 35%).
The Building Schools for the Future programme was abolished; Surestart centres were closed; the
focus of the Academies programme on levelling-up and deprived areas was removed, along with its
capital investment funding; and the specialist schools programme – a key reform programme of
comprehensive schools to endow them with specialist centres of excellence – was also abolished.
The London Challenge, the Greater Manchester Challenge and the Black Country Challenge were
ended. The Joseph Rowntree Foundation reported in 2014 that Manchester and the Black Country
had not progressed as well as London "in part because [these City Challenge areas] had less time for
these practices to properly embed." In some cases, lip service was paid to the work before 2010, but
there was little continuity in practice.
Just as standards-based reform was largely dissipated or ended after 2010, so was the investment.
Even within the coalition government’s changed overall fiscal framework, there was a deliberate
choice made not to prioritise education. A massive cut was made immediately in school capital
spending – reduced from £8bn to just £3.3 billion within three years, and cut further thereafter –
while the rate of growth in state school revenue funding was reduced to zero in real terms. Cuts
became greater over time: in 2015 the re-elected Cameron government only committed to
maintaining education spending in cash terms, so most state schools had their budgets cut in real-
terms, year on year, for the first time since 1997, by when most of them had lost any previously
indicated capital spending.
School spending per pupil in England fell by nine per cent in real terms between 2009/10 and
2019/20 (see Fig 8). This was the largest cut in over 40 years and it followed a period of significant
increase in spending per pupil of over 60 per cent during the early 2000s. The implications of these
spending cuts had ramifications for many aspects of education in England, especially teaching staff
and class size.
Figure 8: UK Education Spending, 1955/1956 to 2018/2019 (2020/2021 prices)
1213
[insert source below chart] 5
The only significant new programme of spending by the coalition government after 2010 was on
‘free schools’. Legally these were similar to academies as independently managed state schools, but
the focus of the free schools programme was not on deprived areas, and was only partially even on
areas which required new school places, so it largely lost the levelling-up dynamic of the previous
Academies programme. The 2010 government allowed almost all state schools to become
academies in legal status, but mostly these new ‘academies’ lacked external sponsors or funding,
and they generally made relatively little difference to school standards – whereas independent
assessments by the National Audit Office and the LSE in 2010 and 2011 respectively attested to the
success of the previous Academies programme in levelling-up.
Since 2010 teacher numbers have fallen while pupil numbers have increased. In consequence (Fig 9)
the ratio of qualified teachers to pupils has increased from 17.8 in 2011 to 19.1 in 2019. 6 In addition,
the number of full-time teacher vacancies and temporarily filled posts have both also risen over this
period. 7
Figure 9: Secondary Teacher/Pupil Numbers Compared to 2010/2011 Level
5 https://ifs.org.uk/uploads/R183-2020-annual-report-on-education-spending-in-England%20%281%29.pdf
6 file:///C:/Users/b.miller/Downloads/CBP-7222.pdf
7 file:///C:/Users/b.miller/Downloads/CBP-7222.pdf
1314
In 2019, the UK had the biggest primary school class size in the developed world for the first time
ever, according to the OECD, while secondary class sizes were above the OECD average. 8 In 2019, a
National Education Union analysis of class sizes in England between 2010-2019, based on
government data, showed that 474 out of 533 England constituencies had seen an increase in
average class size since 2010, with almost a million pupils in classes of 31 or more, up from 747,531
in 2010 (a 29% increase). 9 By 2019 63,566 primary schools pupils were in classes of 36 or more, up
from 44,093 in 2010 (a 44% rise), and a 258% rise in the number of secondary pupils in classes of 36
or more (up from 6,107 to 21,843).10
The Coalition government initially pledged to focus resources and reform on skills, which we
welcomed, in part as a self-critical reflection on the continued weakness of vocational education and
our failure to do more to tackle this before 2010. The 2011 Wolf Review of Vocational Education
focused on literacy and numeracy and improving qualifications. The 2012 Richard Review focused on
apprenticeships and reforms to raise standards and increase numbers. The 2015 Conservative Party
election manifesto committed to delivering 3 million apprenticeship starts between 2015 and 2020.
Unfortunately these plans and promises have come to little. Total spending on adult skills, which had
been broadly constant in real terms between 2002–03 and 2009–10 (at just over £4 billion in 2018–
19 prices) fell by about 45% in real terms between 2009–10 and 2017–18 (see Fig 10). There were
particularly severe cuts to Further Education colleges, where most non-workplace instruction is
carried out.
Figure 10: Total Spending on Adult Education and Skills, 2002/2003 to 2018/2019
8 https://www.oecd-ilibrary.org/docserver/69096873-
en.pdf?expires=1619089474&id=id&accname=guest&checksum=76BF182E135817412533A50D96CB1FBF
9 https://neu.org.uk/press-releases/class-sizes
10 https://www.bbc.co.uk/news/education-46180290
1415
Source: ‘Annual report on Education Spending in England 2018.’ Institute for Fiscal Studies.
On apprenticeships, an Apprentice Levy was devised, obliging large employers (those with an annual
pay bill over £3m) to pay 0.5% of this into a pot, to be topped up by the government and used to
fund apprenticeships available to firms of all sizes. Degree apprenticeships, which combine paid
work and HE study, were launched in 2015. The rationale was to put employers in the ‘driving seat’
as a way of getting them to commit more seriously to training and encourage coordination over
standards and sectoral skills needs. George Osborne, in his 2015 Budget speech, claimed the Levy
would mean ‘Britain’s great businesses training up the next generation’.
Alas, these objectives have not even begun to be realised. The introduction of the Levy was
accompanied by a fall in the public subsidy that was not replaced by an increase in private sector
funding. Apprenticeship starts fell by about 20% immediately following the Levy’s introduction in
2017 and have not recovered (Fig 11).
Figure 11: Apprenticeship Starts in England (in thousands), 2014/2015 to 2019/2020
1516
Source: HofC Library/DofE
Also noteworthy (Fig 12) has been a sharp fall in the numbers of people doing Intermediate and
Advanced Level apprenticeships, only partially offset by a small rise in the numbers doing Higher
Levels. There were also slight shifts towards the public and services sectors and away from
construction and manufacturing (two economic sectors noted for their skills shortages). As for
regional effects (Fig 13), the deprived regions of the Northeast, Northwest and Midlands have seen
the largest percentage drops in starts, while London and the Southeast have seen the smallest falls.
Fig 12: Apprenticeship starts 2014-2019
Source: DofE, TBI calculations
Fig 13: Decline in apprenticeship starts by region 2014-2019
Source: DofE, TBI calculations
The effect of the Apprenticeship Levy has been the opposite of its launch publicity and stated
intention. It has reduced the amount of apprenticeship training overall, and shifted the balance of
the remainder towards higher level apprenticeships in the service and public sectors, increasingly
concentrated geographically in the southeast of England. This may better reflect the revealed
preferences of employers now that they have more ‘skin in the game’, in that they now contribute
much more financially via the Levy. But it is arguably bad for social mobility and the long-term
1617
prospects of lower productivity sectors of the economy. There was a further fall in apprenticeship
numbers in 2019/20. Apprenticeship starts last year were at their lowest level in ten years. Covid
has made this worse; in the first two quarters of the 2020/21 academic year (August 2020 to January
2021), there were 161,900 apprenticeship starts. This was a drop of 18% from the same period in
2019/20, with 36,700 fewer starts. The Boris Johnson government has responded with yet another
White Paper, ‘Skills for Jobs’, which promises extra funding, alternative traineeships and a ‘Lifelong
Learning Guarantee’. But it is unclear where the drive, funding or reform will come from to deliver
any of its aspirations.
COVID19 has turned this educational slow-down into a fully-fledged crisis. By February half-term of
this year, the total loss in face-to-face schooling time amounted to around half a normal school year
for children across the UK. This estimate does not account for the lower-than-normal attendance
rates in the 2020 autumn term, especially in disadvantaged areas. Sir Kevan Collins’ ‘catch up’ report
of June 2021 highlights widening attainment gaps, record numbers of students not reaching the
standard for their age in literacy and numeracy, and a significant proportion of pupils, mainly from
lower income family families, who have lost a significant part of their scheduled learning over the
past 15 months. Fig 14 is just one of many illustrations of the serious impact of these developments.
Figure 14: Covid-19 and Widening Attainment Gaps
An ‘Education 2030 Plan’
Returning to ‘education, education, education’ is now imperative. It requires a new government
commitment to a long-term standards-based programme of investment and reform. There should be
an ‘Education 2030 Plan’ setting this out, including bold ambitions for change and improvement
funded by progress towards restoring the investment levels of the 2000s, with substantial above
inflation increases in funding for schools each year and a capital programme to complete the
Building Schools for the Future plan begun in 2000.
1718
In primary education, renewed National Literacy and Numeracy Strategies are essential, focusing on
catch-up in the basics in the light of COVID19, including individual tuition as appropriate. It is also
essential to revitalise the ambition behind Sure Start. Some Sure Start centres remain but their
coverage is very patchy, with 1000 having closed since 2010. Full ‘wrap around’ child and parental
support is needed for the youngest children in the most deprived areas.
On secondary education, a similar focus on basic skills and catch-up is required, including personal
tuition and a longer school day as proposed in the full Kevan Collins report and £15bn catch-up plan.
A sensible move would be to ask Sir Kevan Collins whether he would be prepared lead these
renewed National Literacy and Numeracy Strategies. However, the recovery plan should include – as
Sir Kevan proposes – support for school sport, the arts and the wider curriculum, which have
unavoidably suffered even more seriously than the core curriculum for most teenagers during the
two national COVID19 lockdowns.
It is vital to focus attention on narrowing attainment gaps in order to ‘level up’, and this should be
the priority of these numeracy and literacy strategies. The academies programme should once again
be focused on low performing schools and areas, in state funding and leadership. A renewed focus
on headteacher, teacher and leadership training is also required. The National College for School
Leadership, which we established at Nottingham University 2000 but has since withered, should be
given a renewed mission to lead a national network of training school leaders for the most
challenging schools and communities.
It is equally vital that the Education 2030 Plan contains a coherent and ambitious plan for place-
based leadership and investment and strategies to level-up, on the model of the London Challenge.
The absence of such place-based education strategies since 2010 is in our view a significant part of
the reason why the ‘left behind’ sentiment has taken such a strong hold of many of the less
advantaged parts of the country in the past decade.
The present government clearly recognises this because in 2017, having previously dismantled our
successful place-based initiatives, they re-introduced a more modest scheme of ‘opportunity areas’.
Twelve such areas were identified, including Stoke, Bradford, Ipswich and Oldham, for a three-year
support programme for school leadership and levelling-up, including support for children in the early
years. The areas were recently extended for a fourth year. The Education Department recently
published data on the success of these 12 opportunity areas, suggesting that Key Stage 2 (age 11)
attainment improved between 2016 and 2019 by more than the national rate in 10 out of the 12
areas, including a 11.8% rise in maths outcomes at Key Stage 2, 2.9% higher than the increase in
England overall and higher than in most neighbouring local authorities.
However, this being true, it begs the question as to why there are only 12 ‘opportunity areas’ areas
covering a tiny fraction even of local authorities in deprived areas, as opposed to the whole
conurbations covered by the London, Greater Manchester and Black Country ‘challenge’
programmes of the 1997 government. We would suggest the need for such conurbation and
county-wide strategies, including Greater Manchester, the West Midlands, Teesside and
Humberside. This would increase the coverage from 12 to perhaps 100 local authority districts, and
these expanded ‘opportunity areas’, with local leadership and national support, should be intended
to last for ten years – the whole duration of the 2030 strategy – not just three years as now. We
have benefited from dialogue on this issue with Sir Martin Narey, the former head of Barnardos and
Director-General of the Prison Service, who is chairing the board of the North Yorkshire Coast
Opportunity Area, and we would suggest that he is asked to recommend a national strategy for new
place-based interventions as part of a 2030 plan.
1819
According to Ofsted’s 2020 annual report, the regions with the highest combined percentage of
schools that ‘require improvement’ or are ‘inadequate’ are the South West (18%), the East Midlands
(17%) and the West Midlands (17%). Despite this, each of these three regions only has one
‘opportunity area’ covering just one local authority district. This clearly does not measure up to the
scale of the challenge to level-up and break cycles of educational disadvantage and failure. At
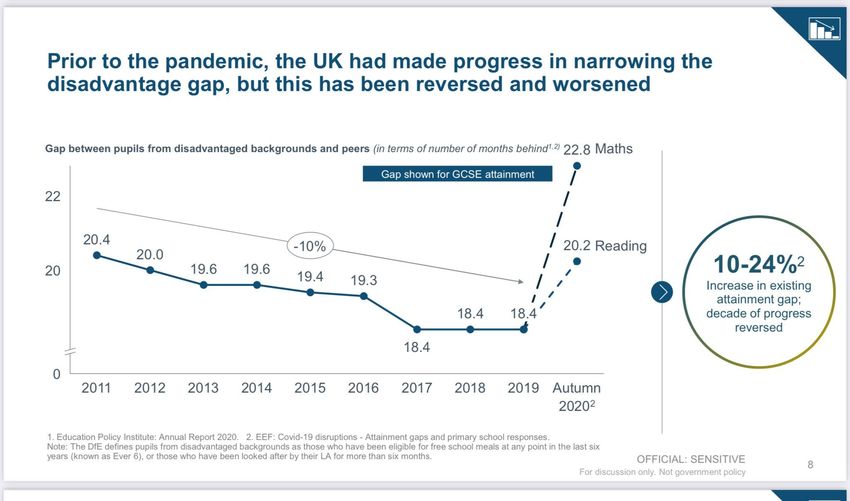
secondary school, by the time they take their GCSEs, disadvantaged pupils are over 18.1 months of
learning behind their peers, the same as it was five years ago, and since the COVID19 lockdowns this
situation will almost certainly have worsened. It is particularly notable that Ofsted reports that a
significantly higher proportion of schools with the least deprived intakes were judged good or
outstanding than those with the most deprived intakes (see Fig 15):
Fig 15: Schools in the most deprived areas are faring worst by a large margin
A 2030 Education Plan also needs a strategy for teacher retention and recruitment. Since 2011, the
overall number of teachers in general has not kept pace with increasing pupil numbers. This means
the ratio of qualified teachers to pupils has increased from 17.8 in 2011 to 19.1 in 2019. TALIS, the
five yearly international, large scale survey of teachers administered by the OECD, found that full
time lower secondary teachers in England reported working, on average, 49.3 hours a week. This
was above the OECD average of 41 hours a week. The equivalent figure in 2013 was 48.2 hours a
week. Full time primary teachers in England reported working 52.1 hours a week, which is more than
any other participating country except Japan. Moreover, each cohort of newly qualified teachers
since 2010 has seen a larger share of teachers leave within three years than the one before. Of those
who entered the profession in 2015/16, 27% left within three years, compared with 22% of those
who entered in 2010/11.
In our view, these imperatives to improve teaching and learning, level-up and catch up, are more
important than yet more arbitrary changes to existing assessment and curriculum arrangements, let
alone attempts at waging educational culture wars as per the current Higher Education Freedom of
Speech Bill.
Delivering on the objectives of the Apprenticeship Levy to transform the quality and supply of
apprenticeships, including for school-leavers, ought to be another priority of the 2030 Education
Plan. Further Education colleges should be focused on transforming the quality of apprenticeship
learning and supply and wider vocational education, with more centres of excellence and stronger
links with companies in key sectors vital to the locality and region of each college. Even the title
‘general further education college’ begets low status and lack of focus. We would recommend
consideration of a programme of ‘promoting’ these general colleges to the status of ‘polytechnics’ –
a title lost to the education system since the original generation of polytechnics became universities
1920
in the 1990s – based on reaching excellence in the strength of their vocational centres of excellence
and the quality of their teaching and learning, up to and including degree-level apprenticeships. This
would help raise the status as well as the quality of vocational education. We need pathways to
careers and prosperity as strong for those who don’t go to university as for those who do – ‘the
other 50%’ as they are sometimes called – and this should be a key ambition for the next decade.
However, it would be wrong, as many now suggest, to soft-peddle – let alone seek to reverse – the
expansion of higher education, and universities should feature prominently in an Education 2030
Plan. In 1999, we set a target of 50% of young people attending university. Although controversial at
the time, this goal has now been met, helped not hindered by the 2004 fees reform which made
possible an expansion of university places, and we need to seek to expand further on the basis of
courses which students perceive to be valuable, including degree level apprenticeships. High levels
of university participation is one of the defining characteristics of advanced economies: just a 1.42%
increase in university-educated graduates correlating to an extra $1,747 in GDP per capita.
The same dynamic of universities driving growth holds at the sub-national level too, where a 10%
increase in the number of universities in a region is associated with 0.4% higher GDP per person. In
the UK’s recent experience, we can look to the example of the highly successful Falmouth University,
which we created in government, which became Cornwall’s first (and still only) university with a
focus on the creative industries growing out of the pre-existing Falmouth School of Art. Since
becoming a university in 2005, Falmouth has tripled its student numbers to over 6,000, supporting
over 2,000 jobs in Cornwall. It is now estimated to add £100m p.a. in Gross Added Value to the local
economy and is now one of Cornwall’s flagship institutions with an international reputation. It
boasts a 96% employment rate and four times the number of self-employed graduates compared to
UK average – graduates who can remain in Cornwall after finishing their studies.
The ‘Falmouth model’ should be extended across the UK, especially to larger towns which currently
lack higher education institutions and their vital economic and social benefits. This has a key part to
play in the levelling-up agenda and a place-based approach to educational regeneration which has
been too neglected in the past. Universities can and do serve as hubs of local development,
contributing to town centre regeneration, creating local jobs, partnering with schools, local
government, and the NHS. Initiatives such as the Civic University Network are driving a resurgence in
the place-based agenda in higher education, and as their research shows, 59% of respondents
nationally want universities to play a more active local role, rating their contribution more highly
compared to, for example, local government. The same research suggests such impacts rarely
extends beyond the city or town where the university is based.
There are 46 towns in England with a population of over 80,000 which still, in 2021, have no
university of their own, including large and economically disadvantaged towns such as Hartlepool,
Doncaster, Batley and Blackpool. We would wish to see an Education 2030 Plan prioritise the
establishment of universities in these towns, embracing as appropriate existing higher education
provision. They should have a particular focus on applied as well as technical skills and core
competencies for the 21st century.
2021
At all levels of education, the Education 2030 Plan is a golden opportunity to harness technology,
learning from the best IT experience of the COVID19 pandemic, and this should be at the centre of
the next generation of investment and reform. Computerisation is hollowing out intermediate skilled
jobs, creating a divided ‘hourglass’ workforce with high-skilled, high-paid jobs at one end and
insecure low-paid occupations at the other. With the well attested threat of automation and the
growing demand for cognitive and digital skills, this trend will continue, and the education system
must help learners acquire skills required for well paid jobs (see Fig 16). Nearly half (48%) of
employees in the UK say they want digital training, but this figure increases to two thirds (67%) in
18-34 year olds. Latest research from the OECD shows that in the UK 13.7% of workers are in
occupations at high risk of automation. The rapidly evolving digital landscape is expected to affect
more than a third (37%) of workplace roles, the equivalent of up to 12 million employees in the UK.
Fig 16: Skills needs in today’s economy
Source: Open University
The rapid growth of the gig economy, characterised by short term contracts or freelance work and
underpinned by digital labour marketplaces, is adding to this pressure (see Fig 17). The number of
working age adults who had worked for an online platform for at least once a week more than
doubled between 2016 and 2019, to 4.7 million workers. Much of this increase came from workers
with university degrees. This highly skilled, often remote work breaks down traditional geographical
barriers, leading workers to compete for employment on the global labour market as well as the
domestic one. Maintaining competitiveness requires mastery of key cognitive and non-cognitive
skills like problem solving, adaptability, resilience and communication, which in the traditional
education system are underestimated and undertaught. For workers at the other end of the
‘hourglass’, the same skills will be core to making the most of the flexibility that distinguishes the
lower-paid contingent work we tend to think of in the gig economy context. Our understanding of
what quality education looks like must change to encompass, alongside knowledge, opportunities to
develop digital and cognitive skills for the new economy. There are signs of progress in the UK, such
as the phased introduction of the new Curriculum for Wales, which aims to create a more flexible
and skills-focused system. The renewed education system must, however, achieve this impact across
the whole of the UK, and here, too, there are significant challenges to consider.
2122
Figure 17: Digital Gig Economy Work in 2020
Source: iLabour Project
There are now 10.5% more pupils in mainstream state primary and secondary schools than there
were in 2009/2010, but in secondary schools the pupil-teacher ratio has fallen to 16:1, compared to
15:1 in 2014/2015. At the same time, school spending per pupil in England fell by 9% in real terms
between 2009-10 and 2019-20 which represents the largest cut in over 40 years. Part of the answer
should be a funding increase, but technology also has a role to play. Global experience shows that
technology, used well, can prove invaluable in marrying quality with scale. For example, over the
past decade the US has been a leader in the development and implementation of education
technology software (edtech) in schools. In the past five years alone, US edtech companies raised
more than $7.5b in venture capital. The investor interest is driven at least partly by the local US
market’s willingness to invest in technology, with the average school district spending $4.4m p.a. (or
over $150 per student) on digital curriculum resources. As a recent analysis of PISA data shows, this
greater level of familiarity with edtech in North America seems to lead to better academic
performance. Another useful point of reference is Estonia: the famously tech-forward nation has
made rapid progress in PISA scores, now ranking top among European countries. Its focus on digital
skills and integration of technology in education provision and parent-teacher communication is
seen as a major contributor to this result.
This lack of progress over the last decade has been recognised by the Department for Education in
its 2019 edtech strategy, which proposed a strictly incrementalist approach to tackling the
technology deficit. As the disruptive impact of the Covid pandemic has underlined, a far more
ambitious approach is needed. Covid revealed a broad disparity between a small number of schools
prepared for the emergency shift to remote teaching, especially in the independent sector, and the
rest of the country. To catch up and get ahead again, a radical programme of reform is needed,
digital pedagogy as part of initial teacher training, radical reform of assessment of student
progression tailored to the individual, and better tailored programmes for students particularly
beyond the age of 16.
This leads to a final major proposal by us for the 2030 Education Plan. We have the national
capability to build a digital online library of explanations of hard to understand concepts and
exercises, embracing the latest debates and most able presenters and explainers, helping students
to develop their talents and interests to the full, including the most able. The government should
commission an independent body to build a British 'Khan Academy'
2223
(https://www.khanacademy.org/). We have the capacity and creativity to do something even better
than the Khan Academy, which could be sold to richer countries and made available free to
developing countries, maybe with the BBC as a portal. This ‘British Online Academy’ would help put
digital skills at the heart of the curriculum and promote high quality individualised learning as well as
teacher education. It could be immensely exciting and path-breaking in the next generation of
teaching and learning.
‘Your education today is your economy tomorrow’, says Andreas Schleicher. That should be the
epigram for the 2030 Education Plan, and we look forward to discussing these ideas with The Times
Education Commission in your important work to restore national momentum in the cause of
‘education, education, education’.
23You can also read