Environment: Access to natural environment
←
→
Page content transcription
If your browser does not render page correctly, please read the page content below
Environment: Access to natural environment
Downloaded from https://www.canterburywellbeing.org.nz/our-wellbeing/environment/access-to-natural-environment/ on 08/08/2021 6:06 PM

Access to natural environments can buffer stress [4], and visits to public conservation areas can improve mental health and
wellbeing [5]. This indicator is based on the Canterbury Wellbeing Survey’s ‘access to the natural environment’ question, that
broadly defines the natural environment as “rivers, lakes, beaches, wildlife, areas, parks, and walking tracks” [25].

This indicator presents the proportion of those 18 years and over satisfied or very satisfied with their ease of access to the
natural environment.

The figure shows that more than eighty percent of greater Christchurch residents expressed satisfaction with their ease of
access to the natural environment in 2017, 2018 and 2019 (80.8%, 80.1%, and 84.1%, respectively).

                                                                                © Crown copyright 2021 Printed on: 08/08/2021 Page: 1/8
Breakdown by Territorial Authority
The figure shows a slight shift in the proportion of respondents, satisfied or very satisfied with their ease of access to the natural
environment, by Territorial Authority, between 2017 and 2019. In 2018, a statistically significantly higher proportion of
respondents from Waimakariri District were satisfied with their ease of access to the natural environment compared with
Christchurch City residents. However, in 2019, the proportions of respondents, satisfied or very satisfied with their ease of
access to the natural environment, by Territorial Authority have converged and there are no statistically significant differences
between the Territorial Authorities (Christchurch City, 84.1%; Selwyn District, 81.9%; and Waimakariri District 86.4%).
© Crown copyright 2021 Printed on: 08/08/2021 Page: 2/8Breakdown by ethnicity
The figure shows a shift in the proportions of European, Māori, and Pacific/Asian/Indian respondents, who reported being
satisfied or very satisfied with their ease of access to the natural environment, across greater Christchurch from 2017 to 2019.
In 2017, a statistically significantly lower proportion of Pacific/Asian/Indian respondents were satisfied with their ease of access
to the natural environment, compared with both European and Māori respondents.
The 2019 result highlights substantial and statistically significant improvement in Pacific/Asian/Indian respondents’ satisfaction
levels (64% satisfied or very satisfied 2017; 79.3% 2019). The proportions for the Pacific/Asian/Indian, European, and Māori
groups are all statistically similar in 2019.
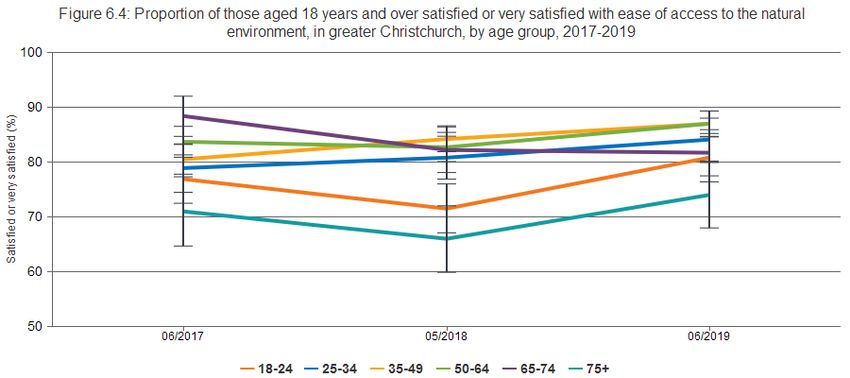
© Crown copyright 2021 Printed on: 08/08/2021 Page: 3/8Breakdown by age
The figure shows that a majority of respondents, across all age groups reported being satisfied or very satisfied with their ease
of access to the natural environment, in greater Christchurch, from 2017 to 2019. The current result indicates that the youngest
age group and the oldest age group are both less satisfied with their access to the natural environment than the middle age
groups (80.8% for the 18–24 years group and 74.0% for the 75+ years group, compared with 87.0% for both the 35–49 and
50–64 years groups). The difference between the oldest age group (least satisfied) and the middle age groups (most satisfied)
is statistically significant.
Breakdown by gender
The figure shows that 78 percent or more of female and male respondents indicated that they were satisfied or very satisfied
with their ease of access to the natural environment in greater Christchurch in 2017, 2018, and 2019 (females 83.2% and males
85.2% in 2019). There are no statistically significant differences by gender at any time-point. The increase in the proportion of
male respondents indicating they were satisfied or very satisfied between 2018 and 2019 is statistically significant.
© Crown copyright 2021 Printed on: 08/08/2021 Page: 4/8Breakdown by income The figure shows some statistically significant differences between income groups in the proportion of respondents who indicated that they were satisfied or very satisfied with their ease of access to the natural environment, from 2017 to 2019. There is a clear pattern of increasing satisfaction with increasing income. In 2019, 91.5 percent of respondents in the $100,000+ annual household income group were satisfied with their ease of access to the natural environment compared with 72.5 percent of respondents in the
Data Sources
Source: Canterbury District Health Board.
Survey/data set: Canterbury Wellbeing Survey to 2019. Access publicly available data from the Community and Public Health (Canterbury DHB)
website www.cph.co.nz/your-health/wellbeing-survey/
Source data frequency: Annually.

Metadata for this indicator is available at https://www.canterburywellbeing.org.nz/our-wellbeing/index-data

                                                                                         © Crown copyright 2021 Printed on: 08/08/2021 Page: 6/8
REFERENCES
This is the full reference list for Environment.
1 Handy SL, Boarnet MG, Ewing R, Killingsworth RE (2002) How the built environment affects physical activity. American Journal of
Preventive Medicine 23: 64-73.
2 Perdue WC, Stone LA, Gostin LO (2003) The Built Environment and Its Relationship to the Public’s Health: The Legal Framework.
American Journal of Public Health 93: 1390-1394.
3 Sallis JF, Spoon C, Cavill N, Engelberg JK, Gebel K, et al. (2015) Co-benefits of designing communities for active living: an exploration of
literature. Int J Behav Nutr Phys Act 12: 30.
4 Björk J, Albin M, Grahn P, Jacobsson H, Ardö J, et al. (2008) Recreational values of the natural environment in relation to neighbourhood
satisfaction, physical activity, obesity and wellbeing. Journal of Epidemiology and Community Health 62: e2.
5 Blaschke P (2013) Health and wellbeing benefits of conservation in New Zealand. Science for Conservation 321.
6 Juan de Dios Ortúzar, Willumsen LG (2011) Modelling Transport. New York: Wiley.
7 CERA (2012) CERA Wellbeing Survey 2012 Report, prepared by AC Nielsen for the Canterbury Earthquake Recovery Authority. AC
Nielsen and the Canterbury Earthquake Recovery Authority.
8 Cameron MP, Cochrane W, McNeill K, Melbourne P, Morrison SL, et al. (2012) Alcohol outlet density is related to police events and motor
vehicle accidents in Manukau City, New Zealand. Aust N Z J Public Health 36: 537-542.
9 Livingston M, Chikritzhs T, Room R (2007) Changing the density of alcohol outlets to reduce alcohol-related problems. Drug and Alcohol
Review 26: 557-566.
10 Popova S, Giesbrecht N, Bekmuradov D, Patra J (2009) Hours and days of sale and density of alcohol outlets: Impacts on alcohol
consumption and damage: A systematic review. Alcohol and Alcoholism 44: 500-516.
11 Cameron MP, Cochrane W, Gordon C, Livingston M (2013) The locally-specific impacts of alcohol outlet density in the North Island of New
Zealand, 2006-2011. Research report commissioned by the Health Promotion Agency. Wellington: Health Promotion Agency.
12 Browne M, Bellringer M, Greer N, Kolandai-Matchett K, Langham E, et al. (2017) Measuring the burden of gambling harm in New Zealand:
Central Queensland University and Auckland University of Technology.
13 Abbott M, Bellringer M, Garrett N (2018) New Zealand National Gambling Study: Wave 4 (2015). Report number 6. Auckland, New
Zealand: Auckland University of Technology, Gambling & Addictions Research Centre.
14 Rook H, Rippon R, Pauls R, Doust E, Prince J (2018) Gambling harm reduction needs assessment. Wellington, New Zealand: Sapere
research group.
15 Kristiansen S, Trabjerg Camilla M (2016) Legal gambling availability and youth gambling behaviour: A qualitative longitudinal study.
International Journal of Social Welfare 26: 218-229.
16 Welte JW, Barnes GM, Tidwell M-CO, Hoffman JH (2009) Legal gambling availability and problem gambling among adolescents and young
adults. International Gambling Studies 9: 89-99.
17 Pearce J, Mason K, Hiscock R, Day P (2008) A national study of neighbourhood access to gambling opportunities and individual gambling
behaviour. J Epidemiol Community Health 62: 862-868.
18 Binde P (2013) Why people gamble: A model with five motivational dimensions. International Gambling Studies 13: 81–97.
19 Wardle H, Keily R, Astbury G, Reith G (2014) 'Risky places?': mapping gambling machine density and socio-economic deprivation. J
Gambl Stud 30: 201-212.
20 Beckert J, Lutter M (2009) The inequality of fair play: Lottery gambling and social stratification in Germany. European Sociological Review
25: 475–488.
21 Orford J, Wardle H, Griffiths M, Sproston K, Erens B (2010) The role of social factors in gambling: Evidence from the 2007 British Gambling
Prevalence Survey. Community, Work & Family 13: 257–271.
22 Abbott M, Binde P, Hodgins D, Korn D, Pereira A, et al. (2013) Conceptual Framework of Harmful Gambling: An International
Collaboration. Guelph, Ontario: Problem Gambling Research Centre (OPGRC).
23 Easton B (2002) Gambling in New Zealand: an economic overview. In: Curtis B, editor. Gambling in New Zealand. Palmerston North:
© Crown copyright 2021 Printed on: 08/08/2021 Page: 7/8Dunmore Press. pp. 45-58.
24 Department of Internal Affairs Gambling in Pubs and Clubs (Class 4). Wellington: The Department of Internal Affairs.
25 Canterbury District Health Board (2019) Canterbury Wellbeing Survey, June 2019: Report prepared by Nielsen for the Canterbury District
Health Board and partnering agencies. Christchurch: Canterbury District Health Board.
26 Environment Canterbury Regional Council (2019) Air Quality in the Canterbury Region- Winter 2019 Update: Environment Canterbury
Environmental Snapshot Report. Christchurch: Environment Canterbury Regional Council.
27 World Health Organization (2013) Health effects of particulate matter. Copenhagen: World Health Organization.
28 World Health Organization (2005) WHO Air quality guidelines for particulate matter, ozone, nitrogen dioxide and sulfur dioxide: Global
update 2005, Summary of risk assessment.
© Crown copyright 2021 Printed on: 08/08/2021 Page: 8/8You can also read