EQUITY OUTLOOK March 2021 - Verdant India

Page created by Kristen Yang
 
CONTINUE READING
EQUITY OUTLOOK March 2021 - Verdant India
EQUITY OUTLOOK

   March 2021
EQUITY OUTLOOK March 2021 - Verdant India
MACRO
EQUITY OUTLOOK March 2021 - Verdant India
MARKET RALLY

                                                The market rally has been supported by two drivers

                                                                                                          Bounce back in corporate earnings as cost cuts,
                       Liquidity driven by lower rates globally                                           tail winds in certain sectors like IT/pharma and
                                                                                                          lower-than-expected stress in financials

                                       Latest Monetary Policy Rates                                                                             EPS growth(%)
                                                                                                       Nifty-50 sectors, March fiscal
                                                                                                       year-ends, 2021E-23E (based on
                                                                                                       current constituents)
                                                              36
                                                                                                                                        2021E      2022E        2023E

                                                                                                       Nifty 50 Index                   21.0        24.7        18.2
                              15

   -0.1   0.25   0.1   0.25        2      0   3.85   4   0            0   3.75   0   4.25   1   4.25   Banks                             38          35          20

                                                                                                       Pharma                            44          8           26

SOURCE: Kotak Institutional Equities, IMF
EQUITY OUTLOOK March 2021 - Verdant India
EMERGING MARKETS PERFORMANCE

                                            FYTD Performance
   72%       71%    69%
                          64%   61%
                                      53%     51%
                                                      47%
                                                               41%   38%
                                                                           33%
                                                                                 28%
                                                                                       23%
                                                                                             19%

SOURCE: Bloomberg
EQUITY OUTLOOK March 2021 - Verdant India
MARKET CAP TO GDP BY COUNTRY

                          World      121.22
                              US           207.26
                           China    77.93
                      Hong Kong                                1933.57
                           Japan      135.51
                             UK      116.64
                          France     105.41
                            India   93.74
                         Canada       152.89
                       Germany      65.9
                    Saudi Arabia             298.56
                    South Korea      132.21
                     Switzerland             287.11
                         Taiwan                       532.93
                        Australia    120.32
                         Sweden            219.41

SOURCE: Economic Times, Bloomberg
EQUITY OUTLOOK March 2021 - Verdant India
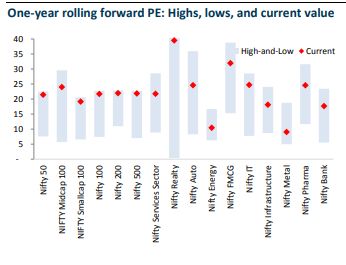
EQUITY FLOWS IN EMERGING MARKETS

                                   • High liquidity and low interest rates
                                     have led to inflows of equities in
                                     Emerging markets.

SOURCE: Phillip Capital
EQUITY OUTLOOK March 2021 - Verdant India
GOLD, DOLLAR & BONDS

  •   US Dollar Index has risen from a 31 month low in Dec
  •   Gold in USD terms has appreciated by ~9.3% and in INR terms it has appreciated by ~9.6%.
  •   Indian Bond yields too fell – India 10 year came down by 14 bps
  •   US 10 year is up by 26 bps

 Particulars                   As on 29th February 2020       As on 28th February 2021           Change
 Gold INR/10gms                         42352                          46425                      9.6%
 Gold USD/Oz                           1585.85                        1734.04                     9.3%
 10-Year G-Sec- India                   6.37%                          6.23%                     -2.2%
 10-Year T Bill- USA                    1.15%                          1.41%                     22.6%
 US Dollar Index                        98.08                          90.88                     -7.3%

SOURCE: Bloomberg
EQUITY OUTLOOK March 2021 - Verdant India
GOLD, DOLLAR & BONDS

                                   Gold Futures, Brent Oil Futures, US Dollar Index & Nifty 50
                   160
                   140                                                                            Nifty 50, 131
                                                                                                  Brent oil futures, 127
                   120
                                                                                                  Gold Futures, 107
                   100
                                                                                                  US Dollar, 93
                       80
                       60
                       40
                       20
                        0

                                      Brent oil futures   Nifty 50    Gold Futures    US Dollar

    •   The Dollar Index is down by 7% while Gold has moved up by 7%

    • In April-20, Brent Oil Futures were at the year low. It has appreciated since then, ending 27% higher

SOURCE:Investing.com
EQUITY OUTLOOK March 2021 - Verdant India
RELIEF PACKAGES, INFLATION & FISCAL DEFICIT

 • US announced relief packages worth 13% of GDP to companies, small businesses and low income adults to
   deal with the pandemic. Other countries which announced large relief packages are Japan, Canada and
   Australia. YTD 2020 US Fed has increased the Balance sheet by 76% and since 2002 the number is 900%.
 • In case of India, given the constraints on the fiscal deficit as well as the tightrope walk on the credit rating, the
   size of fiscal stimulus announced is the optimum quantum of response (~ 1% of GDP) which maximizes the
   support while minimizing the actual fiscal cost.

                                            COVID-19 stimulus packages as share of GDP 2020
                                                                  (as of October 2020)

                      21.1

                             16.4
                                    14   13.2   12.8   12
                                                            8.9
                                                                    7     6.9     6      6
                                                                                             4.9   4.4   4.3   3.4   3.4   0.7

SOURCE:Trading Economies
RELIEF PACKAGES, INFLATION & FISCAL DEFICIT

 • Inflation is below target rate across countries and in countries of Japan, Switzerland, Denmark and Eurozone have
   negative central bank rates. US is holding rates at zero as inflation is running below target rate. Across the countries,
   Central banks have cut rates and real rates are currently negative – US at -1.1%, UK at -0.6%, India at -3.6%

    Country                         Rate                     Central Bank Rate        CPI YoY         Real Rates

    US                              Fed funds                0.13%                    1.20%           -1.10%

    UK                              Bank Rate                0.10%                    0.70%           -0.60%

    Canada                          Overnight                0.25%                    0.70%           -0.50%

    Switzerland                     Target Rate              -0.75%                   -0.70%          -0.10%

    Eurozone                        Deposit rate             -0.50%                   -0.30%          -0.20%

    Japan                           Policy rate              -0.10%                   -0.40%          0.30%

    Australia                       Cash rate                0.10%                    0.70%           -0.60%

    South Korea                     Repo rate                0.50%                    0.60%           -0.10%

    Taiwan                          Discount rate            1.13%                    0.10%           1%

    China                           Loan Prime rate          3.85%                    -0.50%          4.40%

    India                           Repo rate                4%                       7.60%           -3.60%

    Russia                          Key Policy rate          4.25%                    4.40%           -0.10%
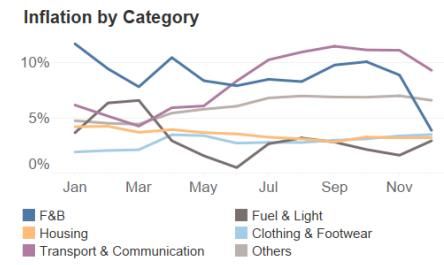
SOURCE: Bloomberg
INFLATION

   ▪   CPI, Core & Headline saw a dip

   ▪   Across Categories CPI saw dip, apart from a slight uptick in Fuel & Light category

SOURCE:Macquare
GROWTH

   ▪    Global growth estimated to decline by 3.5% in 2020 but expected to rise by 5.5% in 2021
   ▪    Advanced economies likely to grow by 4.3% in 2021 on the back of early roll out of vaccines
   ▪    Emerging economies are expected to grow by 6.3% in 2021 on the back of a contracted base

                                      GDP Growth Rates

SOURCE:World Economic Outlook, Jan 2021, IMF (Note- Data for India is presented on a fiscal year basis, remaining are on calendar year basis)
INDIAN ECONOMY

  ▪    India’s GDP growth for FY21 is estimated to
       decline by 7.7%, hit by the global pandemic                            Annual growth of GDP & demand components at constant prices
       and the lockdown

  ▪    Private consumption estimated to contract by
       9.5% in FY21 based on income loss, mobility
       restrictions, and supply constraints

  ▪    Government consumption estimated to rise by
       5.8% due to increased expenditure as part of
       pandemic relief packages.

  ▪    Investment estimated to decline by 14.5% due
       to economic uncertainty and delay in
       implementation of capital projects

SOURCE: Data until FY20 is taken from the first revised estimates of GDP (dated 29 Jan 2021); Growth rates for FY21 are taken from the first advanced estimates of
GDP (dated 7 Jan 2021)
VALUATION
INDIA VALUATION VS EMERGING MARKETS

                                                     Nifty 50 Valuation premium vs Emerging Markets (MSCI) - %
                    80
                    70                                                                      Premium (RHS,%)                          Average
                    60
                    50
                    40
                    30
                    20
                    10
                     0                     Mar-11

                                                                                                                                                       Mar-18
                                                                                                                            Jun-16
                                  Aug-10

                                                                                                                                              Aug-17
                                                    Oct-11

                                                                                        Feb-14

                                                                                                 Sep-14

                                                                                                                                                                Oct-18

                                                                                                                                                                                                    Feb-21
                                                                      Dec-12

                                                                               Jul-13

                                                                                                                                                                                  Dec-19

                                                                                                                                                                                           Jul-20
                         Jan-10

                                                             May-12

                                                                                                          Apr-15

                                                                                                                                     Jan-17

                                                                                                                                                                         May-19
                                                                                                                   Nov-15
• Even after the rally we have seen so far, Indian markets are trading at near or slightly above its long-term
  averages (@19.5x FY22).
• India’s valuation premium with respect to MSCI Emerging markets has remained stable at 40-45% over the last 4 months
  indicating that the rally has been a global one.
• 1 year forward valuations for the Nifty stands at 21.4X PE which is at the higher end of the range in terms of historical
  benchmarks.
• Weak dollar, strong Asian govt Balance sheets as compared to the West (debt as a % of GDP), earnings growth
  differential / strong EM earnings recovery to favour EMs going ahead.
SOURCE: Bloomberg
MID CAP VALUATION

                                                 NSE Midcap vs Nifty PE Prem/(Disc) %
                    120
                    100
                     80
                     60
                     40
                     20
                      0
                    -20
                    -40
                    -60
                      Mar'05   Dec'06   Sep'08      Jun'10   Mar'12        Dec'13   Sep'15   Jun'17   Mar'19   Dec'20
                                                         Prem/(Disc) (%)        Average

• The headline valuations for Nifty Midcap 100 suggest that we are in an acceptable zone which can act as a platform for the
  broader markets to do better from hereon.
• Midcaps in a growing market with market leadership and low leverage can be equally attractive investment option as any
  large cap. Sector performance has so far been led by large caps, but gradually within sectors mid-caps and small caps are
  emerging as top performers. In the sectors with post-Covid tailwinds viz. pharma, digitization, ecommerce, electronic
  manufacturing, large caps and midcaps are adequately represented and in some cases even dominated by midcaps.
• Covid impacted most sectors, however certain sectors have emerged as relatively Covid-proof i.e. Pharma, Telecom,
  Packaged foods, Chemicals, Digital spending and Digital transformation.
SOURCE: Bloomberg
VALUATIONS

     ▪    Most segments are at one year highs in terms
          of one year rolling forward PE-

           ▪   Nifty 50, Nifty Smallcap 100, Nifty 100, Nifty
               200, Nifty 500

     ▪    Segments like Nifty Energy & Nifty Metal are at
          the lower end of their 1 year range

SOURCE: Phillip Capital
SECTOR
SECTOR WISE UPDATE – NIFTY 50

  ▪    Metals remains the highest contributor to
       Nifty50 FYTD and for Feb’21

  ▪    Other significant contributors were – Utilities
       & Energy

SOURCE: Phillip Capital
SECTORAL & MARKET CAP INDICES

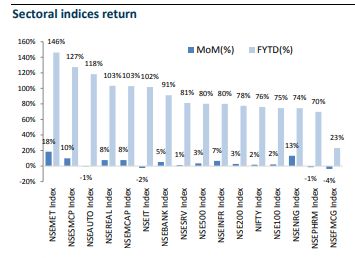
  ▪    Metals & Small Cap indices are the highest
       gainers FYTD & for Feb’21

  ▪    Auto, IT, Pharma & FMCG were negative in
       Feb’21

  ▪    Energy, Realty & Mid Cap were amongst the
       highest gainers in Feb’21

SOURCE: Phillip Capital
INFRASTRUCTURE THEME

  INVESTMENT CYCLE
  •   Investment rate as a % of GDP declined steadily from about 35% in early 2010s to 27% by end of the decade.
  •   For economic growth to sustain at 6-7%, investment cycle has to revive and play its role
  •   Three important levers required for a virtuous capex cycle seem to be falling in place- new global dynamics, domestic macro &
      proactive government policy

  PRIVATE CAPEX
  •   Private companies with high debt levels and weak balance sheet have either exited or been taken over, leaving behind a stronger Indian
      Private Sector
  •   Government’s production-linked incentive (PLI) has witnessed remarkable early success and is likely to be widened to other “Champion”
      sectors
  •   The emphasis of the PLI scheme is on encouraging scale in downstream capacities which will in due course lead to commensurate
      additions in upstream capacities as well
  •   Production Linked Incentives to boost manufacturing across sectors like Pharma, Auto, Electronics, Solar PV etc
  •   Stable domestic macro in terms of lower interest rates and liquidity support will aid greater risk appetite in the private sector
  •   We are also witnessing green shoots in the capex cycle of the domestic centric sectors viz. Cement, consumer goods and paints.

SOURCE: CSO, Internal Research
INFRASTRUCTURE THEME

  GLOBAL DYNAMICS
  •   Global move towards reshaping of manufacturing supply chains from China has led to many global MNCs looking at India as a
      manufacturing base.
  •   The trend has been accelerated by the COVID 19 pandemic

  GOVERNMENT STEPS & BUDGET IMPACT
  •   The government has allocated significant spending on capital expenditure which is expected be beneficial for cyclical sectors such as
      industrials, capital goods, metals & mining etc.
  •   Infrastructure and manufacturing revival is likely be a key theme for FY-22 due to the focus on growth in these sectors in the budget.
  •   Increased spending on key infrastructure such as Power, highways, gas distribution networks, renewable energy and transportation is also
      a positive for infrastructure sector.
  •   Labour Reforms, consolidating various laws into 4 codes

SOURCE: CSO, Internal Research
OUTLOOK
POST BUDGET OUTLOOK

  •   Overall, budget has provided for higher government spend without increase in personal and corporate taxes or
      cess. coupled with reforms and greater privatisation thrust
  •   This will support economic recovery, create earning upgrades in FY22 and thus support India’s premium
      valuations
  •   Though there is a likelihood of slightly higher interest rates as a result, it can get offset by superior earnings
      momentum especially if the budget is successful in reviving the investment cycle
  •   No changes in capital gains structure is also a sentiment positive.
  •   Overall, positive for cyclical recovery in earnings at the expense of higher fiscal deficit.
  •   Big boost on capital expenditure for FY 22.
  •   For funding, significant institutional setup planned to execute and monitor monetisation of assets owned by
      PSUs or government undertaking
  •   Three key reforms for financial markets: single securities market code, improve liquidity in bond markets and
      increase in FDI limit to 74%
  •   Big push on privatisation - 2 PSU banks and 1 general insurance company also likely to be privatised. More PSUs
      to be added to the list of privatisation and land monetisation also on the cards
  •   Setting up of ARC to buy stressed assets will enable faster resolution at the NCL
INDIA: NEW PHASE OF ECONOMIC GROWTH BECKONS

   ▪   The government’s cautious approach in providing explicit fiscal support (contained at c1.5% of GDP) is now
       coming in handy as the relatively stable macro variables (current account deficit, fiscal deficit, INR/USD) has
       helped attract its due share of portfolio inflows.

   ▪   The initial sharp cut in corporate earnings FY22 forecast of 15-20% for BSE 200 has been followed up by almost
       a 10% upgrade from the bottom

   ▪   The eventual FY22 earnings estimate may not look too different from the pre-Covid forecasts. This has been a
       result of multiple factors
        ▪ certain sectors like IT services, Pharma and Telecom have gained from the emerging tailwinds post-Covid.
        ▪ cost declines has been the key reason for the disconnect between the positive EBIT growth of 15-17% in
           BSE 200 companies for Sep-quarter as against GDP decline of 7.5%.
        ▪ lower-than-expected bad debt provisions in Banks and NBFCs.
ORGANISED VS UNORGANISED

  ▪   the top corporates in the listed universe have coped with and bounced back from the pandemic much better
      than the unorganised/informal sectors with the help of market share gains and cost cuts.
  ▪   the informal sector has been at the receiving end for last 3 years with demonetisation, GST implementation,
      NBFC crisis and now Covid.
  ▪   It is here that the concern for the GDP growth arises as informal sector accounts for bulk of the employment
      and a prolonged slowdown there would eventually impact consumption (60% of GDP in 2019) and economic
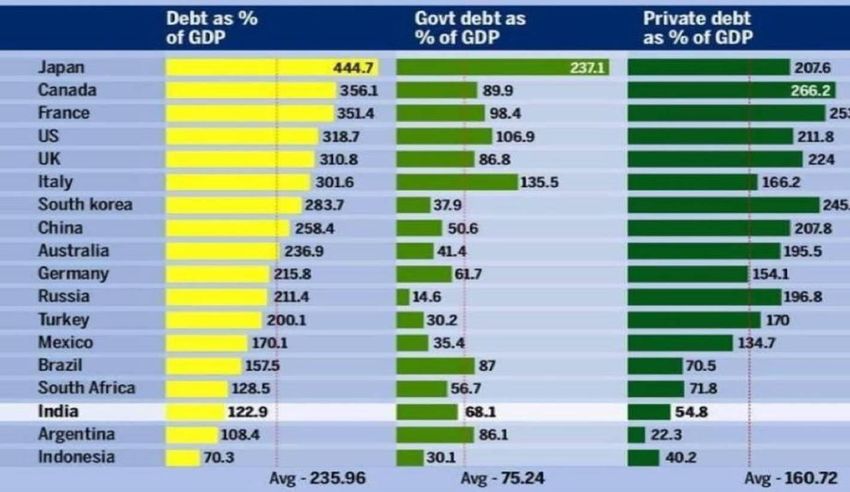
      growth eventually.
DEBT & GDP

  India’s public debt to GDP has been significantly low compared to other countries

SOURCE: Economic Survey 2020-21
EQUITY INVESTMENTS
WHY INVEST IN EQUITIES

    ▪   Market are trading at 5-10% high compared to historical valuations, yet it may be the right time to
        invest in equities because-
         ▪ Lower interest rates
         ▪ Weaker dollar
         ▪ Normal range of valuation premium amongst emerging markets
         ▪ Recovery of economy leading to opportunities to generate above average returns

SOURCE: Bloomberg
SEGMENTS TO LOOK AT

  ▪   Infra/Manufacturing/Capital Goods - Post budget the momentum in the revival of capex cycle and investment
      cycle has increased. The investment cycle is pushed by the government as well as the private sector through the
      PLI schemes.
  ▪   Mid & small caps - Many companies in Infra/Manufacturing/Capital goods are Mid & Small Caps. The market is
      expected to become more broad-based
  ▪   Pharma & IT - the sectors are still doing well but the stock performance has slowed down. Hence, the
      valuations are better now.
FUND HIGHLIGHTS
TATA BALANCED ADVANTAGE FUND - EQUITY ALLOCATIONS
(An open ended dynamic asset allocation fund.)

                                                                      MARKET SCENARIOS AND CHANGE IN EQUITY ALLOCATIONS
                            70                                                                                                                                                                                                                               16000

                            65                                                                                                                                                                                                                               14000
                                                                                                                                                       64
                            60                                                                                                                                  61                                                                                           12000
                                                                                       If a majority of macro factors58
        Equity Allocation

                            55                                                         are positive, equity                                                                                                                                                  10000

                                                                                                                                                                                                                                                                     Nifty 50
                                                                                       allocations are increased                                                           53
                            50                                                                                                                                                                                                                               8000
                                                                                                                                                                                     50
                                          49                48                           48               49       49                                                                                           48       49
                                                   48                                            48                         48                                                                                                    47
                            45                                                46                                                                                                              47                                                             6000
                                                                                                                                                                                                       44                                  43       44
                            40                                                                                                       41                                                                                                                      4000
                                 38
                                                                                                                                                                                    If a majority of macro
                                                                     38
                            35                                                                                                                                                      factors are negative, equity                                             2000
                                                                                                                                                                                    allocations are decreased
                            30                                                                                                                                                                                                                               0
                                                                     Jul-19

                                                                                                                                                                                     Jul-20
                                                   May-19

                                                                                                                                                                May-20
                                 Mar-19
                                          Apr-19

                                                                                                 Oct-19

                                                                                                                                              Mar-20
                                                                                                                                                       Apr-20

                                                                                                                                                                                                                Oct-20
                                                                                                          Nov-19
                                                                                                                   Dec-19
                                                                                                                            Jan-20

                                                                                                                                                                                                                         Nov-20
                                                                                                                                                                                                                                  Dec-20
                                                                                                                                                                                                                                           Jan-21
                                                            Jun-19

                                                                              Aug-19
                                                                                        Sep-19

                                                                                                                                     Feb-20

                                                                                                                                                                           Jun-20

                                                                                                                                                                                              Aug-20
                                                                                                                                                                                                       Sep-20

                                                                                                                                                                                                                                                    Feb-21
                                                                                                                    Equity Allocation                             Nifty 50
                                                                                                                                                                                                                                            *Source: NSE, MFI
                                                                                                                                                                         Category Average: Average of equity exposures of all Balanced Advantage Funds in MFI
NAVIGATING BULLS & BEARS
                   Fund Movement compared to Nifty 50

                                                                                          Market Rally
 29th Apr'20 to 28th Feb'21

                                                                               Average PE suggests low Equity
                                                                               Allocation, Momentum indicators
26th Mar'20 to 29th Apr'20                                                     have helped maintain higher levels

                                                                               The fund is able to capture upside
23rd Mar'20 to 26th Mar'20
                                                                                            in rallies

                                                                                                                      In terms of the current Equity allocation,
                                                                                        Market Correction            the portfolio is positioned to navigate both
18th Mar'20 to 23rd Mar'20
                                                                                                                     — market uptrend based on recovery hope
                                                                               •Trailing PE based on past earnings             and market correction
12th Mar'20 to 18th Mar'20                                                     goes down
                                                                               •Forward PE based on expected
                                                                               future earnings falls by less

 6th Mar'20 to 12th Mar'20
                                                                               Equity allocations based on an
                                                                               average of the two remains lower
                                                                               than if based on only Trailing PE
 18th Dec'19 to 6th Mar'20

                                                                                  The fund’s NAV drawdown is
                         -20.00%      0.00%       20.00%     40.00%   60.00%      limited in market downturns

                     Nifty 50      Tata Balanced Advantage Fund
                                                                                                                                           *Source: Internal Calculation
TATA MULTI ASSET OPPORTUNITIES FUND - ASSET ALLOCATION
(An Open Ended Scheme investing in equity, debt & exchange traded commodity derivatives)

                                            Scheme asset allocation(%) on a monthly basis
                                                                                                               Current
                              Equity                    Commodities Commodities Treps, Repo       Margin
                                               Debt                                                         Assets/Liabilit
                             Unhedged                    Unhedged     hedged      & Cash         Deposits
                                                                                                                 ies

               Feb’21           64.52          8.32          7.40        11.64         16.91      2.25          -13.07
               Jan’21           62.71          12.18         5.96         9.42         21.95      2.54          -16.97
              Dec’20            66.70          9.51          2.92         6.08         20.04      2.66          -7.91
              Nov’20            65.83          10.25         3.53        15.04         7.68       2.87          -5.24
               Oct'20           67.09          11.06         3.49        12.89         7.74        3.1          -5.35
               Sep'20           66.34          10.2          4.28        10.67             9.3    3.16          -3.95
              Aug’20            65.1           10.38         1.97        18.46         4.57       3.83          -4.31
               Jul ‘20          66.72          10.11         0.97        16.03         2.74       3.39           0.05
              Jun ‘20           66.07          9.24          0.41        12.73         15.38      3.57          -7.39
              May ‘20           65.88          8.16           0           6.44         20.88      3.67          -5.03
              Apr ‘20           65.68          8.09          0.86         13.9         13.02      3.68          -5.23
              Mar’ 20           57.18          8.67          0.82           -          30.8       3.41          -0.88
TATA MULTI ASSET OPPORTUNITIES FUND - ASSET ALLOCATION

                                    Fund Movement (Rebased to 100)
         140                                                                     Tata Multi Asset
                                                                              Opportunities Fund, 131
         130
                                                                                Nifty 50, 129
         120
         110                                                                   Fund Benchmark, 125

         100
          90
          80
          70
          60

                      Tata Multi Asset Opportunities Fund   Fund Benchmark   Nifty 50
TATA ARBITRAGE FUND – EXPIRY TO EXPIRY RETURNS
(An open ended scheme investing in arbitrage opportunities.)

  ▪   Expiry to Expiry returns have varied with some months showing higher returns

  ▪   Staying invested for the short to medium term is beneficial for the investor

                                           14.03%

                                                       8.52%

                      7.06%

                                                                                                                      5.52%
                                                                                                                                            5.12%
                                                                                                        3.98%
                                                                              3.37%
                                 3.05%
                                                                                             2.68%
                                                                                                                                 1.80%                 2.00%      1.92%
                                         1.10%
                   0.57%                            0.68%                                                        0.45%                   0.42%
                              0.25%                                        0.28%       0.22%         0.33%                    0.15%                 0.17%      0.16%

                                                               -0.04%
                                                                         -0.48%

                    Feb-20     Mar-20     Apr-20    May-20      Jun-20      Jul-20      Aug-20        Sep-20         Oct-20    Nov-20     Dec-20     Jan-21     Feb-21

                                                                          Absolute Returns       Annualized Return
TATA LARGE & MID CAP FUND– PORTFOLIO CONSTRUCTION
(An open-ended equity scheme investing in both large cap & mid cap stocks.)

                   STEADY RETURNS                                               LOW DEBT AND HIGH FREE CASH
                                                                                          FLOWS
       Preference for stocks that have shown consistent
                 performance over the past.                                   Companies that are low debt and therefore able to
                                                                               retain a greater part of their revenues as profits.

                                                            PORTFOLIO
                                                           CONSTRUCTION

                 EARNINGS SURPRISE                                              GROWTH AT REASONABLE PRICE
      Stocks that the fund managers have a more positive                      The fund manager pricks stocks on individual merit
      view on than the market consensus and thus will be                             and is not wedded to the benchmark
                   able to surprise on earnings

     *Current portfolio construction strategy, and is subject to change in the future
TATA LARGE & MID CAP FUND– FUND PERFORMANCE

                                Tata Large & Mid Cap Fund                          Nifty Large Midcap 250 TRI*                     S&P BSE Sensex TRI#
        Period               Return %                  Rs.                      Return %                   Rs.               Return %                  Rs.
        1 Year               31.66%                  13,157                      36.62%                 13,650               30.00%                  12,990
        3 Year               12.19%                  14,116                      11.01%                 13,674               14.22%                  14,894
        5 Year               16.65%                  21,593                      18.54%                 23,391               17.89%                  22,764
    Since Inception          12.59%                  277,245                       NA                     NA                 12.32%                  259,497
                              Managed by: Chandraprakash Padiyar (Managing Since 3-Sep-18) & Meeta Shetty (Managing Since 1-Nov-19)

                                                      Tata Large & Mid Cap Fund             Nifty Large Midcap 250 TRI*            S&P BSE Sensex TRI#
               Period        Amt. invested          Return %                Rs.            Return %               Rs.         Return %               Rs.
               1 Year          120,000               72.59%              162,156            80.52%              166,407        64.31%             157,657
               3 Year          360,000               22.19%              496,678            21.96%              495,124         20%               481,847
               5 Year          600,000               15.80%              889,431            16.37%              901,956        16.62%             907,381
           Since Inception    2,460,000              17.85%             20,639,303          14.13%             6,564,089       15.28%            14,841,217
           Inception Date     25-Feb-93      First Installment date                       01-Mar-93         Managing since                       03-Sep-18
SWINGS IN LONG TERM SIP PERFORMANCE

                                                                                                                    SIP 5 Year CAGR
                                             Scheme
                                                                                                    As on 31st March 2020     As on 28th Feb 2021
 Tata Hybrid Equity Fund                                                                                   -4.33%                     10.38%
 (An open ended hybrid scheme investing predominantly in equity & equity related instruments.)

 B: Crisil Hybrid 25+75 - Aggressive Index                                                                 0.03%                      14.47%
 Tata Large & Mid Cap Fund                                                                                 -3.83%                     15.80%
 (An open-ended equity scheme investing in both large cap & mid cap stocks.)

 B: Nifty Large Midcap 250 TRI                                                                             -4.77%                     16.37%
 Tata India Tax Savings Fund                                                                               -3.64%                     14.24%
 (An open ended equity linked savings scheme with a statutory lock in of 3 years and tax benefit)

 B: S&P BSE Sensex TRI                                                                                     -1.25%                     16.62%
 Tata Large Cap Fund                                                                                       -5.59%                     12.77%
 (An open-ended equity scheme predominantly investing in large cap stocks.)

 B: S&P BSE Sensex TRI                                                                                     -1.25%                     16.62%
 Tata Mid Cap Growth Fund                                                                                  -4.27%                     17.95%
 (An open-ended equity scheme predominantly investing in mid cap stocks.)

 B: Nifty Midcap 100 TRI                                                                                  -11.05%                     14.40%
 Tata Equity PE Fund                                                                                       -5.25%                     11.74%
 (An open ended equity scheme following a value investment strategy)

 B: S&P BSE Sensex TRI                                                                                     -1.25%                     16.62%
PERFORMANCE IN SEBI FORMAT,
              OTHER PERFORMANCES & PRODUCT LABELS

Data as on 28th Feb 2021
TATA ARBITRAGE FUND

  Fund performance in SEBI format
                                Tata Arbitrage Fund                              Nifty 50 Arbitrage Index*                     Nifty 50 TRI#
        Period           Return %                   Rs.                      Return %                   Rs.        Return %                     Rs.
        1 Year            3.97%                      10,396                   1.86%                  10,186        31.37%                      13,127
        3 Year             NA                          NA                      NA                      NA            NA                          NA
        5 Year             NA                          NA                      NA                      NA            NA                          NA
    Since Inception       5.41%                      11,227                   4.43%                  10,999        15.31%                      13,669
                                                        Managed by: Sailesh Jain (Managing Since 10-Dec-18)

  Performance of other schemes managed by the FM

                                         Sailesh Jain                                                     1 Year      3 Year                    5 Year
                               Tata Balanced Advantage Fund                                               22.67         NA                        NA
                           CRISIL Hybrid 35+65 - Aggressive Index                                         25.90         NA                        NA

                              Tata Nifty Exchange Traded Fund                                             31.29        NA                        NA
                                         Nifty 50 TRI                                                     31.37        NA                        NA

                                  Tata Equity Savings Fund                                                12.71        6.75                     8.02
                                 NIFTY Equity Savings Index                                               15.44        9.35                     10.69

                        Tata Nifty Private Bank Exchange Traded Fund                                      15.23        NA                        NA
                                     Nifty Private Bank TRI                                               16.37        NA                        NA

                                      Tata Quant Fund                                                     8.66         NA                        NA
                                      S&P BSE 200 TRI                                                     33.70        NA                        NA
TATA LARGE & MID CAP FUND

  Fund performance in SEBI format
                           Tata Large & Mid Cap Fund                      Nifty Large Midcap 250 TRI*                       S&P BSE Sensex TRI#
        Period          Return %                  Rs.                  Return %                   Rs.                 Return %                  Rs.
        1 Year           31.66%                 13,157                 36.62%                  13,650                 30.00%                 12,990
        3 Year           12.19%                 14,116                 11.01%                  13,674                 14.22%                 14,894
        5 Year           16.65%                 21,593                 18.54%                  23,391                 17.89%                 22,764
    Since Inception      12.59%                 277,245                  NA                      NA                   12.32%                 259,497
                         Managed by: Chandraprakash Padiyar (Managing Since 3-Sep-18) & Meeta Shetty (Managing Since 1-Nov-19)

  Performance of other schemes managed by the FM
                                 Chandraprakash Padiyar                                             1 Year                3 Year               5 Year
                                 Tata Hybrid Equity Fund                                            23.73                  7.84                11.33
                         Crisil Hybrid 25+75 - Aggressive Index                                     28.36                 12.04                15.82

                                 Tata Small Cap Fund                                                    38.57              NA                    NA
                                Nifty Smallcap 100 TRI                                                  43.58              NA                    NA

                                     Meeta Shetty                                                   1 Year                3 Year               5 Year
                                Tata Digital India Fund                                             62.80                 24.47                20.36
                                    S&P BSE IT TRI                                                  66.65                 27.45                21.40

                        Tata India Pharma And Healthcare Fund                                           49.20             18.10                 8.48
                                    Nifty Pharma TRI                                                    58.69             10.85                 2.00
TATA HYBRID EQUITY FUND

  Fund performance in SEBI format
                                         Tata Hybrid Equity Fund               Crisil Hybrid 25+75 - Aggressive Index*                       S&P BSE Sensex TRI#
         Period                      Return %                  Rs.               Return %                     Rs.                      Return %                  Rs.
        1 Year                       23.73%                 12,366               28.36%                       12,827                   30.00%                 12,990
        3 Year                        7.84%                 12,540               12.04%                       14,060                   14.22%                 14,894
        5 Year                       11.33%                 17,099               15.82%                       20,835                   17.89%                 22,764
    Since Inception                  15.33%                 374,922                NA                           NA                     12.55%                 201,879
      Managed by: Chandraprakash Padiyar (Managing Since 3-Sep-18), Murthy Nagarajan (Managing since 1-Apr-17) & Satish Chandra Mishra (Managing Since 1-Nov-19)

                                                                                                   Murthy Nagarajan                           1 Year           3 Year   5 Year
  Performance of other schemes managed by the FM                                     Tata Retirement Savings Fund - Progressive Plan          21.83             8.66    17.67
                                                                                                   S&P BSE 200 TRI                            33.70            12.06    17.63

         Chandraprakash Padiyar                 1 Year       3 Year   5 Year         Tata Retirement Savings Fund - Moderate Plan             20.60            8.26     15.41
        Tata Large & Mid Cap Fund               31.66         12.19   16.65              Crisil Hybrid 25+75 - Aggressive Index               28.36            12.04    15.82
        NIFTY Large Midcap 250 TRI              36.62         11.01   18.54
                                                                                    Tata Retirement Savings Fund - Conservative Plan          11.17            7.31     10.04
                                                                                     CRISIL Short Term Debt Hybrid 75+25 Fund Index           15.16            10.04    10.89
           Tata Small Cap Fund                  38.57          NA      NA
          Nifty Smallcap 100 TRI                43.58          NA      NA                       Tata Equity Savings Fund                      12.71             6.75    8.02
                                                                                               NIFTY Equity Savings Index                     15.44             9.35    10.69

                                                                                                Tata Gilt Securities Fund                     4.09              7.90    7.38
         Satish Chandra Mishra                  1 Year       3 Year   5 Year
                                                                                                Crisil Dynamic Gilt Index                     6.64              9.47    8.41
      Tata Resources & Energy Fund              54.55         12.60   18.51
         Nifty Commodities TRI                  45.76         5.12    17.51                      Tata Medium Term Fund                        8.13              1.71    4.13
                                                                                             Crisil Medium Term Debt Index                    8.30              9.07    8.89
          Tata Small Cap Fund                   38.57          NA      NA
                                                                                    Tata Medium Term Fund (Segregated Portfolio 1)            -25.09            NA       NA
         Nifty Smallcap 100 TRI                 43.58          NA      NA                   Crisil Medium Term Debt Index                      8.30             NA       NA

                                                                                               Tata Short Term Bond Fund                      7.07              5.67    6.27
                                                                                           CRISIL Short Term Bond Fund Index                  7.52              8.53    8.16
TATA INDIA TAX SAVINGS FUND

     Fund performance in SEBI format
                                                             Tata India Tax Savings Fund                                                      S&P BSE Sensex TRI*
                     Period                          Return %                            Rs.                                      Return %                              Rs.
                  1 Year                              26.07%                           12,599                                     30.00%                              12,990
                  3 Year                               9.45%                           13,108                                     14.22%                              14,894
                  5 Year                              16.99%                           21,902                                     17.89%                              22,764
              Since Inception                         18.69%                           716,044                                    13.11%                              215,777
                                           Managed by: Rupesh Patel (Managing Since 1-Apr-15) & Ennette Fernandes (Managing Since 18-Jun-18)

     Performance of other schemes managed by the FM                                              ENNETTE FERNANDES                           1 Year          3 Year             5 Year
                                                                                               Tata India Consumer Fund                      20.24            7.32              18.84
                                                                                                                           *
                                                                                             Nifty India Consumption TRI                     20.43            7.69              14.19
                RUPESH PATEL               1 Year      3 Year        5 Year
          Tata Mid Cap Growth Fund         30.72       13.57         19.34          Tata Retirement Savings Fund - Moderate Plan             21.83            8.66              17.67
            Nifty Midcap 100 TRI*          39.98        6.79         16.24              Crisil Hybrid 25+75 - Aggressive Index*              33.70            12.06             17.63

           Tata Infrastructure Fund        33.64        5.04         14.75          Tata Retirement Savings Fund - Progressive Plan          20.60            8.26              15.41
       S&P BSE India Infrastructure TRI*   49.26        0.11         13.59                         S&P BSE 200 TRI*                          28.36            12.04             15.82

             Tata Large Cap Fund           25.41        9.41         14.05         Tata Retirement Savings Fund - Conservative Plan          11.17            7.31              10.04
                                 *
             S&P BSE Sensex TRI            30.00       14.22         17.89         CRISIL Short Term Debt Hybrid 75+25 Fund Index*           15.16            10.04             10.89

          Tata Focused Equity Fund         28.99        NA            NA                           Tata Ethical Fund                         33.44            9.87              12.93
               S&P BSE 200 TRI             33.70       12.06         17.63                       Nifty 500 Shariah TRI                       41.75            11.82             17.89

Effective from 9th March 2021, this fund will be managed by Tejas Gutka and Ennette Fernandes
TATA LARGE CAP FUND

     Fund performance in SEBI format
                                                                    Tata Large Cap Fund                                                          S&P BSE Sensex TRI*
                    Period                             Return %                              Rs.                                Return %                                      Rs.
                 1 Year                                25.41%                              12,534                                30.00%                                  12,990
                 3 Year                                 9.41%                              13,095                                14.22%                                  14,894
                 5 Year                                14.05%                              19,291                                17.89%                                  22,764
             Since Inception                           19.62%                              596,913                               13.34%                                  174,429
                   Managed by: Rupesh Patel (Managing Since 18-Jun-18), Venkat Samala (Managing Since 26-Nov-20) & Ennette Fernandes (Managing Since 18-Jun-18)

     Performance of other schemes managed by the FM                                                            ENNETTE FERNANDES                      1 Year           3 Year       5 Year
                                                                                                             Tata India Consumer Fund                 20.24            7.32         18.84
                  RUPESH PATEL                1 Year              3 Year          5 Year                                                 *
                                                                                                           Nifty India Consumption TRI                20.43            7.69         14.19
           Tata India Tax Savings Fund        26.07               9.45            16.99
               S&P BSE Sensex TRI*            30.00               14.22           17.89              Tata Retirement Savings Fund - Moderate
                                                                                                                         Plan                         21.83            8.66         17.67
             Tata Infrastructure Fund         33.64               5.04            14.75                Crisil Hybrid 25+75 - Aggressive Index*        33.70            12.06        17.63
         S&P BSE India Infrastructure TRI*    49.26               0.11            13.59
                                                                                                     Tata Retirement Savings Fund - Progressive
            Tata Mid Cap Growth Fund                                                                                   Plan                           20.60            8.26         15.41
                                              30.72               13.57           19.34
                                                                                                                 S&P BSE 200 TRI*                     28.36            12.04        15.82
              Nifty Midcap 100 TRI*           39.98               6.79            16.24

                                                                                                           Tata Retirement Savings Fund -
            Tata Focused Equity Fund          28.99                NA              NA                             Conservative Plan                   11.17            7.31         10.04
                 S&P BSE 200 TRI              33.70               12.06           17.63              CRISIL Short Term Debt Hybrid 75+25 Fund
                                                                                                                       Index*                         15.16            10.04        10.89
                VENKAT SAMALA                 1 Year              3 Year          5 Year
              Tata Digital India Fund                                                                            Tata Ethical Fund                    33.44            9.87         12.93
                                              62.80               24.47           20.36
                 S&P BSE IT TRI*                                                                               Nifty 500 Shariah TRI                  41.75            11.82        17.89
                                              66.65               27.45           21.40
Effective from 9th March 2021, this fund will be managed by Amey Sathe & Venkat Samala
TATA MID CAP GROWTH FUND

     Fund performance in SEBI format
                                                Tata Mid Cap Growth Fund                         Nifty Midcap 100 TRI*                                      Nifty 50 TRI#
              Period                         Return %                  Rs.                  Return %                         Rs.                 Return %                     Rs.
            1 Year                           30.72%                13,062                   39.98%                        13,985                 31.37%                     13,127
            3 Year                           13.57%                14,643                    6.79%                        12,177                 12.88%                     14,378
            5 Year                           19.34%                24,193                   16.24%                        21,217                 17.29%                     22,189
        Since Inception                      12.78%                247,214                    NA                            NA                   10.81%                     154,637
                                               Managed by: Rupesh Patel (Managing Since 27-Jun-17) & Ennette Fernandes (Managing Since 18-Jun-18)

     Performance of other schemes managed by the FM                                                            ENNETTE FERNANDES                  1 Year           3 Year             5 Year
                                                                                                             Tata India Consumer Fund             20.24             7.32              18.84
                  RUPESH PATEL                        1 Year       3 Year          5 Year
                                                                                                           Nifty India Consumption TRI*           20.43             7.69              14.19
           Tata India Tax Savings Fund                  26.07       9.45           16.99
               S&P BSE Sensex TRI*                      30.00      14.22           17.89
                                                                                                 Tata Retirement Savings Fund - Moderate Plan     21.83             8.66              17.67
                                                                                                       Crisil Hybrid 25+75 - Aggressive Index*    33.70             12.06             17.63
             Tata Infrastructure Fund                   33.64       5.04           14.75
         S&P BSE India Infrastructure TRI*              49.26       0.11           13.59
                                                                                                  Tata Retirement Savings Fund - Progressive
                                                                                                                    Plan                          20.60             8.26              15.41
               Tata Large Cap Fund                      25.41       9.41           14.05                      S&P BSE 200 TRI*                    28.36             12.04             15.82
               S&P BSE Sensex TRI*                      30.00      14.22           17.89
                                                                                                  Tata Retirement Savings Fund - Conservative
            Tata Focused Equity Fund                    28.99       NA              NA                                Plan                        11.17             7.31              10.04
                                                                                                   CRISIL Short Term Debt Hybrid 75+25 Fund
                 S&P BSE 200 TRI                        33.70       NA              NA
                                                                                                                    Index*                        15.16             10.04             10.89

                                                                                                                 Tata Ethical Fund                33.44             9.87              12.93
                                                                                                               Nifty 500 Shariah TRI              41.75             11.82             17.89
Effective from 9th March 2021, this fund will be managed by Satish Chandra Mishra & Abhinav Sharma
TATA EQUITY PE FUND

  Fund performance in SEBI format
                                                                     Tata Equity P/E Fund                                                      S&P BSE Sensex TRI*
                 Period                                   Return %                              Rs.                           Return %                                   Rs.
               1 Year                                     27.82%                             12,774                           30.00%                                 12,990
               3 Year                                      5.53%                             11,752                           14.22%                                 14,894
               5 Year                                     17.52%                             22,405                           17.89%                                 22,764
           Since Inception                                18.22%                             163,058                          16.54%                                 128,380
                                                 Managed by: Sonam Udasi (Managing Since 1-Apr-16) & Amey Sathe (Managing Since 18-Jun-18)

  Performance of other schemes managed by the FM
                          Sonam Udasi                            1 Year     3 Year     5 Year                          Sonam Udasi                              1 Year         3 Year   5 Year
  Tata Flexi Cap Fund (previously known as Tata Multicap Fund)   23.01       NA         NA               Tata Banking And Financial Services Fund               19.01          13.03    21.81
                        S&P BSE 500 TRI                          34.42       NA         NA                      Nifty Financial Services TRI                    18.92          16.07    23.32

                 Tata Index Fund - Sensex Plan                   27.86      13.24      16.77                    Tata India Consumer Fund                        20.24          7.32     18.84
                      S&P BSE Sensex TRI                         30.00      14.22      17.89
                                                                                                               Nifty India Consumption TRI                      20.43          7.69     14.19

        Tata Retirement Savings Fund - Progressive Plan          21.83      8.66       17.67
                        S&P BSE 200 TRI                                                                         Tata Value Fund Series - 1                      21.03           NA       NA
                                                                 33.70      12.06      17.63
                                                                                                                     S&P BSE 200 TRI                            33.70          12.06    17.63
                  Tata Index Fund - Nifty Plan                   29.59      12.06      16.25
                          Nifty 50 TRI                           31.37      12.88      17.29                    Tata Value Fund Series - 2                      20.24           NA       NA
                                                                                                                     S&P BSE 200 TRI                            33.70          12.06    17.63
         Tata Retirement Savings Fund - Moderate Plan            20.60      8.26       15.41
             Crisil Hybrid 25+75 - Aggressive Index              28.36      12.04      15.82
                                                                                                                       Amey Sathe                               1 Year         3 Year   5 Year
                                                                                                                  Tata Digital India Fund                       32.30          8.01     11.15
       Tata Retirement Savings Fund - Conservative Plan          11.17      7.31       10.04
        CRISIL Short Term Debt Hybrid 75+25 Fund Index                                                                S&P BSE IT TRI                            33.70          12.06    17.63
                                                                 15.16      10.04      10.89
PERFORMANCE DISCLAIMERS

 ▪   1) Scheme returns in terms of CAGR are provided for past 1 year, 3 years, 5 years and since inception.
 ▪   2) Point-to-point returns on a standard investment of Rs. 10,000/- are in addition to CAGR for the schemes.
 ▪   3) Different plans shall have a different expense structure. The performance details provided herein are of regular plan growth option except for Tata India Tax Savings
     Fund & TATA Mid Cap Growth Fund where performance details given is for regular plan dividend option.
 ▪   4 ) NA stands for schemes in existance for more than 1 year but less than 3 years or 5 years, or instances where benchmark data for for corresponding period not
     available.
 ▪   5) Period for which schemes performance has been provided is computed basis last day of the month - ended preceding the date of adversiment.
 ▪   6) Past performance may or may not be sustained in future. For computation of since inception returns the allotment NAV has been taken as Rs. 10.00 *All payouts
     during the period have been reinvested in the units of the scheme at the then prevailing NAV. Load is not considered for computation of returns. While calculating
     returns dividend distribution tax is excluded. Schemes in existence for less than 1 year, performance details for the same are not provided.
 ▪   7) For Benchmark Indices Calculations , Total Return Index(TRI) has been used. Where ever TRI not available Composite CAGR has been disclosed .Please refer
     Disclaimer sheet for composite CAGR disclosure
DISCLOSURES

        Name of the Scheme                                                 This product is suitable for investors who are seeking*                                      Risk-O-Meter

                                     • Long Term Capital Appreciation.
Tata Hybrid Equity Fund              • Investment predominantly in equity & equity related instruments (65% - 80%) & some portion (between 20% to 35%) in fixed
                                        income instruments.
                                     • Long Term Capital Appreciation.
Tata Equity P/E Fund                 • Investment (minimum 70%) in equity & equity related instruments of companies whose rolling P/E is lower than rolling P/E of
                                     S&P BSE Sensex.
                                     • Long Term Capital Appreciation. • An equity linked savings scheme (ELSS) Investing predominantly in Equity & Equity related
Tata India Tax Savings Fund
                                     instruments.
                                     • Long Term Capital Appreciation. • Investment in equity & equity related instruments of well researched value and growth
Tata Large & Mid Cap Fund
                                     oriented Large & Mid Cap Companies

Tata Large Cap Fund                  • Long Term Capital Appreciation. • Investment predominantly in equity & equity related securities of large cap companies.

                                     • Long Term Capital Appreciation. • Investment predominantly in equity & equity related instruments of growth oriented mid cap
Tata Mid Cap Growth Fund:
                                     companies

                                     • Income over a short term investment horizon. • Investments predominantly in arbitrage opportunities in the cash and derivative
Tata Arbitrage Fund
                                     segments of equity markets and by investing the balance sheet in debt and money market instruments

*Investors should consult their financial advisors if in doubt about whether the product is suitable for them.
THANK YOU

Disclaimer: The views expressed in this article are personal in nature and in is no way trying to predict the markets or to time them. The views expressed are for
information purpose only and do not construe to be any investment, legal or taxation advice. Any action taken by you on the basis of the information contained
herein is your responsibility alone and Tata Asset Management will not be liable in any manner for the consequences of such action taken by you. Please consult your
Financial/Investment Adviser before investing. The views expressed in this article may not reflect in the scheme portfolios of Tata Mutual Fund. This is for information
only and is not to be considered as sales literature. Not to be used for solicitation of business in schemes of Tata Mutual Fund.

                 Mutual Fund investments are subject to market risks, read all scheme related documents carefully
You can also read