EULER HERMES EXPORT FORECAST - May 2021
←
→
Page content transcription
If your browser does not render page correctly, please read the page content below
EULER HERMES
EXPORT FORECAST
May 2021
EXPORT FORECAST
CLIMBS TO RECORD HIGH
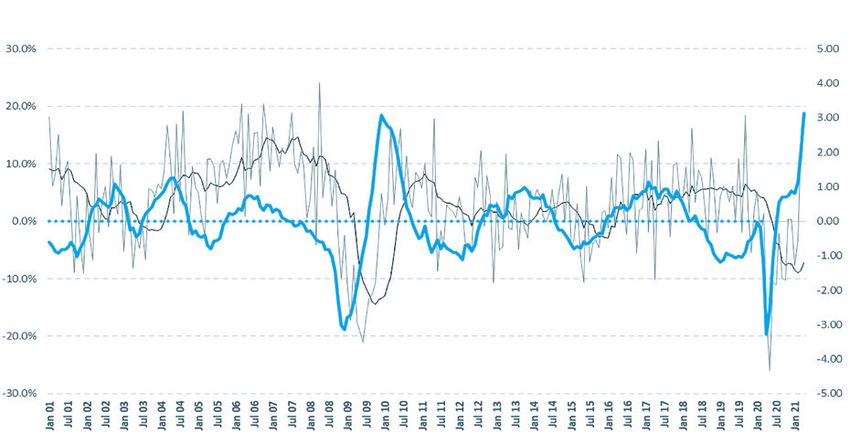
The Export Forecast stands at 3.13 points – more than two points above the figure of 0.78 reported
three months ago. Even if special factors are partly responsible for this exploit, a strong increase in
Swiss exports can nevertheless be expected this year. While COVID-19 remains a big problem in
certain service sectors, goods traffic is benefiting from intact purchasing power and the backlog of
demand from private households and companies.
At 3.13 points, the Euler Hermes Export The upturn in industrial activity has cata- cautious approach to recruiting new em-
Forecast is not only trending above zero, pulted the Swiss Purchasing Managers’ ployees. The foreign country PMI, which is
the level which indicates the long-term Index (PMI) to a record high of 69.5. A survey weighted by shares of exports, has also ri-
average growth rate of the Swiss export by procure.ch showed very high figures for sen substantially. At 59.3 points, it is just short
industry, in the first quarter of 2021. It has order volume, purchasing volume, purcha- of the record high seen in February 2011.
risen by more than two points in three sing prices and delivery dates. According to Stefan Ruf, CEO of Euler Hermes Switzer
months to a new record high. Statistically, procure.ch, demand for goods is likely to land, comments: “The Swiss export economy
this dramatic increase is attributable to the be above-average in general because is benefiting from the global upturn in in-
very low base level of the same period last households have been restricted in their dustry. The price of copper has doubled in
year. Added to that is the fact the economy consumption possibilities, especially with the space of a year. Freight prices for con-
of some regions – including China and the regard to services such as events and travel, tainer transport are hitting new records
US – has been developing quite dynami- by the lockdown measures. Despite short once again. In 2021, the supply shortages
cally for a number of months. ages, however, companies are still taking a which have been a reality at the large
Following a weak start to 2021 from an
economic perspective, the starting gun
was fired for the resurrection of private EXPORT FORECAST
consumption after Easter when the first
steps were taken to ease the coronavirus Exports year-on-year: 12 months rolling
restrictions. Given the recent declines in Exports in comparison with the previous year
Euler Hermes Export Indicator (right-hand scale)
new infections and the good progress
Zero-point line as long-term trend
being made with the vaccination campaign,
the economy should shift into turbo mode
in the second half of the year.
Euler Hermes anticipates an unprecedented
consumption boom, fuelled by pent-up de-
mand and decreasing economic uncertainty.
Global trade volumes are expected to in-
crease by 7.9% in 2021 and 6% in 2022
(2020: –8.1%). The Swiss economy is projec-
+3.13%
ted to grow by a total of 3.6% in 2021 and
3.0% in 2022 (2020: –2.9%). As a result, eco-
nomic output is likely to reach pre-crisis
levels by late summer of this year.
The Euler Hermes Export Forecast indicates the future trend in Swiss goods exports (blue,
THE DEMAND IS SO HIGH THAT THERE right-hand scale, in standard deviations), with the zero-point line depicting the long-term,
ARE CONSIDERABLE DELIVERY DELAYS average growth trend in the annual rates of change. The graph also documents the official
export statistics (including 12 months rolling, left-hand scale).
IN SOME AREAS.
Due to the simultaneous upturn that has
been observed in all regions of the world
since Easter, demand is so high that supply
BUSINESS CLIMATE
chain issues such as significant delivery de- Green.
lays and shortages of preliminary products Countries above average Russia
could intensify in the short term. These Trending higher Canada
Kaz.
bottlenecks are particularly serious in the China
United States
semiconductor industry, which in turn will Netherlands Iran China
Libya Eg.
USA
affect not only the IT industry but also the India
automotive sector, for example. The conse- Countries below average
Ni.
quence of this is price increases, as are Trending lower
Ko.
already widespread on the commodity Egypt
Brazil
market in particular, above all in industrial Israel Australia
metals and energy sources. Only precious Russia Arg.
metals such as gold and silver and the be-
verage sector were not affected by the rise
in prices. The slump in the beverage industry The global Business Climate map shows the current trends in the leading economic indicators
by region. All sectors are taken into account. The global climate indicator currently stands at 104.9,
is directly related to COVID-19 and the which is 4.9 points above the long-term average of 100 points (end of January: 99 points).
resulting shortage of demand from the There is strong positive momentum in China, the Netherlands and the US. The leading indicators
restaurant industry. in Egypt, Israel and Russia are negative or neutral. Egypt and Israel suffered as a result of the
obstruction of the Suez Canal.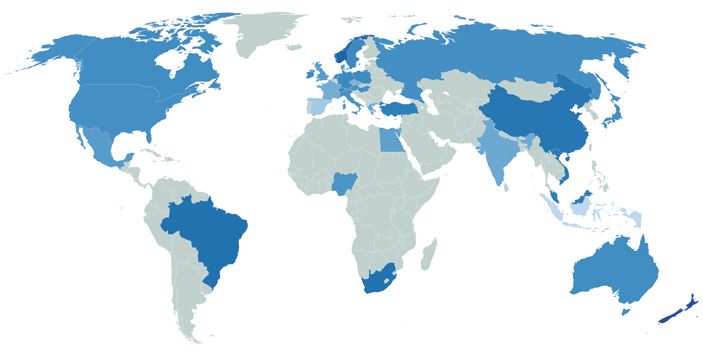
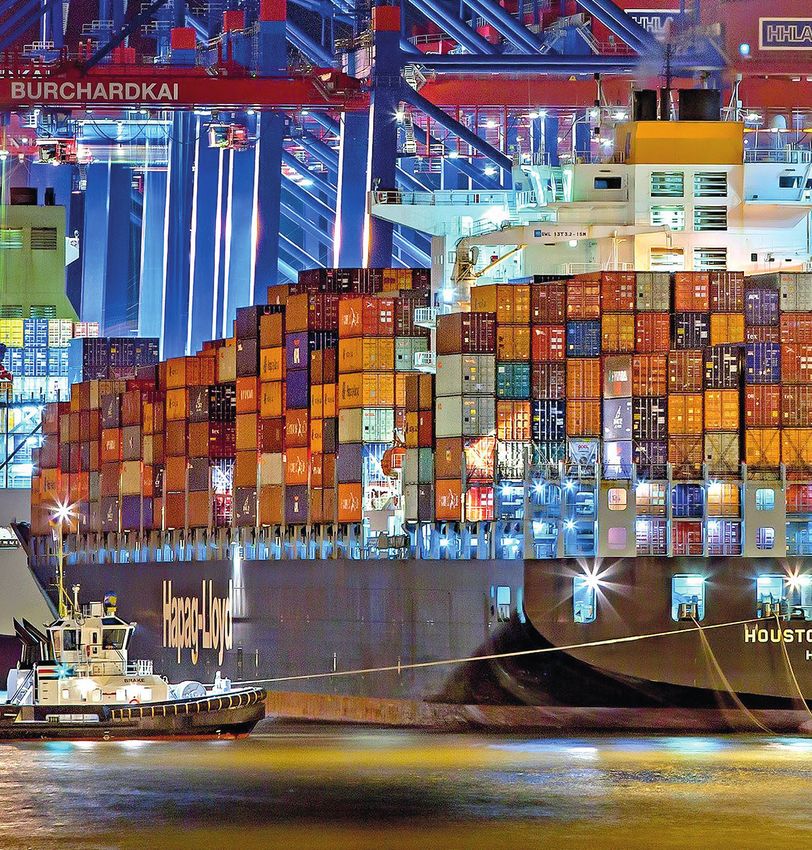
freight ports since the beginning of the In addition to inflation risks, the focus will
MERCHANDISE EXPORTS (YOY) year are attributable not to COVID-19 also remain on COVID-19 or, more specifi-
restrictions but to high demand. Then came cally, on the race between the vaccination
the obstruction of the Suez Canal and now campaigns and the efficacy of the vaccines
Last official release
people are worrying about the shortage of on the one hand and new COVID-19 vari-
semiconductors. These forces could rather ants on the other.”
1 China 69.4% slow down the boom somewhat.
2 Norway 33.5%
3 Hong Kong 33.1% SWISS EXPORTS SURPASS PRE-CORONAVIRUS LEVELS
4 Australia 28.3%
5 South Africa 28.2% Following falls of 7.1% in exports and 11.2% exports are once again approaching the
6 Peru 27.4% in imports in 2020, Swiss foreign trade is quarterly sales figures seen in the sector’s
now in recovery mode. In the first quarter strong years of 2018/19.
7 Slovakia 26.6%
of 2021, exports were up by 4.8% on the In the first quarter of 2021, Switzerland ex-
8 Chile 26.5% fourth quarter of 2020 (seasonally adjusted ported more in terms of value to all major
9 Vietnam 24.7% figures). Thanks to this third quarterly in- economic regions, with sales to North
10 Taiwan 23.5% crease in succession, exports exceeded the America undergoing a particularly marked
11 Malaysia 22.4% level they had been at before the outbreak increase (+18.5%). Chemicals and pharma-
of the coronavirus pandemic. Imports rose ceuticals are playing a key role here – an
12 India 21.6%
by 1.7% versus the final quarter of 2020, indication of the impact of Lonza’s vaccine
13 France 20.0% but remain 7.4% down on the fourth quarter exports to Moderna. Sales in the US were
14 Czech Republic 19.9% of 2019. The trade balance closed with a close to the peak that was reached in the
15 World 16.8% surplus of CHF 11.3 billion. In real terms first quarter of 2020. Goods sales to Europe
16 Indonesia 16.8% and adjusted for inflation, the changes were up by 4.6%. At CHF 32.6 billion, ex-
hardly differ from the nominal figures this ports exceeded the level they were at prior
17 Canada 16.1%
time. to the outbreak of the coronavirus pandemic
18 Argentina 15.0%
According to the Swiss Customs Administra- according to official figures. Deliveries to
19 Philippines 14.4%
tion (EZV), more than half of the increase France and Spain each rose by a tenth and
20 Brazil 14.2% was generated by chemical and pharma- deliveries to Germany by 7.5% within the
21 Finland 13.6% ceutical products (CHF +1.4 billion), with space of a quarter. Sales to Asia were up
22 Sweden 12.7% the highest growth being reported in medi- by 2.6%. The increase was particularly
23 South Korea 11.9% cines (CHF +1.2 billion). Exports of machi- marked in deliveries to China (+9.4%), and
nery and electronics and metals also rose. the country has now reached a new record
24 Germany 11.6%
With growth of 4.0% (CHF 5.3 billion), watch level of CHF 4.3 billion.
25 Japan 11.4%
26 Singapore 10.8%
27 Poland 10.0%
28 Italy 8.1% TREND: GLOBAL ASSESSMENT
29 Hungary 7.9% World Trade Actual
7
30 Greece 7.7% 6 Neutral
31 Netherlands 7.5% 5
32 Ireland 7.2% Consumer 4 Commodity
Sentiment 3 Markets
33 Switzerland 6.6%
2
34 Romania 6.3% 1 How does the current situation
35 Croatia 6.2% 0 compare to the long-term average?
36 Austria 6.0% The further the blue line protrudes into
the red zone, the worse the situation
37 New Zealand 5.9% for the dimension depicted. The past
38 Portugal 5.6% three months have seen improvements
in business and consumer sentiment,
39 Mexico 4.5% global trade and the commodity
40 Ukraine 3.8% Investor Business market. Consumer confidence has
Sentiment Sentiment recovered due to the improved out-
41 Denmark 3.1% look for the economy and the employ-
42 Colombia 3.0% ment market.
43 Spain 2.6%
44 United States 2.1%
45 Thailand 1.8% REAL GDP FORECAST 2021 (% YOY)
46 Russian Federation –5.6% WTO World Bank OECD IMF Average
47 Saudi Arabia –9.6% World 5.1 4.0 5.6 6.0 5.2
48 United Kingdom –14.2% Advanced Economies 3.3 5.1 4.2
United States of America 5.9 3.5 6.5 6.4 5.6
49 Malta –19.4% Euro Area 3.7 3.6 3.9 4.4 3.9
50 Cyprus –19.5% Emerging Markets 5.0 6.7 5.9
East Asia and Pacific 6.1 7.4 4.9 6.1
China 7.9 7.8 8.4 8.0
Latin America 3.8 3.7 4.6 4.0
North Africa & Middle East 2.1 3.7 2.9
Sub-Sahara Africa 2.6 2.7 3.4 2.9
Switzerland 3.5
The table shows the annual rates of change World Trade Volume 8.0 8.4
in exports of goods to various countries on
the basis of the latest official data available
(January, February and March 2021). These are the estimates of the relevant international organisations of the real, inflation-adjusted gross
The data are pre-adjusted for seasonal and domestic product for various regions of the world for 2021. Following a decline of 9.2% in 2020, the WTO
working-day factors; in nominal USD. expects the volume of world trade to grow by 8.0% in the current year.FORWARD-LOOKING STATEMENTS
ABOUT THE EULER HERMES EXPORT FORECAST
The statements contained herein may include views, statements
The Euler Hermes Export Forecast takes into account a large about future developments and other forward-looking statements
amount of data that is relevant in the context of the Swiss that are based on the present opinions and assumptions of
export industry. It factors in leading indicators for industry, management and involve known and unknown risks and uncer-
transport and the financial and commodity markets as well tainties. Actual results, performance or events can differ signifi-
as new sentiment indicators. Around 100 components are cantly from those that are explicitly or implicitly included in such
incorporated into a dynamic, predictive model, in which data forward-looking statements. The following factors could cause
series with a stronger lead time are given a higher weighting. such differences (list not exhaustive): (i) changes in the economic
The Euler Hermes Export Forecast has a lead time of up to conditions and the competitive situation, especially in the Allianz
six months in comparison with the actual exports of the Swiss Group’s core business areas and markets, (ii) financial market
export industry. developments (especially market volatility and liquidity and credit
events), (iii) the frequency and severity of insured claims, including
as a result of natural disasters, and the development of claims
expenses, (iv) mortality and morbidity rates and trends (v) persis-
tence levels, (vi) the extent of credit defaults, especially in the
EULER HERMES SWITZERLAND banking business, (vii) interest rates, (viii) exchange rates, including
the EUR-USD exchange rate, (ix) changes in laws and regulations,
Euler Hermes is the global market leader in credit insurance and
including tax regulations, (x) the effects of acquisitions, including
a recognised specialist in the areas of bonding, guarantees and
associated integration issues, and reorganisation measures, and
fidelity insurance, including cyber-crime. The company has more
(xi) general competition factors at a local, regional, national and/
than 100 years of experience and offers its business-to-business
or global level. Many of these factors may become more likely or
customers a range of financial services to support them with their
more pronounced as a result of terrorist activities and their con-
liquidity and receivables management. Via its proprietary moni-
sequences.
toring system, Euler Hermes follows and analyses the insolvency
trends of small, medium-sized and multinational companies on a
NO OBLIGATION TO UPDATE
daily basis. In total, its expert analyses cover markets that account
for 92% of global GDP. Headquartered in Paris, the company is
The company is under no obligation to update the information
present in 50 countries with more than 5,800 employees. Euler
or forward-looking statements herein, with the exception of the
Hermes is a subsidiary of Allianz and has a Standard & Poor’s
information prescribed by law.
rating of AA. In 2020, Euler Hermes insured business transactions
worth some EUR 824 billion around the world. Euler Hermes
Switzerland employs around 50 staff at its headquarters in
Wallisellen and its other locations in Lausanne and Lugano. Picture credits: Julius Silver
Euler Hermes Switzerland Richtiplatz 1 8304 Wallisellen T +41 44 283 65 65 info.ch@eulerhermes.com www.eulerhermes.ch
Office Lausanne Avenue Gratta-Paille 2 1018 Lausanne T +41 21 643 74 20
Office Lugano Via Antonio Adamini 10A 6900 Lugano T +41 91 922 73 64You can also read