March 25, 2021 - SLM Solutions

Page created by Janet Oliver
 
CONTINUE READING
March 25, 2021 - SLM Solutions
March 25, 2021

                 1
This Presentation has been produced by SLM Solutions Group AG (the “Company”), has not been verified independently, and is provided for information purposes only.
This document contains certain forward-looking statements relating to the business, financial performance and results of the Company and/or the industry in which the
Company operates. Forward-looking statements concern future circumstances and results and other statements that are not historical facts, sometimes identified by the
words “believes”, “expects”, “predicts”, “intends”, “projects”, “plans”, “estimates”, “aims”, “foresees”, “anticipates”, “targets”, and similar expressions. The forward-looking
statements, including assumptions, opinions and views of the Company or cited from third party sources, contained in this Presentation are solely opinions and
forecasts which are uncertain and subject to risks. A multitude of factors can cause actual events to differ significantly from any anticipated development. Neither the
Company nor any other person guarantees that the assumptions underlying such forward-looking statements are free from errors, and neither the Company nor any
other person accepts any responsibility for the future accuracy of the opinions expressed in this Presentation or the actual occurrence of the forecasted developments.
No representation or warranty (expressed or implied) is made as to, and no reliance should be placed on, any information, including projections, estimates, targets and
opinions, contained herein, and no liability whatsoever is accepted as to any errors, omissions or misstatements contained herein, and, accordingly, neither the
Company nor any of its affiliates nor any of their respective officers, employees or advisers accepts any liability whatsoever arising directly or indirectly from the use of
this document.
By reviewing this Presentation you acknowledge that you will be solely responsible for your own assessment of the Company, the market and the market position of the
Company and that you will conduct your own analysis and be solely responsible for forming your own view of the potential future performance of the Company’s
business.
This Presentation speaks as of March 25th, 2021. Nothing shall under any circumstances create any implication that there has been no change in the affairs of the
Company since such date. The Company disclaims any obligation to update or revise any statements, in particular forward-looking statements, to reflect future events or
developments.
This Presentation is not a securities prospectus and does not contain all information with regard to the Company and/or its securities that may be essential to make an
investment decision with respect to the Company’s securities. An investment decision must be based solely on any related securities prospectus that is made available
on the Company’s website in the future. Such prospectus will also include a description of the risks specific to the situation of the Company and/or the offered securities
which are material for the taking of any investment decisions.
This Presentation does not constitute or form part of and should not be construed as an offer or invitation or recommendation to, purchase or sell or subscribe for, or as
any solicitation of any offer to purchase or subscribe for, any securities of the Company, in any jurisdiction. Neither this Presentation, nor any part thereof or anything
contained or referred to therein, should form the basis of or be relied on in connection with, or serve as an inducement in relation to, a decision to purchase or subscribe
for or enter into any contract or make any other commitment whatsoever in relation to any such securities.
The securities of the Company have not been and will not be registered under the U.S. Securities Act of 1933, as amended, or the securities laws of any state in the
United States of America and may not be offered or sold in the United States of America, except pursuant to an applicable exemption from registration.

25.03.2021                                                                                                                                                                         2
The Numbers
▪   26% Revenue growth to €61.8m in a tough COVID impacted
    environment
▪   43% EBITDA improvement to €(14.8)m
▪   2 more world firsts to add to our list
     o   12 laser technology
     o   First >1,000 cc/hour build rates
     o   Game changer for the industry
▪   20% of revenue re-invested into R&D
▪   >30M order backlog, of which >90% is for multi-laser technology
         ▪    Significant customer wins in key industries
         ▪    Strength in industrial diversity
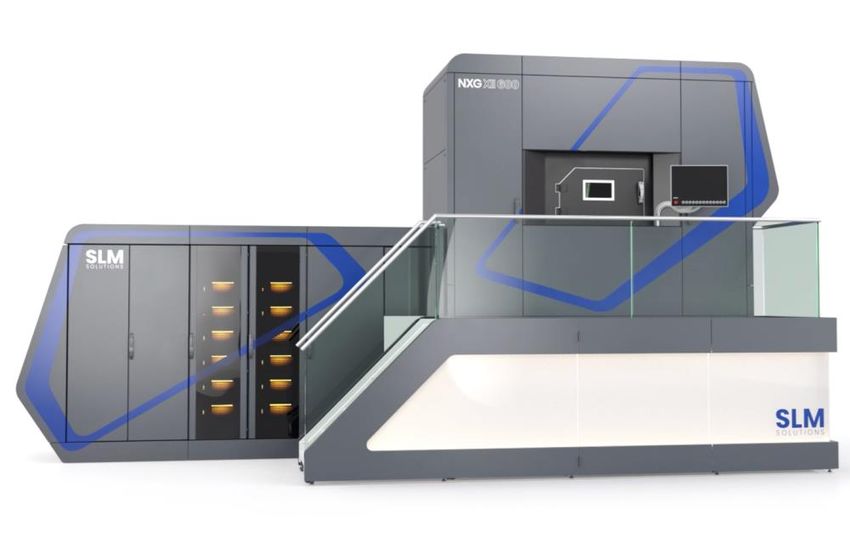
▪   NXG XII 600 response overwhelming; with the NXG XII 600 metal
    AM is moving into core industrial 4.0 production processes

                                                                      Housing for an electric drive by Porsche AG, printed on NXG XII 600
                                                                                                                                            3
Today: Traditional manufacturing market                                               Total global Additive
                    $300bn+                                                                  Manufacturing
                                                                               $46bn                 market

                                                                                          Expected to grow
                                                                                              at 25% CAGR
                                                                                                until 2030E

                        $12bn
                                                                                              Global Metal
                                                                               $10bn           AM market

                        $2.3bn                                                           Expected to grow
                                                                                             at 28% CAGR

                         2019                                                  2025
Source:   Wohlers Report, AM Power Report 2020, Equity Research, GS Research                                   4
At the very core of the Industry 4.0 disruptive manufacturing and
             production revolution
                         Conventional Casting                                            Additive Manufacturing

                  Overdesigned                          ✓ Higher performing products
    Product                                                                                                 Improvement of performance
                                                         ✓ More complex geometries
 Characteristics  Poor material properties                                                                 without design limits
                                                         ✓ Reduced weight

                                                         ✓ Prototype within days
          Lead    18 – 24 months for product launches                                                      Substantially shortened time
                                                         ✓ 3 weeks for first parts
          Time    Prototypes expensive and slow                                                            to market
                                                         ✓ Easy modifications

     Process      Prototyping resource intensive        ✓ Print part as needed                             Optimized working capital and
    Efficiency    Large batch processing                ✓ Minimized waste and tooling                      cash conversion cycle

                                                         ✓ 24 / 7 inhouse production
                  Global and complex supply chain
      Supply                                             ✓ Manufacturing cost largely independent of        Localization prevents supply
                  Pollution from transportation from
      Chain                                                country with less transportation                 chain disruptions
                   LCC sourcing
                                                           requirements

                 Significant pollution from effluents   ✓ Near zero waste
 Environmental                                                                                              Supports the transition to
                 Very high energy consumption           ✓ Low energy consumption
 Considerations                                                                                             greener manufacturing

Source:    SLM                                                                                                                              5
Components produced with AM with substantially better environmental footprint

                            Lower
      Waste                energy                   Greener                      Leaner
    reduction            consumption              components                  supply chains

  Near zero waste                             Design flexibility results   Enables local-for-local
     produced          Requires less energy
                                              in significant reduction     production and reduces
                         than traditional
 Metal powder up to                           of weight and assembly        dependency on global
                      manufacturing methods
   95% recyclable                              steps of components             supply chains

                                                                                                     6
High mechanical properties combined with great degree of geometric freedom
Superior mechanical properties…                                                            …make LPBF the leading AM technology today and tomorrow
                                                                                                                                           Metal Binder
                 ▪ Size of parts only limited by machine chamber size                                                                       FDM Jet

                                                                                             Installed base (units) by
   Size /        ▪ Outperforming in terms of absolute size and variability of                                              Direct Energy                   Other
 Geometric         part thickness                                                                                                                 2%

                                                                                                 technology 20191)
                                                                                                                              Deposition     6%
  Freedom        ▪ Geometry complexity is for free, allowing for topology                                                                         3%
                   optimization that is without limits                                                                                              1%

Mechanical ▪ Constantly high mechanical properties                                                                                                                   (Laser) Powder
           ▪ Low porosity
Properties ▪ High density                                                                                                                                            Bed Fusion
                                                                                                                                                         88%

                                                                                                                                                                             60%
   Wide          ▪ Compared to all other additive technologies LPBF offering

                                                                                             Investment related to
  Material

                                                                                               AM in next years2)
                   greatest number of input materials.
  Choice         ▪ Any material that can be welded can be processed
                                                                                                                                            20%                22%
                                                                                                                             9%
                 ▪ Little to no post-production increases “first time right
                   potential”
 One Step-                                                                                                                 Electron     Directed           Binder Jet    Laser Powder
                 ▪ Enabling thin wall sections
 Processing      ▪ Consistently accurate geometrical output due to                                                       Beam Powder     Energy                           Bed Fusion
                   controlled and predictable part shrinkage and distortion                                               Bed Fusion   Deposition

Notes:   1) AM Power. 2) Survey by Barnes Global Advisors: “What capital equipment related to metal AM does your company plan to purchase in the next 2-5 years?”                       7
12 lasers designed for serial production

20x faster                                                           12 Lasers
than a standard single laser system                            1000 Watts each

5x faster                                                         Zoom function
than the SLM quad-laser machine                   build up rate up to 1000 cm3/h

Designed for                                                          Capable of
serial production                                          large layer thickness

Optimized for large parts and                                  Fine features and
high-volume production                                delicate patterns possible

                                                                                   8
SLM’s current generation of machines is already at the
      top level of productivity for Metal AM machines…                            … but SLM’s NextGen machine will be a gamechanger

          Build rate                             Letters represent selective         Build rate
           (cm³/hr)                                   competitor machines             (cm³/hr)

      200                                                                         >1,000
                                                                                                                                   SLM NXG XII 600
                                       SLM 500        SLM 800                       900
                                                                                    800
          150              E                 A
                                                                                    700
                                                                       B (#2)       600
                                SLM 280
          100                              D (#2)               C                   500
                                                                                                                           +500%
                                                                                    400                                    productivity
                                                                                                                           increase
                                                                                    300
          50           B (#1)                                                                     SLM 500
                                                                                    200                                SLM 800
                           D (#1)
                SLM 125
                                                                                    100

             0.00               0.04          0.08            0.12         0.16         0.00       0.04     0.08    0.12    0.16     0.20    0.24

                                       Build chamber (m³)                                                    Build chamber (m³)

Source:    Company information, SLM research                                                                                                         9
Business Case and technical             Technical acceptance       Machine configuration and
                           requirements                           criteria                     contract

   >25k
 Launch landing                                                                                          Reported in backlog
   page visits

                                                                                                       Typical ITO time:
                                                                                                         ~ 6 months

    ~50
   dedicated
   customer
   meetings
               Product Introduction            MoU /                    Benchmark builds and
                                           Reservation fee                   analysis
                                         Reported as committed units

Current commitments cover a significant portion of the 2022 manufacturing capacity
                                                                                                                               10
Serving a broad range of blue chip customers
      Installed base by region

                21%
                                                                            Serving more than
                                                                            blue chip customers                     150
                                                               EMEA         including Fortune 500 companies, Dax30 companies,
                                                               NA           some of the largest OEMs as well as leaders in space
                                                                            exploration, aviation, electro mobility, motor racing,
                                                      55%      APAC         science, and many more…
                 24%

      Installed base by machine type

                   19%                      19%

                                                            SLM®125
>50% of IB                                                  SLM®280
multi laser
                                                            SLM®500 & 800
>90% of Backlog
multi laser                                  62%

   Source:    SLM
                                                                                                                                     11
   Note:      Installed machine base as of end 2020
SLM with superior technological capabilities
                                                                                             Velo3D                    Desktop Metal¹

    Technology                                            Powder Bed Fusion              Powder Bed Fusion                Binder Jetting

    Support Free                                                     Yes                        Yes                       Not applicable

                                                     Production of high value /       Production of high value /   Mass production of low-cost /
    Applications
                                                    high complexity metal parts      high complexity metal parts       low complexity parts
                                                 Aerospace, auto, energy, medical,
    Industry Diversification                                                             Aerospace, energy            Auto, general industry
                                                             research
                                                          >400 publications
    IP Portfolio                                                                        130 granted patents

    Technology Heritage                                         20 years                       7 Years                       6 Years

    Machine Portfolio                                       5 (1 to 12 lasers)            2 (2 to 8 lasers)                     3

                                                   600 mm X 600 mm X 600 mm
    Maximum Build Size                                                                  Ø 600 mm x 550 mm              490 x 380 x 260 mm
                                                       40% Larger than Velo

    Proven Productivity                                        >1,000 cc/h
SLM with significantly more advanced fundamentals

                                                                    Velo3D        Desktop Metal¹

    Installed Base (# machines)                              >650     10%    450    ~100                 ~300

    In-house Manufacturing                                   Yes      No                   No

    Global Sites (#)                                          4        1                    1

    Direct Global Sales                                      Yes      No                   No

    Revenue 2020 (€m)                                        €62m    ~€16m               ~€14m

    Revenue Growth 2020 (%)                                  26%      21%                 -38%

Source:   SLM, Velo3D disclosure, Desktop Metal disclosure
                                                                                                                13
Note:     1) Focus on Desktop Metal’s Binder Jet segment.
Fiscal Year 2020

                   14
Continued progress on turnaround path
in €m          Revenue                         EBITDA

                         +26%   Guidance         2019    2020
    At least
    20% YOY
     growth                                              (14.8)

                         61.8
                                 Between        (26.0)
               49.0             (13) to (18)

   Guidance    2019      2020
                                                                  15
Solid foundation to continue growth story
        Order In-take                                    Backlog                               Selected Financials
                                                                                               in €m                                2020             2019         Change
          46.1
                                                                                               Machines Revenue                      45.1            35.1           28%
                                                                                               After Sales Revenue                   16.6            13.8           20%
                                                               35.0                            Gross Profit                          53%             53%             0pt
                                                30.2                       29.6                Personnel expenses                   (35.6)          (31.9)          12%
                                                                                               Other Exp. & Income                  (13.0)          (17.6)         (26)%
in €m

                                                                                               EBITDA                               (14.8)          (26.0)         (43)%
                       13.7                                                                    Op. Cash-flow                         (3.4)            3.5             U
                                                                                               Working Capital                      24.4             36.8          (34)%
                                                                                               Cash                                  18.9            25.5          (26)%

                                                                                               • Personnel expense h due to hiring of key talent
         2020          1H20                    2020           2019      2019 Adj-1)            • Other expense i due to more cautious spending
                                                                                               • Working Capital i due to operational excellence
   • Order-Intake in 2H more than doubled vs 1H reflecting                                       initiatives, increase in 2021 due to NXG ramp-up
     ongoing improvement in key markets & industries                                           • Initiated 2nd tranche of convertible 2020/26 (€15m)
   • Backlog up        YoY-2)   if €5.6m adjustment in 2Q20 considered                           to strengthen balance sheet
   F = Favorable (change >100%); U = Unfavorable (change
High operating leverage & NXG introduction
Currently: Negative EBITDA largely driven by high non-      Illustrative: Revenue increase resulting in significant
material costs (R&D, admin) relatively to revenue           operating leverage due to decoupling of non-material costs

                                                                          Constant               Moderate       Significant
                                                               +100%                   +100%
                                                                           margin                increase      Improvement

  Revenue     Cost of      Gross    Non-material   EBITDA     Revenue      Cost of     Gross    Non-material    EBITDA
             materials     profit      costs                              materials    profit      costs

                                                                                                                              17
Continued progress on turnaround path
          2021 Guidance                                                       2025E expected market size

                                                                                                           Total global Additive Manu-
                            2020                2021          2022 +
                                                                                                               facturing market in 25E

                                             at least                                      $46bn                     Expected to grow
                                                           Further                                                  at 25% CAGR until
           Sales          €61.8M            15% YoY-1)
                                                         acceleration                                                          2030E
                                             growth

           EBITDA        €(14.8)M              Further improvement                                                       Global Metal
                                                                                                                          AM market

                       Assuming no drastic deterioration of                                $10.4bn                   Expected to grow
                         the current COVID-19 situation.                                                                 at 28% CAGR

                                                                                                                    SLM market share
                                                                                             ↑

Source:   SLM, Wohlers Report, AM Power Report 2020      1-) Year-over-year                                                              18
SLM - a leader in the high growth and highly innovative AM technology sector
       ▪ Current market size ~$12bn with CAGR of 28% until 2025
       ▪ Accelerated demand for AM due to reshoring and the need for more flexible supply chains
Our sole focus: Superior Laser Powder Bed Fusion
      ▪ Technology addresses most innovative and most attractive segments of the AM market: High precision, high performance parts across key regulated and
          unregulated industries
      ▪ SLM features one of the strongest IP portfolios and R&D and engineering teams in the sector, consistently investing leading industry innovation (~20% of
          revenue in R&D (2020))
SLMs is at the very core of the Industry 4.0 disruptive manufacturing and production revolution
      ▪ Fast evolving ecosystem around SLM’s core metal printing technology: engineering capabilities, software, powder, process technology
      ▪ AM helps to significantly improve the ecological footprint of products and metal manufacturing process (energy and raw material savings)
SLM’s NXG XII 600 machine is a game changer for the entire AM industry
       ▪ Worlds fasted and most efficient large platform PBLF printer launched in Nov 2020
       ▪ High precision, high performance, high value parts produced cost competitively compared to conventional processes (metal subtraction, casting)
Sizable service business opportunity
       ▪ Currently over 650 machines installed, containing over 1,000 lasers
       ▪ Machines in industrial processes generate significant constant revenue stream from service and powder
Strong international management team of growth and technology experts
      ▪ New management refocused company on growth and technology and manufacturing excellence
Poised for continuous growth
      ▪ > €30m backlog and NXG ramp up underpins SLM’s growth trajectory
      ▪ Attractive and expanding gross margins
      ▪ Significant operating leverage. The business is set up for growth
      ▪ Core shareholder group supports growth trajectory with funding
                                                                                                                                                                   19
20
You can also read