Investor Presentation - First Half 2017 - Grupo Bimbo

Page created by Corey Clarke
 
CONTINUE READING
Investor Presentation - First Half 2017 - Grupo Bimbo
Investor Presentation
           First Half 2017
Investor Presentation - First Half 2017 - Grupo Bimbo
A Global Branded Consumer
Products Company and the leader
      in the baking industry

                              2

                              2
                                  2
Investor Presentation - First Half 2017 - Grupo Bimbo
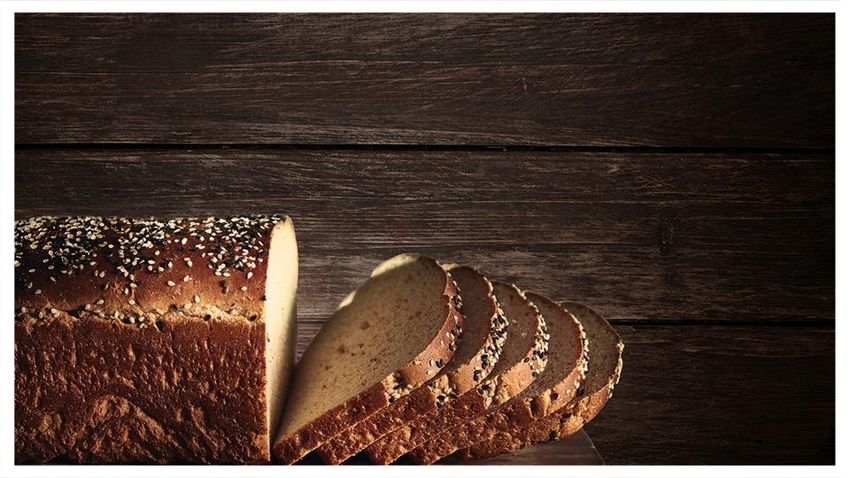
Control Group: 75%                                                                                                Market Cap: US$12.4 bn1
Float: 25%

   LTM2Q17 Revenues2                    Countries          Plants       Routes    Sales Centers      POS         Associates   Brands    Products

         US$13.7 Bn                          24              175        ≈56,000      ≈1,700       ≈2.9 million   ≈133,000     ≈100       ≈13,000

              North America                                             Mexico
                                                                        Mexico            Latin America              EAA               China

            U.S.                      Canada

______________
1.   As of July 26, 2017. Expressed in US$ at the FX of $17.59 Ps./US                                                                              3
2.   Converted to US$ with the average FX rate of that period                                                                                          3
Investor Presentation - First Half 2017 - Grupo Bimbo
Successful Growth Story
                                                                                     2017

                                                                                   2016
                                                  Frozen Argentina

       45+ acquisitions                                                     2015
        in the last 10 years                                         2014

                                                  2011

                                           2009
                                     00s
                               90s
                         80s
       50s   60s   70s
1945
                                                                                            4
                                                                                             4
Investor Presentation - First Half 2017 - Grupo Bimbo
A WELL BALANCED BUSINESS WITH A STRONG
                      LEADERSHIP POSITION IN EACH MARKET

Canada                                                                                                                                            Europe, Asia & Africa
•     #1 in buns & rolls                                                                                                                          •    #1 in bread & rolls in Spain
•     #1 in breakfast                                                                                                                             •    #1 in bread in Portugal
•     #2 in bread                                                                                                                                 •    #1 in sweet baked goods in
                                                                                                                                                       Spain & Portugal
United States                                                                                                                                     •    #1 in bagels in the U.K.
•     Leader nationwide                                                                                                                           •    Baking leader in New Delhi
•     #1 in premium brands                                                                                                                             and surroundings
•     #1 in English muffins                                                                                                                       •    Pioneer in developing
                                                                                                                                                       packaged baked goods in
•     Strong regional brands
                                                                                                                                                       Beijing and Tianjin

Mexico
•     #1 in packaged baked
      goods
•     #2 in cookies and crackers                                                                                                                                          Developed
•     #2 in salty snacks                                                Latin America                                               Emerging                              markets
•     #2 in confectionary                                               •   #1 in packaged baked goods                              markets(1)
                                                                            in 15 countries
                                                                                                                                                                           58%
                                                                                                                                             42%

    ______________
    Source: Nielsen, IRi and Company filings                                                                                                                                          5
    1. In Mexican pesos. Includes India and Morocco sales figures announced on the 1Q17 report. Eliminations have been removed from Mexico’s results
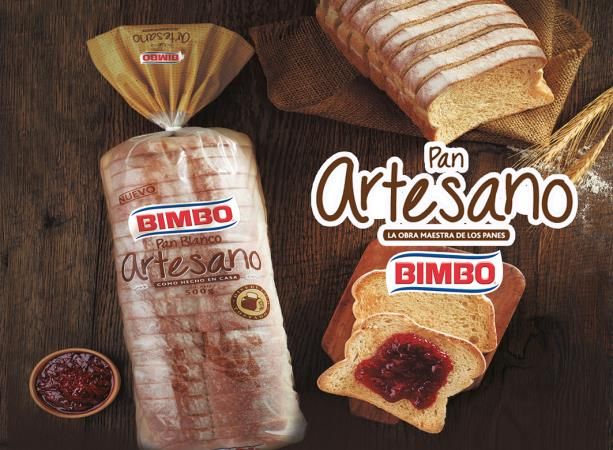
Investor Presentation - First Half 2017 - Grupo Bimbo
OUR MISSION

              6
Investor Presentation - First Half 2017 - Grupo Bimbo
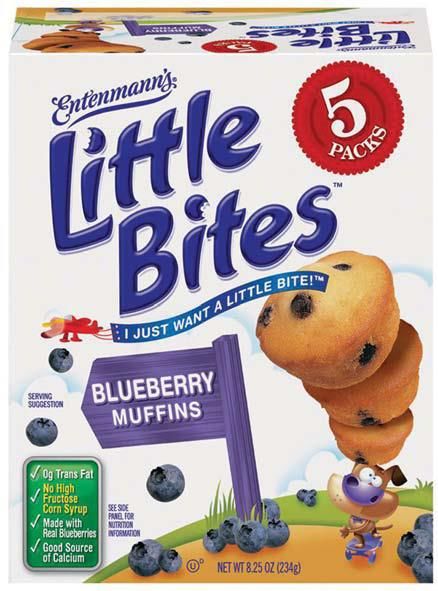
SPACE TO GROW IN A VERY FRAGMENTED MARKET
                                                     Global Bakery Landscape 2015*

                                                                                                         49
                                     Artisanal                                                                  GB represents

                                                                                                         8
                                                                                                                  3.7%
                                                                                                                 from global
                                                                                             Campbell
                                  Private Label                                                   6
                                                                                                         40
                                                                                                                    market
                                                                                              Kellogg
                                                                                                 8
                                      Others                                      Yildiz 3
                                                                                 Mondelez      22
                                                                                               22
                                                                    Yamazaki 4       16         <
                                   Grupo Bimbo 5%             3        5            1           1       3.7%
                                         Bread              Cakes   Pastries     Cookies     Crackers   TOTAL

                       Ranking Bimbo                  1       1         1           16          -         1

                     Top 5 market share               8%     7%        12%          24%        39%       10%

______________
Source BCG. Analysis * Breakfast cereals excluded.
                                                                                                                                7
                                                                                                                                    7
Investor Presentation - First Half 2017 - Grupo Bimbo
LONG RUNWAY FOR GROWTH GLOBALLY THROUGH PENETRATION
                   AND FREQUENCY

                                                                 • 11th place
                                                                 • Household
                                                                  penetration: 6.4%
Penetration (%)

                                                                                 13.2
  Household

                                                                 • Frequency :

______________                                                                          8
Source: KantarWorld Panel Brand Footprint 2016 - Food Category
                                                                                         8
Investor Presentation - First Half 2017 - Grupo Bimbo
OUR VISION

             9
                 9
Investor Presentation - First Half 2017 - Grupo Bimbo
KEY CAPABILITIES   1
                       2
                           3
                               4
                                   5

                                       10
                                            10
Seasoned Management Team and Sound Governance
                                                                                               Management
                                                                                               •   Positioned the Company as market leader in the categories and
                                    Daniel Servitje                                                countries with presence
                               Chairman of the Board                                           •   Proven track record of stability and sustainable growth
                                                                                               •   Successfully completed and integrated over 45 acquisitions over the
       Audit Committee                    Results and                  Finance &
                                                                                                   last 10 years
       and Corporate                      Evaluation                   Planning
       Practices                          Committee                    Committee
       (5 independent                     (5 members,                  (6 members,             Governance
       members)                           1 independent)               1 independent)          •   Corporate Governance aligned with shareholders’ interest
                                                                                               •   35% of board members are independent
                                    Daniel Servitje                                            •   3 corporate committees
                                           CEO

     Javier A. González               Pablo Elizondo                  Gabino Gómez
                                                                                               Social Responsibility
      Executive VP of                 Executive VP of                 Executive VP of
       Grupo Bimbo                     Grupo Bimbo                     Grupo Bimbo             •   Named one of the “World’s most ethical companies in 2017” by the
                                                                                                   Ethisphere Institute
                                                                      Raúl Argüelles
      Guillermo Quiroz                Reynaldo Reyna
                                    Chief Global Services
                                                                      Chief HR and             •   GB ranks among the most respected companies of the world1
            CFO2                                                     Corporate Affairs
                                                                                               •   Reputation built on a strong corporate identity and brand equity
         Fred Penny                Miguel Ángel Espinoza              Ricardo Padilla
        BBU President                 Bimbo President                 Barcel President         •   Key component of GB’s corporate identity is its company-wide Social
                                                                                                   Responsibility Program
                         Raúl Obregón             José Gabriel Calderón
                          Chief Global             Chief Global Auditing
                                                                                               •   Complies with WHO’s Global Strategy on Diet and Physical Activity &
                         Transformation                   Officer                                  Health
_______________
1.   According to the Reputation Institute                                                                                                                        11
2.   Diego Gaxiola to assume role of CFO upon the retirement of Guillermo Quiroz on August 1st, 2017                                                                   11
ENDURING MEANINGFUL BRANDS

5
Billion
Dollar
Brands
                                               2
                                       >$500
                                 million dollar
                                       brands
                                          12
                                               12
ENDURING MEANINGFUL BRANDS

                             13
                              13
KEY CATEGORIES
Packaged bread                      Solutions
sliced bread, premium, buns &       tortillas, pitas, wraps, pizza base,
rolls, breakfast and frozen bread   tostadas and totopos

Sweet baked goods
cakes and pastries
                                    Prepackaged foods

Cookies                             Confectionary
sweet cookies and crackers

 Salty snacks                       Other

                                                                           14
                                                                           14
A SAMPLE OF OUR PRODUCTS

                           15
                                15
UNIVERSAL PRESENCE WITH SUPERIOR EXECUTION

        79+              Guarantees quality   Exceptionally serves more     Commitment to
Trips around the Earth     and freshness       than 2.9 million points of   local execution
                                                         sale
         daily                                                                       16
                                                                                          16
Exceptional Manufacturing Capabilities

        46+                     175                 Focus in low-cost
million pieces are   State-of-the-art facilities   manufacturing and
 produced daily         across our markets             efficiency
                                                                        17
                                                                             17
Winning Innovation in Products and Processes

  We are developing products and
categories in line with new megatrends

                                           18
                                             18 18
OUR CA PABILITIES A RE GROUNDED ON OUR
       COMMITMENT WITH SUSTAINABILITY

   Not a department or                 Focusing on four pillars
   function, but rather a              integral to our strategy
       way of doing                     and overseen by the
          business                      Sustainability Central
                                             Committee

  This is how we reach our Vision, fulfill our Mission and meet our
                             Purpose:

To Build a Sustainable, Highly Productive and Deeply
                  Humane Company
                                                                      19
                                                                           19
Strong Financial Performance
  Revenue Growth1                                                                     Adj. EBITDA Growth1
  US$ millions                                                                        US$ millions

                          14,064
                                                                                                                             1,570    1,517
                                       13,818                                                                        1,467
             13,786                                                                                  1,351   1,370
                                                                 13,706
                                                    13,514                                1,070

13,164

 2012         2013         2014         2015         2016      LTM 2Q17                   2012       2013    2014    2015    2016    LTM 2Q17

                                                                                    GB    11.0%       8.1%   9.8%     9.8%   10.2%    11.1%

                                                                                Mexico    14.3%      13.8%   15.8%   16.7%   17.6%     18.6%

                                                                          North America   9.8%        6.4%   7.3%     6.2%   8.3%      9.5%

                                                                          Latin America   1.7%       -1.1%   0.7%     3.9%   2.1%      0.8%

                                                                                   EAA    -18.6%     -8.7%   -3.8%   -0.9%   -4.4%     -1.6%

____________________                                                                                                                           20
1.Figures converted to USD using the 12M average FX rate for each year                                                                              20
Cash flow stability across time allows long term
   Margins Evolution %
                       planning
         EBIT Margin             Adj. EBITDA Margin          Gross Margin

                                               56.2   56.7
53.3                                    54.8                 53.7   53.3          54.0   53.4                                                            53.3   54.0   53.9
                                 53.1                                      53.0                 52.8          52.8   52.8                  52.3   53.0
                          51.2                                                                         51.1                 51.0   50.7
        48.6     47.9

                                                                                                                                          Integration/transformation
                                                                                                                                                 efforts & IFRS

13.0                      13.5   13.8   13.7   14.1   13.6                        12.8                        13.6   13.2
                 12.3                                                      11.1          12.0   12.0   11.9                 11.0                                11.6   11.1
        9.5                                                  10.7   10.3                                                                    9.8   9.8    10.7
                                                                                                                                   8.1

9.7                        9.3   9.7    9.9    10.3   9.7                         9.3    9.2    8.9    8.9    10.4   9.7
        7.0       8.2                                        7.2    7.1    8.0                                              7.1                                 7.2    6.7
                                                                                                                                   4.3      5.9    5.5   6.4

                   Best-in-Class execution combined with a relentless focus on low cost
                    operation in a resilient industry results in financial stability over time
  ____________
  * Figures after 2011 in IFRS
                                                                                                                                                                              21
                                                                                                                                                                              21
Responsible Financial Policies
•     Commitment to a strong Balance Sheet              Dividend History
                                                        MXN millions
•     Ongoing financial flexibility through a
                                                               Ordinary Dividends
      US$2 billion multi-currency revolving
                                                               Extraordinary Dividends
      credit facility
                                                                                                  1,6461
•     Reinvestment as the pillar             of   the
                                                                                                                                 1,364
      Company’s long term view
                                                                                                                         1,129
•     Conservative Risk Management policy
      aligned with the Company’s strategy
                                                                                     706
       •     Mitigate exposure to raw material                 541 541       588 647                      776
                                                        470
             cost fluctuation
       •     Conservative approach towards FX
             and interest rate risks                                                                        -      -
                                                        2007   2008   2009   2010   2011   2012    2013    2014   2015    2016   2017

    ____________
    1.   Paid in advance for 2014 and 2015
                                                                                                                                         22
                                                                                                                                         22
Responsible Financial Policies
    Debt Amortization Profile1                                                                   Currency Mix
    US$ millions                                                                                 %
    Total Debt: US$4,085 mm
                                                                                                               3%
    Avg. Tenor: 7.8 yrs.                                                                                 11%
    Avg. Cost: 4.7%

                       2152

                                                                                                 24%
                                                                                                                           62%
                        800              800               800
                                                                            447            500
      279
                                 114

2017 2018 2019 2020 2021 2022 2023 2024 2025 2026 … 2044                                               USD     CAD   MXN         EUR
                  Local Bonds              Bank Loans             Foreign Bonds

   ____________
   1.   Does not include debt at subsidiary level of US $141 mm, except for Bimbo Canada
   2.   Debt at Bimbo Canada level for the acquisitions of Vachon, IHB and Stonemill                                                   23
                                                                                                                                        23
RECENT ACQUISITIONS
                        Producer of sweet baked goods and buns & rolls in Spain and
                        Portugal

•       Revenue growth of ≈70% in the                                          Strong
        region                                                                 Brand
                                                                               Equity
•       Synergies of €(40 – 50) million1
•       Integration expenses: ≈€70
        million
•       High single digit pro-forma
        EBITDA margin(1)

____________
1. Expected to be achieved in 30 months after the closure of the acquisition            24
                                                                                        24
RECENT ACQUISITIONS

•   Marroquin Company        •   Producer of slow      •   The baking leader in
    specialized in baked         crafted baked bread       New Delhi and its
    goods                        in Toronto, Canada        surrounding areas
•   Estimated anual sales:   •   Estimated anual       •   JV for 65% of stake
•   US$ 11mm                     sales:                •   Producer of packaged
•   3 Plants                 •   CAD$ 18mm                 bread, pizza bases, and
•   More than 200            •   1 Plant                   sweet and savory buns
    associates               •   Around 100            •   Annual sales: US$ 48mm
                                 associates            •   4 plants
                                                       •   More than 400
                                                           associates

                                                                                 25
                                                                                 25
EAST BALT ACQUISITION AGREEMENT*

                                             Leading foodservice-focused company that supplies baked goods to Quick
                                             Service Restaurants (“QSR”) across the world

                                            Operates 21 bakeries in 11 countries     2,200 associates

               Product Portfolio                                    Main Customers                      Financials
  Traditional
  Buns and                                                                                               LTM June’17        5yr. CAGR1
  Muffins
                                                                                      Sales               ≈US$420 million     3.6%
  Rolls,
  Tortillas,                                                                          EBITDA              ≈ US$70 million     7.4%
  Bagels,
                                                                                      EBITDA Margin       ≈ 16.7%              -
  Artisanal,
  Frozen,
                                                                                      Purchase Price2     US$650 million       -
  among
  others
____________
1.    CAGR: Compound average growth rate from 2013 to LTM June’17                                                                    26
2.    Purchase price free of cash and debt
* The acquisition is subject to regulatory approvals
UNIQUE GROWTH OPPORTUNITY
              to achieve channel and geographic diversification
                                                                                                 Eastern Europe
                                                                                                 -   Ukraine
                                                                                                 -   Russia

                                                                                                         2
                                                                           Western     Europe1
                                                                           -   France
                                                                           -   Italy
                                                                           -   Switzerland

                                                                                   5                                                 Asia
                                                                                                                                     -   China
                                                                 United States                                                       -   South Korea
Sales Breakdown by Region
                                                                       3                                                                     7
                                      United
Rest of the
                                      States
  World
                                       32%                                                                   Middle East & Africa1
   43%
                                                                                                             -   Turkey
                                                                                                             -   Morocco
                                                                                                             -   South Africa
                                    Asia                                                                              4
                                    25%

                              EAST BALT LEVERAGES GLOBAL EXPERTISE AND BEST PRACTICES
                                         ACROSS 21 BAKERIES IN 11 COUNTRIES
     ____________
     1. Figures include one JV in Morocco and another in Switzerland                                                                                   27
+
                  Countries   Plants       Routes           Sales Centers              POS         Associates
                     32        196         ≈56,000               ≈1,700            ≈2.9 million     ≈136,000

                                       North America
                                       -   Canada
                                       -   United States

                                                                                                        EAA
                                                                                                        -   China      -   South Africa
                                                                                                        -   France     -   South Korea
           Mexico                                                                                       -   Italy      -   Spain
                                                                                                        -   Morocco    -   Switzerland
                                                                                                        -   Portugal   -   Turkey
                                                Latin America                                           -   Russia     -   Ukraine
Grupo Bimbo today                               -   Argentina    -   Ecuador       -   Panama
                                                -   Brazil       -   El Salvador   -   Paraguay
Grupo Bimbo & East Balt                         -   Chile        -   Guatemala     -   Peru
intersection                                        Colombia                       -   Uruguay
                                                -                -   Honduras
East Balt today                                 -   Costa Rica   -   Nicaragua     -   Venezuela
                                                                                                                                    28
#ConElCariñoDeSiempre   www.grupobimbo.com/ri
                        ir@grupobimbo.com
                                           29
The information contained herein has been prepared by Grupo Bimbo, S.A.B. de C.V. (the “Company") solely for use at this
presentation. This presentation does not purport to contain all of the information that may be required to evaluate any investment in
the Company or any of its securities and should not be relied upon to form the basis of, or be relied on in connection with, any
contract or commitment or investment decision whatsoever. No representation or warranty, either express or implied, is made as to
the accuracy, reliability or completeness of the information presented herein. This presentation has been prepared solely for
informational purposes and should not be construed as containing any offer, invitation or recommendation to purchase, sell or
subscribe for any securities in any jurisdiction and neither the issue of the information nor anything contained herein shall form the
basis of or be relied upon in connection with, or act as an inducement to enter into, any investment activity. This presentation should
not be regarded by recipients as a substitute for the exercise of their own judgment in connection with any investment activity. The
merit and suitability of an investment in the Company should be independently evaluated and any person considering such an
investment in the Company is advised to obtain independent advice as to the legal, tax, accounting, financial, credit and other
related advice prior to making an investment.
 Any opinion expressed herein is subject to change without notice, and the Company is under no obligation to update or keep
current the information herein. The Company accepts no liability whatsoever for any loss or damage of any kind arising out of the
use of all or any part of this presentation. This presentation includes forward-looking statements. Such forward-looking statements are
based on certain assumptions and current expectations and projections about future events and trends that may affect the
Company’s business and are not guarantees of future performance. Investors are cautioned that any such forward-looking
statements are and will be, as the case may be, subject to many risks, uncertainties and other unknown factors, including those
relating to the operations and business of the Company. These and various other factors may adversely affect the estimates and
assumptions on which these forward-looking statements are based, many of which are beyond our control. Forward-looking
statements speak only as of the date on which they are made. The Company expressly disclaims any obligation or undertaking to
update or revise any forward-looking statement, whether as a result of new information, future events or otherwise. The Company’s
independent public auditors have neither examined nor compiled this presentation and, accordingly, do not provide any assurance
with respect to any information included herein. In light of the risks and uncertainties described above, the future events and
circumstances discussed in this presentation might not occur and are not guarantees of future performance. Neither this
presentation nor anything contained herein shall form the basis of any contract or commitment whatsoever. The information
included in this presentation may not be reproduced or redistributed, passed on, or the contents otherwise divulged, directly or
indirectly, to any other person or published in whole or in part for any purpose or under any circumstances without the Company’s
prior written consent.
                                                                                                                                          30
You can also read