AUSTRALIAN FEEDLOT SECTOR - 03 August 2017 - The Australian Grains Industry ...

Page created by Diane Arnold
 
CONTINUE READING
AUSTRALIAN FEEDLOT SECTOR - 03 August 2017 - The Australian Grains Industry ...
03 August 2017

AUSTRALIAN FEEDLOT
            SECTOR
AUSTRALIAN FEEDLOT SECTOR - 03 August 2017 - The Australian Grains Industry ...
ANZ’S SUPER REGIONAL NETWORK

                                                                                                                                                                                                                        2

ANZ has an established regional network across 33 markets which include 15 Asian markets and representation in Europe, America and
Middle East. ANZ is a leading bank in Australia and the largest bank in New Zealand & the Pacific Islands (12 markets)
   VIETNAM                                                                                                                                                                                                MALAYSIA

      LAOS                                                                                                                                                                                                HONG KONG

   THAILAND                                                                                                                                                                                               TAIWAN

   MYANMAR                                                                                                                                                                                                SOUTH KOREA

     CHINA                                                                                                                                                                                                JAPAN

                                                                                                                                                                                                          UNITED STATES OF
  GERMANY                                                                                                                                                                                                 AMERICA
    Frankfurt
                                                                                                                                                                                                          New York

     UNITED
                                                                                                                                                                                                          PHILIPPINES
   KINGDOM
     London

                                                                                                                                                                                                          INDONESIA
          UAE
       (GCC*)
                                                                                                                                                                                                          PAPUA NEW
                                                                                                                                                                                                          GUINEA
     INDIA
                                                                                                                                                                                                          PACIFIC
                                                                                                                                                                                                          ISLANDS**
 SINGAPORE

                                                                                                                                                                                                          NEW ZEALAND
  CAMBODIA

                                                                                                                         KEY:
 AUSTRALIA                                                                                                                      Commercial/               Large Corporate &
                                                                                                                                                                                  Private Banking
                Note: *GCC - Gulf Cooperation of Council countries                                                              International Banking     Institutional Banking
                **Pacific Islands comprises of Guam, Solomon Islands, Fiji, Kiribati, Samoa, American Samoa, Cook
                Islands, Timor Leste, Tonga, Vanuatu and New Caledonia. Fiji operations comprises of                            Retail Banking & Wealth   Partner Bank            Representative Office
                Commercial/International Banking, Large Corporate & Institutional Banking, and Retail Banking & Wealth          Management
                Management
AUSTRALIAN FEEDLOT SECTOR - 03 August 2017 - The Australian Grains Industry ...
CONNECTING YOU TO THE FOOD, BEVERAGE AND AGRIBUSINESS
SECTORS
                                      ANZ has been banking clients in the Food, Beverage and Agribusiness
                                      sectors since 1865 and covers stakeholders across the global supply
                                      chain

BENEFIT FROM OUR INDUSTRY             CONNECTING YOU FROM ‘PADDOCK                 PARTNER WITH ANZ TO ACCESS
EXPERIENCE AND EXPERTISE              TO PLATE’ ACROSS THE GLOBE
                                                                                   •   4 out of Australia's 5 largest milk producers
                                      •   Producers and growers                        processors

                                      •   Storage and handling companies           •   NZ’s 3 largest dairy processors accounting
                                                                                       for over 90% of NZ’s
  Dairy         Protein      Wine     •   Agricultural input suppliers                 dairy production

                                      •   Global trading houses                    •   Some of the world’s largest food and
                                                                                       beverage companies
                                      •   Transport and packing companies
                                                                                   •   Countries that receive over 85%
                                      •   Global food and beverage companies           of Australia’s live cattle exports and over
                                                                                       90% of Australia’s exported beef
 Oilseeds    Grains & rice   Cotton
                                      •   Global quick-serve food establishments
                                                                                   •   80% of Australia’s cotton exporters

                                                                                   •   95% of Australian sugar exporters

                                                                                   •   Major Food, Beverage & Agribusiness
                                                                                       markets across the Asia Pacific region thanks
  Sugar        Forestry      Cocoa                                                     to ANZ’s reach into key origin and
                                                                                       destination geographies (China, India, SEA,
                                                                                       Greater Mekong and the Pacific)

  Coffee       Rubber

                                                            3
AUSTRALIAN FEEDLOT SECTOR - 03 August 2017 - The Australian Grains Industry ...
FEEDLOT SECTOR CONTINUES TO EVOLVE

4
AUSTRALIAN FEEDLOT SECTOR - 03 August 2017 - The Australian Grains Industry ...
AUSTRALIA’S FEEDLOT SECTOR

• Important component of domestic feed complex
• Must continue to be strategic in maintaining social
  licence
• Approaching continuing consolidation
• Facing strong global competitors
• Focus of growing agri investment
• Massive agtech/data potential
• Needs to adapt with customers

                             5
AUSTRALIAN FEEDLOT SECTOR - 03 August 2017 - The Australian Grains Industry ...
AUSTRALIA ACCOUNTS FOR ~3.5% OF GLOBAL PRODUCTION AND
~15.7% GLOBAL BEEF EXPORTS…
                                                     Australia Beef Production & Slaughter
                 Australia Feedlot Capacity
                      1.2 million head               With herd re-building in progress, beef production is likely to
                                                     decrease and marginally recover through 2021
               Australia Cattle Population
                   27.4 million head                 3.0                                                                  36%

                                                     2.5                                                                  30%

                              7.7%
                                         41.4%       2.0                                                                  24%
                8.6%
                                          53.8%
                5.6%                                 1.5                                                                  18%
                                  4.2%
                                  3.3%      20.4%
                                                     1.0                                                                  12%
                                            31.4%

                                                     0.5                                                                  6%

                                  6.0%       15.1%

Note: Feedlot Capacity is                              -                                                                  -
based on March 2017 &                       2.6%
                                                             2013   2014   2015   2016 2017F 2018F 2019F 2020F 2021F
Australian Cattle Population is
as of June 2015                                            Beef Production (m tonnes cwt)   Slaughter as % of Cattle herd (RHS)

Source: MLA, ALFA

                                                            6
REDUCED AVAILABILITY OF CATTLE LED TO CATTLE HELD ON FEED
FOR LONGER PERIODS…
Cattle on Feed (‘000 head) by Feedlot Type

1,200

1,000

  800

  600

  400

  200

      -
      Mar-09          Mar-11               Mar-13                 Mar-15   Mar-17
                      < 500     500 - 1k       1k - 10k   > 10k

Source: MLA, ALFA

                                           7
EXPORTS TO EU, CHINA & MIDDLE EAST GRADUALLY INCREASED
THEIR SHARE…
Grain-fed beef exports (‘000 swt)

  80

  60

  40

  20

    -
        Q1'05       Q3'06   Q1'08   Q3'09     Q1'11       Q3'12   Q1'14   Q3'15   Q1'17
                                      Japan   Korea   Other

Source: MLA, ALFA

                                              8
~80% OF COST BASE IS MADE UP OF FEEDER CATTLE PURCHASES

    Purchases            80.7%       Industry Cost Structure

    Wages                1.4%

    Depreciation         1.5%

    Utilities            1.7%

    Rent                 0.8%

    Other               0.8%

    Profit              13.1%

Source: IBIS Research

                                 9
FEEDER CATTLE PRICES INCREASED BY ~220% SINCE 2007…

Weekly prices rebased to Sep 2007 prices

 300%

 250%

                 Saleyard Feeder Steer         QLD - OTH - Grain Fed Cattle
 200%

 150%

 100%

  50%

      -
      Sep-07      Aug-09             Jul-11           Jun-13             May-15   Apr-17

Source: MLA

                                              10
FEEDER CATTLE PRICES ARE NEGATIVELY CORRELATED WITH GRAIN
PRICES…
Price comparison of Feeder Cattle vs Wheat price (feed grade)

      500

                                       Feeder Cattle (Ac/kg lwt)               Wheat - New Castle, NSW(Ac/tonne)
      400

      300

      200

      100

         -
         Aug-09                  Mar-11                 Oct-12                 May-14                 Dec-15                   Jul-17

Source: Feeder Cattle price sourced from MLA, while Wheat (feed grade) sourced from Bloomberg database (AUWH0142 Index – New
Castle, NSW)
                                                                  11
AUSTRALIAN FEEDLOTS HAVE MEDIUM TO LONG TERM PROFITABILITY
OF 11-14%...
Short, medium and long-term net profit margins for beef feedlots (2014)

  40%

  20%

       -

(20%)

(40%)

(60%)
                         5500

                                                   7200

                                                                       1500

                                                                                                     1700

                                                                                                                  2000

                                                                                                                                3000
            430

                  520

                                            28K

                                                               75K

                                                                               26K

                                                                                               680

                                                                                                            940

                                                                                                                         15K

                                                                                                                                       75K

                                                                                                                                              25K
                                520/150

                                                                                     630/800
                    Spain                 Canada          US         Mexico Argentina Brazil Peru            China       Aus.   S Africa     Nam-
                                                                                                                                              ibia

  Short Term (Cash)          Medium Term (Cash-Depreciation)                         Long Term (Cash-Depreciation-Opportunity Costs)

Source: MLA/ Agribenchmark

                                                                              12
-
                                                                                        200
                                                                                              400
                                                                                                    600
                                                                                                          800
                                                                                                                1,000
                                                                                                                        1,200
                                                                          A -25F
                                                                            A -35
                                                                                                                                USD per 100lwt

                                                                          A -120
                                                                          G -260
                                                                          G -285
                                                                         G -525T
                                                                          G -800

     Source: MLA/ Agribenchmark
                                                                            F -60
                                                                            F -70
                                                                          F -200
                                                                         SP -430

                                                        Europe
                                                                         SP -520

                                  Cash costs
                                                                         SP -550
                                                                          UK -45
                                                                          UK -80
                                                                          UK -90
                                                                                                                                                                                             AMERICAN FEEDLOTS…

                                                                         UK -750
                                                                          IR -40
                                                                         RU -640
                                                                         CA -28K
                                                                        US -7200

                                                       US &
                                                                         US -75K

                                                      Canada
                                                                         AR -380

                                  Depreciation
                                                                         AR -630
                                                                         AR -800
                                                                         AR -900
                                                                         AR -26K
                                                                                                                                                 Cattle finishing cost benchmarking (2014)

13
                                                                          UR -90
                                                                          BR -60
                                                                         BR -360
                                                                         BR -400
                                                                         BR -680
                                                                         BR -800
                                                                        BR -1750
                                                        South America

                                                                         CO -130
                                  Opprtunity Costs                       CO -160
                                                                         CO -520
                                                                         CO -800
                                                                        PE -1700
                                                                          CH -70
                                                                         CH -150
                                                                         CH -300
                                                                         CH -940
                                                                        CH -2000
                                                        Asia

                                                                            IN -2
                                                                            IN -4
                                                                         IN -100
                                                                         AUS -65
                                                                         AUS -85
                                                                        AUS -150
                                  Regional Averages

                                                                        AUS -320
                                                                        AUS -360
                                                        Aus.

                                                                        AUS -380
                                                                        AUS -540
                                                                        AUS -900
                                                                         NZ -375
                                                                        SA -3000
                                                                         SA -75K
                                                                                                                                                                                             FINISHING COSTS IN AUSTRALIA ARE ~23% HIGHER THAN SOUTH

                                                                         NA -600
                                                        NZAfrica

                                                                         NA -25K
BEEF FEEDLOTS REVENUE IS FORECAST TO STAGNATE IN NEAR
FUTURE…
Beef Cattle Feedlot Industry Revenue (AUD bn)

                                                         4.7      4.7              4.7     4.8
                                                 4.6                      4.6
                                        4.6

                                  3.7

                            2.9
       2.7         2.7

  FY2012                 FY2014         FY2016         FY2018 F         FY2020 F         FY2022 F

Source: IBIS Research

                                                 14
~59% OF BEEF FROM FEEDLOTS IS UTILISED IN DOMESTIC MARKET…

End markets by Share of Industry Revenue

                               6.5%
                                              Supermarkets
                        8.3%

                                              Exports to Japan

            11.5%
                                      44.1%   Exports to South Korea

                                              Other export markets
             6.2%

                                              Butchers

                           23.4%              Food service establishments

Source: IBIS Research

                                        15
A FRAGMENTED INDUSTRY BUT CONSOLIDATION WILL CONTINUE…

Beef Cattle Feedlot Industry by Major Players

                                  6.0%
                                         5.1%

                                            5.1%
                                                        JBS Australia Pty Limited

                                                        Mort & Co Ltd

                                                        Teys Australia Pty Ltd

                                                        Other

                          83.8%

Source: IBIS Research, ALFA

                                                   16
WITH RISING GLOBAL COMPETITION IN
GRAIN, THE DOMESTIC FEEDLOT INDUSTRY
             HAS RENEWED IMPORTANCE
WHILE MAJORITY OF AUSTRALIAN GRAIN IS EXPORTED, SIMILAR
                                           OTHER AGRI PRODUCE…
                                                                                                                                       Average Exports as % of Production

                                                                                                             29%
                                                           32%                                                                                                                                                                                                     26%
                                                                                                                                                                45%
                                                                                                                                                                                 55%
                                                                           68%                                                                                                                                           100%
                                                                                                                             71%                                                                                                                                                   74%

                                        16,000
                                                    Grains, Oilseeds                                                 Beef                                              Dairy                                        Cotton                                                 Wool
Value of Agricultural Exports (AUD m)

                                                       & Pulses
                                        14,000

                                                                                                                                                                         Together these five commodity groups represent
                                        12,000
                                                                                                                                                                             ~63% (average) of Total farm exports

                                        10,000

                                         8,000

                                         6,000

                                         4,000

                                         2,000

                                                            A$12.2bn1                                        A$7.2bn1                                           A$3.3bn1                                          A$3.1bn1                                           A$2.1bn1
                                               -

                                                                                                                                                                                                                                                                                           FY'17E

                                                                                                                                                                                                                                                                                                    FY'18F
                                                                                                                                                                                                                                         FY'17E

                                                                                                                                                                                                                                                  FY'18F
                                                                                                                                                                                       FY'17E

                                                                                                                                                                                                FY'18F
                                                                                                                                              FY'18F
                                                                                                                                     FY'17E
                                                                                   FY'17E

                                                                                            FY'18F

                                                                                                                                                                                                                                                           FY'13

                                                                                                                                                                                                                                                                   FY'14

                                                                                                                                                                                                                                                                           FY'15

                                                                                                                                                                                                                                                                                   FY'16
                                                                                                                                                                                                                 FY'14
                                                                                                                                                                                                         FY'13

                                                                                                                                                                                                                         FY'15

                                                                                                                                                                                                                                 FY'16
                                                                                                                                                       FY'13

                                                                                                                                                               FY'14

                                                                                                                                                                       FY'15

                                                                                                                                                                               FY'16
                                                                                                     FY'13

                                                                                                             FY'14

                                                                                                                     FY'15

                                                                                                                             FY'16
                                                   FY'13

                                                           FY'14

                                                                   FY'15

                                                                           FY'16

                                        Note 1: Average Value of Agricultural exports between 2012-13 (FY13) to 2017-18F (FY18F)
                                        Source: ABARES, MLA (data sourced for Beef Production, Exports)
                                                                                                                                                                       18
GROWTH IN STRENGTH OF GLOBAL AGRI POWERHOUSES – WHILE THE
BSR CONTINUES TO RISE
Agriculture produce – Net trade
In ‘000MT, Commodities include Grains, Oilseeds, Meat, Dairy and Sugar

                                                                                                            Growth in Net Exports CAGR (2000-16)
                                                                                                            Growth in Net Imports CAGR (2000-16)
  250,000

  200,000

  150,000

  100,000

   50,000
                                                                                                                    +5%      +2% +2% -1% +28%
           -
                +11% +2% +4% +15%                             +2%
  (50,000)

 (100,000)

 (150,000)
                 Brazil      USA   Argentina Ukraine Canada Australia Thailand    India   Egypt     Iran    South   Saudi     EU   Mexico   Japan   China
                                                                                                            Korea   Arabia

                                                           2000/01     2005/06        2010/11     2016/17

Source: USDA, ANZ Analysis                                                       19
RISING GRAIN & OILSEEDS DEMAND IS INCREASINGLY BEING MET BY
EMERGENT PLAYERS IN SOUTH AMERICA, BLACK SEA REGION…
                                                                                                  Without
Grain & Oilseeds Export Volume                         Grain & Oilseed Export Share (%)           Soybean
In ‘000MT, Major Countries                             % Share of exports of Select Countries

500                                                  100%
                                                                 12%           9%           11%      8%
                                                                  1%           5%            2%      8%
400                               100%
                                   90%
                                   80%                           11%           9%           10%
                                   70%
                                   60%
                                   50%
                                   40%
                                   30%-
                                   20%
                                   10%                80%                                            9%
                                      2000/
                                      2001                                    10%           10%
                                                                 12%                                 8%
                                                                 1%            5%           5%
300                                                   60%                                            10%
                                                                 14%          11%           15%
                                                                                                     12%
200
                                                      40%
                                                                                            32%      22%
                                                                 40%          37%
100
                                                      20%

                                                                                                     23%
                                                                              12%           16%
    -                                                            10%
           2000/2001 2005/2006 2010/2011 2016/2017        -
                                                              2000/2001 2005/2006 2010/2011 2016/2017
                                     Brazil           United States      Argentina
                                     Ukraine          Canada             Australia
                                     Russia           European Union

Source: USDA, ANZ Analysis                       20
FEED INDUSTRY – THE LARGEST DOMESTIC GRAIN & OIL SEEDS
CUSTOMER MAY BENEFIT FROM LOW PRICES…
Grain & Oil seeds consumption share estimates
In Million MT

   60

   50

   40

   30

   20

   10

    -
  2000/2001        2004/2005            2008/2009            2012/2013   2016/2017

                      FSI Consumption     Feed Consumption     Exports

Source: USDA PSD

                                              21
RISING PROTEIN CONSUMPTION TO DRIVE
                            FEED DEMAND

22
PER CAPITA MEAT AND DAIRY CONSUMPTION TO CONTINUE STRONG
   GROWTH IN DEVELOPING REGIONS OVER 10 YEARS…
    Per capita food consumption by region
    In Kg/cap/year
     350

     300

     250

     200

     150

     100

       50

         -
                     2013-15             2025                2013-15                  2025                2013-15               2025
                   Developed         Developed          Other Developing      Other Developing       Sub-Saharan Africa   Sub-Saharan Africa

                               Cereals    Roots and tubers   Meat      Fish   Dairy     Sweeteners     Vegetable oils

Source: FAO – OECD Outlook                                             23
CHINA DEMOGRAPHICS – INCREASING AGEING

Population by Age Group
                                                  Male   Female

                   CHINA                           JAPAN                      GERMANY
      10%              -           10%      10%      -            10%   10%     -       10%

  0-4
  5-9
10-14
15-19
20-24
25-29
30-34
35-39
40-44
45-49
50-54
55-59
60-64
65-69
70-74
75-79
80-84
85-89
90-94
95-99
100+

Source: US Bureau, International Database
JAPAN’S CALORIE CONSUMPTION HAS CONTINUED TO FALL SINCE
1990

Japan Calorie consumption by Source

 3,500

 3,000

 2,500

 2,000

 1,500

 1,000

   500

       -
           1990        1992    1994     1996     1998    2000   2002     2004    2006    2008   2010
                       Dairy and Eggs    Grain    Meat    Produce      Sugar and Fat    Other

Source: FAO Statistics, ANZ
CHINA CONSUMES AS MANY CALORIES PER CAPITA AS JAPAN DID IN
1990

China Calorie consumption by Source

 3,500

 3,000

 2,500

 2,000

 1,500

 1,000

   500

       -
           1990       1992    1994   1996   1998    2000    2002     2004   2006   2008   2010   2012
                        Dairy and Eggs   Grain     Meat    Produce    Sugar and Fat   Other

Source: FAO Statistics, ANZ
JAPAN EXPERIENCED A FALL IN CONSUMPTION ACROSS FOOD TYPES

% change in Japan’s Per Capita and Total Consumption by Category 1990-2011
  4%

  2%

    -

 (2%)

 (4%)

 (6%)

 (8%)

(10%)

(12%)

(14%)
              Grain           Produce   Dairy & Eggs     Meat         Sugar & Fat   Other   Total
                                                 Per Capita   Total

Source: FAO Statistics, ANZ
HISTORIC CONSUMPTION GROWTH IN CHINA HAD BEEN EXPONENTIAL

% change in China’s Per Capita and Total Consumption by Category 1990-2011

 250%

 200%

 150%

 100%

  50%

       -

 (50%)
                Grain         Produce   Dairy &       Meat     Vegetable   Sugar &   Other   Total
                                         Eggs                     Oil        Fat
                                                  Per Capita   Total

Source: FAO Statistics, ANZ
CHINA & SE ASIAN COUNTRIES ARE THE LARGEST IMPORTERS OF
    GRAIN & OILSEEDS
                                                                                                                                 Grain & oilseed
Grain & Oilseeds Import Volume                                                                     CHINA                         demand increased
In ‘000MT, Major Countries                                                                                                       by 6.3x (2000-16)
350,000
                                                                                              Population                           GDP pcp increased
                                                                                              increased by                         by 5.3x (2000-16)
                                                                                              115m (2000-16)
300,000
                                                                                                                  1.43                                23.96
                                                                                                           1.38
                                                                                           1.31    1.34
                                                                                   1.27                                                       15.40
                                                                                                                                       9.25
250,000                                                                                                                  2.92   5.06

                                                                                   2000    2005    2010    2016 2022F    2000   2005   2010   2016 2022F
200,000                                                                                                                  GDP per capita (PPP)
                                                                                           Population (bn)
                                                                                                                              in ‘000 $

150,000                                                                                                                           Grain & oilseed
                                                                                                   ASEAN COUNTRIES
                                                                                                                                  demand increased
                                                                                                                                  by 2.3x (2000-16)

100,000                                                                                        Population
                                                                                               increased by 123m                  GDP pcp increased
                                                                                               (2000-16)                          by 2.5x (2000-16)
 50,000
                                                                                                                                                      16.56
                                                                                                           0.64   0.68
                                                                                   0.51     0.55    0.59                                      11.60
                                                                                                                                       8.49
                                                                                                                         4.67   6.32
       -
               2000/2001             2005/2006      2010/2011     2016/2017
  China                   SE Asia                European Union   Japan            2000     2005    2010   2016 2022F    2000   2005   2010   2016 2022F
  Mexico                  Egypt                  Saudi Arabia     South Korea
                                                                                          Population (bn)                 GDP per capita (PPP)
                                                                                                                               in ‘000 $

Source: USDA, IMF and ANZ Analysis                                            29
FEED CONSUMPTION IN ASIA PROVIDE SIGNIFICANT OPPORTUNITY..
Asia Feed Consumption Share – Grains & Oilseeds                               East Asia

                                                                                                • Consumption is dominated by China
 55%                                                                                            • Rising per capita income levels driving animal protein
                                                                          45%                     demand

                                                                                      55%       • Intensifying competition for exports especially from
                                                                                                  South America
                                                                                                • Increasing integration through supply chain
                                                                                                  investments in Australia
                                                                              Feed      FSI
 50%
                                                                                                                               Southeast Asia

                                                                       • Home to some of fast growing economies
                                                                       • Changing consumption patterns driven by rising         36%
                                                                         income levels

 45%                                                                   • Increasing import dependency to cater to rising                   64%
                                                                         domestic demand

                                                                                                                                  Feed       FSI

                                                                               South Asia
 40%
                                                                                       21%        • Regional consumption is dominated by India –
                                                                                                    characterised by low meat consumption (but dairy
                                                                                                    industry provide opportunity)

                                                                               79%                • Major destination of Australia’s pulses export

 35%
         2001         2005     2009      2013              2017                Feed    FSI
                 Asia Feed Consumption Share (%)
Note: Year noted 2001 represent marketing year 2000/2001

Source: Data is sourced from USDA PSD Query.
                                                                  30
AGTECH AND DATA
     PROVIDE UNIQUE OPPORTUNITIES

31
MLA IDENTIFIED FOUR AREAS FOR USE OF DIGITAL TECHNOLOGIES
IN LIVESTOCK ENTERPRISES…
                                                                              Productivity Benefits
                                                   Soil fertility
                                                                                 +13% – 26%
                                                   monitoring

                                                  Feed
                                                  allocation                      +9% - 11%
                                                  systems

                                                   Animal
                                                   production                     +4% - 9%
                                                   monitoring

                                                   Animal
                                                   disease                        +4% - 13%
                                                   monitoring

Source: Meat and Livestock report, retrieved from Beef central website   32
HOWEVER, NEED TO ADOPT REALISTIC TIMELINE FOR
IMPLEMENTATION OF EMERGING TECHNOLOGIES…
Key driving factors that affect level of adoption of a technology or practice by agribusinesses

                  Characteristics of the Technology or Practice          “No one technology or technologies
                  • Cost of Technology                                   would be transformational, and
                                                                         progress on technologies would be
                  • Difficulty of implementation                         incremental, because of the nature of
                                                                         innovation and adoption”

                  Characteristics of the Target Population
                  • Financial Capacity

                  • Education levels

                  • Social norms

                  Relative advantages of using the technology or practice
                  • Improved efficiency

                  • Better crop yields

                  • Higher Profitability

                  Capacity to learn or adapt to generate a relative advantage

                  • Support infrastructure to aid decision-making and learning

                  • Update to latest available technology/techniques

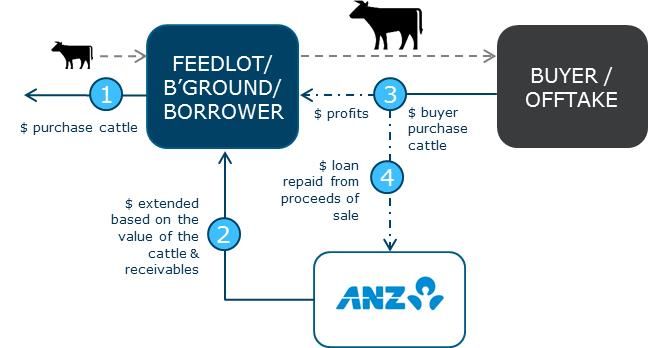
Source: Smart Farming – May 2016, Inquiry into agricultural innovation
BANKS REMAIN INTEGRAL PART OF SUPPLY CHAIN

                             34
TRADITIONAL VS REAL TIME FINANCING

Funding Against Land

             Failure to tap the working capital finance opportunity

Traditional Financing

                                                                                  Works well
  300 Kg                                  400 Kg                        500 Kg
                                                                                  with operators
  Day 0                                   Day 50                        Day 100   with long
                                                                                  operation
         $                                  $$$                          $$$$$    history

                        $ Lost                                 $ Lost
Real Time Financing

                                                                                  Technology
300 Kg                                  400 Kg                          500 Kg
                                                                                  provide
Day 0                                   Day 50                          Day 100   opportunity to
                                                                                  unlock
   $                                       $$$                           $$$$$    working
                                                                                  capital

                    $ Gained                                 $ Gained
                                                     24
ABILITY TO ATTRACT NEW CAPITAL IN THE INDUSTRY BY UNLOCKING
              WORKING CAPITAL
   20151                                                                       20161
         1,200                                                                           1,200

         1,000                                                                           1,000

              800                                                                             800
AUD Million

                                                                                AUD Million
              600                                                                             600

              400                                                                             400

              200                                                                             200

                0                                                                               0
                Jan 15     Feb 15 Mar 15   Apr 15     May 15                                    Jan 16     Feb 16   Mar 16   Apr 16   May 16

                    Traditional Model   Real Time Model                                             Traditional Model    Real Time Model
   Note1: Dressing %=52%, 85% of market value for feed lot with 100 day
                                                                          36
   cycle
THE WAY AHEAD

                              Drivers                                          Platform

                                                                     Cattle in feedlot        2,000

            4.8
            4.5
                                                                     Funding Based on
                                                                                            AUD 1.0m
            4.2                                                            Land
            3.9
 AUD / Kg

            3.6
                                                                     Working Capital
            3.3                                                                             AUD 0.4m
                                                                      Opportunity
            3.0
            2.7
            2.4
            2.1
                  10       11      12     13     14      15     16
                       Australia Eastern Young Cattle Indicator

                                                                       Swipe Right to unlock AUD 400k

                                                                37
MANAGING COMMUNICATION BETWEEN DIFFERENT PARTS OF VALUE
    CHAIN REMAINS VITAL…

                                              •   Strengthen resource
                                                  management system
          Production end                                                                Consumption end
                                              •   Mass production of
        Smart agricultural                                                        Convenient services offered by
                                                  excellent traceable products
        production alliance                                                            digital agriculture
                                              •   Link e-commerce

                                    Product information                  Consumer habit

                        Accurate estimates of crop yield,                    Where, What & How produce is
                        input applications etc.,                             consumed?

                        Storage and Marketing of harvest crop                Change in consumption patterns

                        Data to help increase efficiency in                  Key factors affecting consumer choice
                        operations

Source: Taiwan govt. website, ANZ                              38
AUSTRALIA’S FEEDLOT SECTOR

• Important component of domestic feed complex
• Must continue to be strategic in maintaining social
  licence
• Approaching continuing consolidation
• Facing strong global competitors
• Focus of growing agri investment
• Massive agtech/data potential
• Needs to adapt with customers

                             39
THANK YOU
Presented by MICHAEL WHITEHEAD
DISCLAIMER
> This document is issued by Australia and       > Information contained in this presentation is       > The points made in this presentation are
  New Zealand Banking Group Ltd (‘ANZ’).           strictly confidential. It is the property of ANZ.     subject to further discussion with you and
  The information and opinions contained in        As such, no part of it may be circulated,             we would be pleased to address any
  this document (on which ANZ may have             copied, quoted or otherwise referred to               comments and queries that you may have
  acted or may act for its own purposes) are       another party without prior written consent           in relation to the proposed funding options
  published for the assistance of recipients       of ANZ                                                so as to ensure that your particular
  but are not to be relied upon as                                                                       requirements are satisfied
  authoritative or taken in substitution for     > The terms noted in this presentation is
  the exercise of judgment by any recipient.       subject to receipt by ANZ of formal credit
  While such information and opinions have         approval and appropriate legal, accounting,
  been compiled or arrived at by ANZ in            tax and technical advice. This is not an offer
  good faith and from sources believed to be       to finance
  reliable, no representation or warranty,
  express or implied, is made as to their
  accuracy, completeness or correctness,
  any opinions contained in this document
  may be changed by ANZ without notice.
  ANZ, its officers, employees,
  representatives and agents accept no
  liability whatsoever for any loss or damage,
  whether direct, indirect, consequential or
  otherwise howsoever arising (whether in
  negligence or otherwise) out of or in
  connection with or from any use of the
  contents of and/or any omissions from this
  document

                                                                      41
You can also read