Evidence Summary on the Prevention of Poisoning in Canada - A N D INJURY PREVENTION CENTRE, UNIVERSITY OF ALBERTA - Parachute ...
←
→
Page content transcription
If your browser does not render page correctly, please read the page content below

Evidence Summary
on the Prevention of
Poisoning in Canada

PA R A C H U T E
AND
INJURY PREVENTION CENTRE,
U N I V E R S I T Y O F A L B E RTA

J U LY 2 3 , 2 0 2 0
Suggested citation:
Jiang A, Belton, kL, & Fuselli P (2020). evidence Summary on the Prevention of
Poisoning in canada. Parachute: toronto, on.

ACKNOWLEDGEMENTS
working collectively on a collaborative project is very rewarding. the process
brings together individuals from different organizations who occupy a wide range
of roles. together, the following advisors have generously contributed their time
and expertise to the creation of this paper, and we extend our sincerest gratitude.

        Felix Bang, Public Health Agency of Canada
        James Hardy, Health canada
        minh do, Health canada
        Richard wootton, Health canada
        Lisa Belzak, Public Health Agency of Canada
        Steven mcFaull, Public Health Agency of Canada
        Xiaoquan Yao, Public Health Agency of Canada
        Laurie mosher, Iwk Poison centre
        dr. nancy murphy, Iwk Poison centre
        Sandra newton, child Safety Link
        guillaume Bélair, centre Antipoison du Quebec
        dr. maude St. onge, centre Antipoison du Quebec
        Anna Leah desembrana, ontario Poison centre
        dr. margaret thompson, ontario Poison centre
        Sandra Padovani, Parachute
        kelley teahen, Parachute
        cara Zukewich, Saskatchewan Prevention Institute
        colleen drul, Injury Prevention centre
        george Frost, Injury Prevention centre
        Patricia chambers, PAdIS
        Jane Huang, PAdIS
        dr. mark Yarema, PAdIS
        Victoria wan, Bccdc
        dr. Roy Purssell, Bc drug and Poison Information centre
        dr. Ian Pike, Bc Injury Prevention Research & Prevention Unit
        Fahra Rajabali, Bc Injury Prevention Research & Prevention Unit

Evidence Summary on the Prevention of Poisoning in Canada                        Acknow l edgement   | 1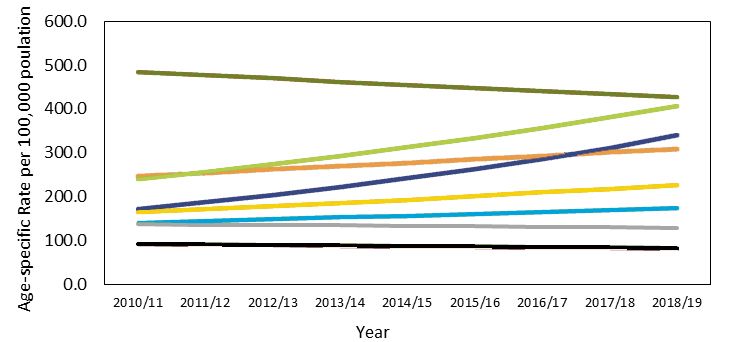
TABLE OF CONTENTS
Executive Summary  .  .  .  .  .  .  .  .  .  .  .  .  .  .  .  .  .  .  .  .3                          Current Poisoning Prevention Initiatives  .  . 42
                                                                                                               Surveillance and Surveillance Systems . . . . . . .                                42
Purpose  .  .  .  .  .  .  .  .  .  .  .  .  .  .  .  .  .  .  .  .  .  .  .  .  .  .  .  .  .  .  .4              Public Health Agency of canada . . . . . . . .                                 42
Introduction  .  .  .  .  .  .  .  .  .  .  .  .  .  .  .  .  .  .  .  .  .  .  .  .  .  .  .5                     toxicovigilance canada . . . . . . . . . . . . . . . .                         43
                                                                                                                   canadian Surveillance System for Poison
Definition Of Poisoning  .  .  .  .  .  .  .  .  .  .  .  .  .  .  .  .6                                           Information (cSSPI) . . . . . . . . . . . . . . . . . . . .                    44
                                                                                                               Poison Prevention week . . . . . . . . . . . . . . . . . . .                       45
Poison Centres In Canada  .  .  .  .  .  .  .  .  .  .  .  .  .  .  .7                                         toxicovigilance canada’s Public outreach
       History . . . . . . . . . . . . . . . . . . . . . . . . . . . . . . . . . . .              7            and communication working group . . . . . . . .                                    45
       canadian Poison centres . . . . . . . . . . . . . . . . . . . .                            7            canadian collaborating centres on
                                                                                                               Injury Prevention . . . . . . . . . . . . . . . . . . . . . . . . .                45
       canadian Association of Poison
       control centres . . . . . . . . . . . . . . . . . . . . . . . . . . .                      7            Parachute’s #PotcanPoisonkids Program . . . .                                      46
       Product Formulations database . . . . . . . . . . . . . .                                  8            government of canada:
                                                                                                               Federal Actions on opioids . . . . . . . . . . . . . . . . .                       46
Populations At Risk  .  .  .  .  .  .  .  .  .  .  .  .  .  .  .  .  .  .  .  .9
                                                                                                        Remaining Challenges  .  .  .  .  .  .  .  .  .  .  .  .  .  .  .  .  .47
       Pediatric, Youth and Young Adults . . . . . . . . . . . 9
                                                                                                               national Poison centre Access . . . . . . . . . . . . . .                          47
       older Adults . . . . . . . . . . . . . . . . . . . . . . . . . . . . . 10
                                                                                                               Products database . . . . . . . . . . . . . . . . . . . . . . . .                  47
       Intentional Self-Harm Poisonings . . . . . . . . . . . 10
                                                                                                               Integrated Surveillance Systems . . . . . . . . . . . . .                          47
       Indigenous Peoples. . . . . . . . . . . . . . . . . . . . . . . . .11
                                                                                                               emerging Poisoning Issues . . . . . . . . . . . . . . . . .                        47
The Impact Of Poisonings In Canada  .  .  .  .12
                                                                                                        Recommendations And Future Steps  .  .  .  .48
       methodology . . . . . . . . . . . . . . . . . . . . . . . . . . . . .                    12
                                                                                                               Advocating for Best Practices . . . . . . . . . . . . . . .                        49
       deaths . . . . . . . . . . . . . . . . . . . . . . . . . . . . . . . . . . .             13
                                                                                                               Access to Canadian-Specific
       Hospitalizations . . . . . . . . . . . . . . . . . . . . . . . . . .                     16             Product Information . . . . . . . . . . . . . . . . . . . . . . .                  49
       emergency department Visits . . . . . . . . . . . . . .                                  19             Understanding emerging Issues . . . . . . . . . . . .                              49
       canadian Hospitals Injury Reporting and                                                                 carbon monoxide detectors . . . . . . . . . . . . . . . .                          50
       Prevention Program (cHIRPP) . . . . . . . . . . . . . .                                  22
                                                                                                               national Leadership . . . . . . . . . . . . . . . . . . . . . . .                  50
       calls to canadian Poison centres . . . . . . . . . . .                                   23
       Limitations of Poisoning data . . . . . . . . . . . . . .                                25      Conclusion  .  .  .  .  .  .  .  .  .  .  .  .  .  .  .  .  .  .  .  .  .  .  .  .  .  .  .50
       economic Burden of Unintentional Poisonings
       in canada . . . . . . . . . . . . . . . . . . . . . . . . . . . . . . . .                26      Appendices  .  .  .  .  .  .  .  .  .  .  .  .  .  .  .  .  .  .  .  .  .  .  .  .  .  .  .51
                                                                                                               A: Poison control centres . . . . . . . . . . . . . . . . .                        51
Emerging Poisoning Issues  .  .  .  .  .  .  .  .  .  .  .  .  .27
                                                                                                               B: data Sources and methodology . . . . . . . . . . .                              52
       cannabis . . . . . . . . . . . . . . . . . . . . . . . . . . . . . . . . .               27
                                                                                                               c: top causes for Poison centre calls. . . . . . . .                               53
       opioids and Illicit drugs . . . . . . . . . . . . . . . . . . .                          28
                                                                                                               d: Undetermined Poisonings . . . . . . . . . . . . . . .                           55
       e-cigarettes and Vaping . . . . . . . . . . . . . . . . . . .                            30
       Laundry detergent Pods . . . . . . . . . . . . . . . . . . .                             32      References .  .  .  .  .  .  .  .  .  .  .  .  .  .  .  .  .  .  .  .  .  .  .  .  .  .  .  .58
Poisoning Prevention Best Practices  .  .  .  .  .33
       Poison centres . . . . . . . . . . . . . . . . . . . . . . . . . . . .                   34
       Legislation and Policy . . . . . . . . . . . . . . . . . . . . .                         35
       Safer medication and Substance Packaging . . .                                           35
       Safe Storage . . . . . . . . . . . . . . . . . . . . . . . . . . . . . .                 36
       carbon monoxide detectors . . . . . . . . . . . . . . . .                                37
       Interventions for Poisonings due to Illicit
       drug Use . . . . . . . . . . . . . . . . . . . . . . . . . . . . . . . .                 40
       Raising Awareness and educating . . . . . . . . . .                                      41

Evidence Summary on the Prevention of Poisoning in Canada                                                                                                   Tabl e o f C ontent s                 | 2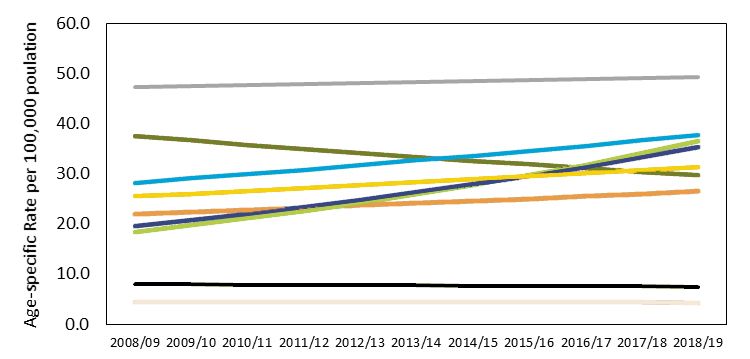
EXECUTIVE SUMMARY
Poisoning represents a major cause of mortality             unintentional poisoning hospitalizations remained
and morbidity in canada and around the                      quite similar from 2008 to 2014; however, rates
world. Furthermore, poisonings account                      among males in the later end of the observed time
for a significant number of hospitalizations                period increased compared to females.
and an even greater number of emergency
department visits each year in canada. while                Available data from emergency departments in
it is important to recognize that poisonings                two canadian provinces (Alberta and ontario)
can occur in individuals from all walks of                  demonstrate a gradual increase in visits due to
life regardless of age, sex or socioeconomic                both unintentional and intentional poisonings,
status, certain populations have been identified            with the rate of unintentional poisonings being
through research and surveillance as being at               more than double that of intentional self-harm
an elevated risk for poisoning. these include               poisonings in 2018 (Figure 9).
pediatric, youth and young adults, older adults             Based on data from five Canadian poison
and Indigenous peoples.                                     centres that collectively serve 11 provinces and
data indicate that deaths due to unintentional              territories (British columbia, Yukon, Alberta,
poisonings have shown a marked increase from                Saskatchewan, northwest territories, nova
2008 to 2018, with a peak observed in 2017                  Scotia, Prince edward Island, ontario, manitoba,
(Figure 3). comparatively, poisoning deaths due             nunavut, and Québec), 209,534 cases were
to suicide have shown a modest decrease during              opened in 2018 to local poison centres, which
the same time period. when poisoning deaths are             averages to 574 cases per day.
analyzed by sex (Figure 4), mortality rates among           over the past decade, there has been an
males are consistently higher than females for              emergence of several issues that have produced
both unintentional and intentional poisoning                changes in the trends associated with poisoning.
deaths during the available time period.                    The legalization of cannabis, the opioid crisis and
Importantly, the mortality rate for unintentional           the introduction of new products such as laundry
poisonings among males more than tripled                    detergent pods have resulted in an increase in
from 2008 to 2017, and the bulk of the observed             calls to poison centres, emergency responses and
increase in unintentional poisoning deaths are              the healthcare system as a whole.
among males as opposed to females. the age
groups with the highest observed mortality rate             Using an evidence-informed approach in
due to unintentional poisonings were individuals            prevention planning ensures that the use of
ages 30 to 49 (Figure 5). Individuals ages 40 to            different types of evidence occurs at more than
64 had the highest mortality rates from suicide             one point in the planning process (mackay
poisoning (Figure 5).                                       2005). knowledge of this process is essential in
                                                            order to ensure a plan has real impact and uses
Data on rates of hospitalization due to                     scarce resources effectively. There are essential
poisonings indicate that unintentional poisoning            components that need to be considered, which
hospitalizations have shown a steady increase               include: using the best available research;
from 2008 to 2018 (Figure 6). Hospitalization               considering the local health issues and local
rates for intentional self-harm poisonings                  context; using existing public health resources;
were consistently higher than unintentional                 and understanding the community and political
poisonings but did not show a clear trend during            climate (national collaborating centre for
the observed time period. When analyzing data               methods and tools, 2013; Brownson et al., 2009;
between males and females (Figure 7), rates for             Saunders et al., 2005; ciliska et al., 2010).

Evidence Summary on the Prevention of Poisoning in Canada                             Ex ec ut iv e S u mm ary   | 3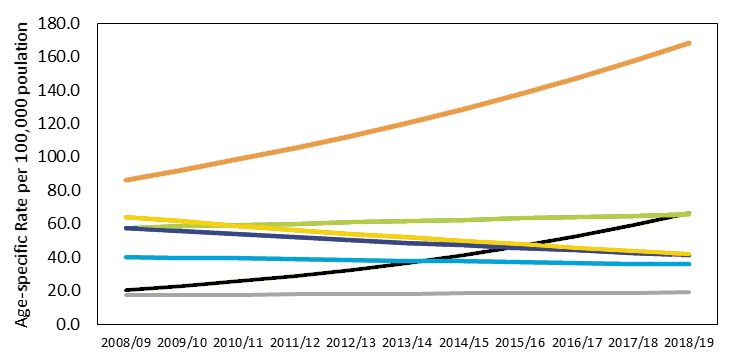
over the past decade, there has been increased              across all age groups to inform current and
activity in the field of poison prevention and              future prevention initiatives. Recent statistics
the theme woven throughout all activity is                  and analyses are provided to reflect the growing
collaboration. we are collaborating to create               magnitude of the issue, as well as discussion
and launch a new surveillance system along                  of emerging issues, poisoning prevention best
with supporting working groups, taking                      practices and current poisoning prevention
collective action on public awareness efforts               initiatives across the country.
through Poison Prevention week, integrating
professionals who are focused on prevention                 Broad recommendations are made from the
and treatment of those affected by poisoning and            evidence gathered as well as proposed actions.
supporting government action on issues such as              the recommendations are:
the opioid crisis.                                           •   Advocating for Best Practices
                                                             •   Access to Canadian-Specific Drug
A number of challenges remain, including                         Information
easier access nationally to poison centres (e.g.             •   Understanding emerging Issues
a national 1-800 number), the integration                    •   developing national Leadership
of existing surveillance systems and those
coming online (e.g. the canadian Surveillance               while these recommendations may seem
System for Poison Information) and the timely               divergent, they all require a level of
identification, tracking and action on emerging             collaboration. the successes that have been
poisoning issues.                                           achieved since the first Evidence Summary was
                                                            written are largely the result of collaboration
Addressing the issue of poison prevention                   between and among key stakeholders such as
is complex. while data on the number of                     the federal government, provincial poison and
individuals affected by poisoning are essential,            injury centres and ngos. this collective action
the context in which poisoning occurs needs                 needs to continue so that different perspectives
to be considered as a key component when                    and expertise can be integrated into these efforts
planning and implementing poison prevention                 moving forward.
strategies. establishing community and
political support, as well as understanding                 Evidence Summary on the Prevention of Poisoning
other community health issues and existing                  in Canada describes the poisoning issue in
public health resources, all create the necessary           canada and provides recommendations and
pre-conditions to advance injury (poisoning)                encourages collaboration across and among
prevention practice.                                        jurisdictions so that canada can achieve further
                                                            success in poisoning prevention, advance the
this evidence Summary provides a snapshot                   health of its entire population and build a
of the current poisoning problem in canada                  national culture of safety.

PURPOSE
the purpose of this evidence Summary on the                 and analyses are provided to reflect the growing
Prevention of Poisoning in canada is to describe            magnitude of the issue, as well as discussion
the current poisoning problem in canada across              of emerging issues, poisoning prevention best
all age groups and contexts to inform current and           practices and current poisoning prevention
future prevention initiatives. Recent statistics            initiatives across the country.

Evidence Summary on the Prevention of Poisoning in Canada                                          P urp os e   | 4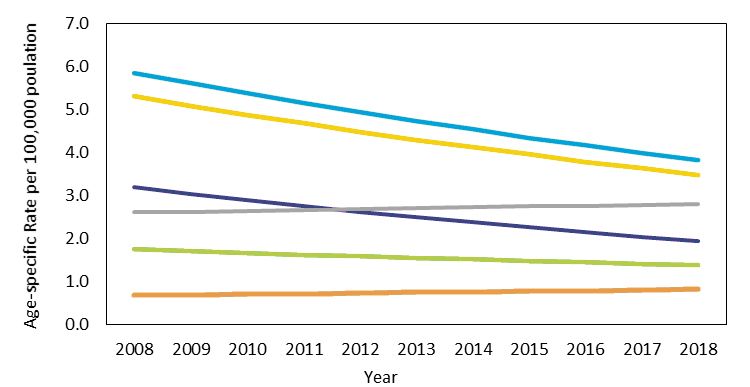
INTRODUCTION
Poisoning represents a major cause of mortality             when all sources of data are combined to
and morbidity in canada and around the                      show the scope of the issue, poisonings stand
world. Latest estimates from the world                      out as a much larger public health issue in
Health Organization indicate that, in 2016,                 Canada than is generally recognized. Like
poisonings were the sixth-leading cause of                  other mechanisms of injury, poisonings are
global unintentional injury deaths and resulted             predictable and therefore preventable. Since the
in 106,683 deaths (World Health Organization,               publication of the first evidence summary on the
2017). Statistics from the U.S. centers for disease         Prevention of Poisoning of children in canada
control and Prevention indicate that poisonings             in 2011 (Parachute & Injury Prevention centre,
in that country surpassed road injuries as the              2011), positive strides have been made toward
leading cause of injury death in 2008 (warner,              preventing poisonings across canada, including
2011), with latest figures indicating unintentional         advances in research and public policy as well
poisonings resulted in 64,795 deaths in the U.S.            as, importantly, toward a national surveillance
in 2017 alone (kochanek et al. 2019), compared              system that includes all poison centre data.
to 37,133 deaths as a result of motor vehicle               Along with these successes came new issues as
collisions that same year (U.S. department of               well, including changes in poisoning patterns,
transportation, 2018). A similar situation can be           the emerging opioid crisis and the legalization
seen in canada, where unintentional poisonings              of cannabis, to name a few. though children are
surpassed transport-related injuries in the                 an important high-risk population and were
annual number of deaths in 2015 and continued               the focus of the original evidence summary, it
to increase to more than twice as many deaths               is important to emphasize that poisonings can
compared to transport-related injuries in 2017              impact all canadians.
(Figure 1). Recent data from Statistics canada
have shown that, for the first time in over four            In response, nearly a decade since its original
decades, the life expectancy for canadians did              publication, this updated evidence summary on
not increase from 2016 to 2017 (Statistics canada,          the Prevention of Poisoning in canada describes
2019a). this was largely attributed to increases            the current poisoning problem in canada across
in unintentional drug poisonings occurring                  all age groups. Recent statistics and analyses
among young adults that offset any gains in life            are provided to reflect the growing magnitude
expectancy due to advances in treatment for                 of the issue, as well as an updated discussion
cancer and cardiovascular conditions (Statistics            of emerging issues, poisoning prevention best
canada, 2019a). Furthermore, poisonings account             practices and current poisoning prevention
for a significant number of hospitalizations                initiatives across the country.
and an even greater number of emergency
department visits each year in canada.

                                                                   Unintentional Poisonings

                                                                   Transport Injuries

                                                                              Figure 1 . trends in the number of deaths
                                                                              due to unintentional poisonings and
                                                                              transport injuries, canada, 2000 to 2017.
                                                                              (Source: Statistics canada).
                                      Year

Evidence Summary on the Prevention of Poisoning in Canada                                        Int r od uct i on   | 5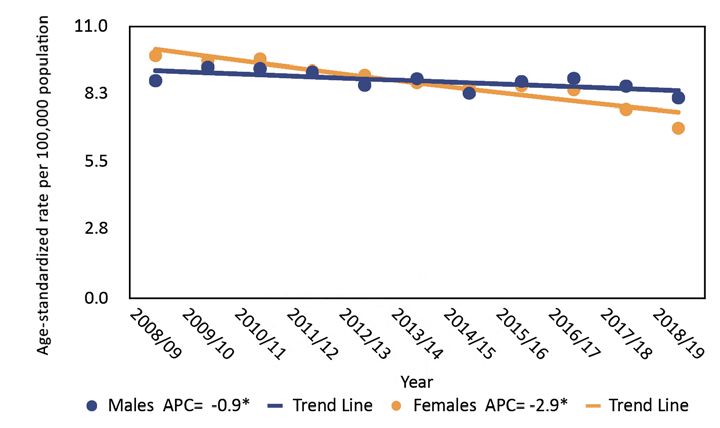
DEFINITION OF POISONING
the national Academy of Sciences, committee                     sensitivity, or dosing error
on Poison Prevention and control’s operational              •   ethanol poisoning, either acute, chronic or
definition of poisoning subsumes “damaging                      effects of withdrawal
physiological effects of ingestion, inhalation, or          •   Seafood-related toxins
other exposure to a range of pharmaceuticals,               •   Bacterially derived toxins
illicit drugs, and chemicals, including                     •   Lay definitions of poisoning such as food
pesticides, heavy metals, gases/vapors, and                     poisoning, poison oak or sun poisoning
common household substances, such as bleach                 •   toxin exposure without attributable and
and ammonia” (Institute of medicine [U.S.]                      defined or discrete clinical effect (exposure
committee on Poison Prevention and control,                     to lead).
2004). In short, poisoning events interfere
with the balance that the body maintains with               Factors of intent may also complicate how
the environment. It is important, however, to               a poisoning event is categorized. Poisoning
recognize that poisoning can occur from any                 events can be classified as being either
substance if the dose and exposure is sufficient.           unintentional, intentional self-harm, intentional
                                                            assault/homicide or of undetermined intent.
There is no standard definition of poisoning                Classifications of intent for poisoning events
that is universally accepted and applied in                 can also change over time as new evidence
clinical practice, in data collection and in public         is collected, especially in cases of suspected
health policy setting. within data collection               suicides and homicides. Importantly,
systems, different definitions of eligibility for the       poisonings involving illicit drug use are now
purposes of case reporting may apply in various             overwhelmingly classified as being unintentional
surveillance schemes, making comparisons                    as opposed to intentional self-harm because, in
across systems difficult in some circumstances.             most cases, individuals using illicit drugs are
For example, there are several types of events              not using with the intent to inflict self-harm or
that are not universally accepted as poisonings             commit suicide.
so the inclusion or exclusion of these events
can lead to variations in estimating the true               Furthermore, a distinction should be made
magnitude of poisoning. In developing a                     regarding the term poisoning and overdose as
surveillance system, clarifying the manner in               these two terms are often used interchangeably
which to handle each of these ambiguous events              in everyday speech, media and medical
must be considered. Some of the events that are             literature. Poisoning is the term that more
not universally included as poisoning events                accurately describes the toxic effects of a
include, but are not limited to:                            substance on the body and is used by the world
                                                            Health Organization International Classification
 •   E                                                      of diseases coding system. the term overdose
 •   Insect stings and bites that might not be              refers specifically to the use of a substance
     considered toxic but may be complicated                beyond a known maximum therapeutic dose.
     by allergic responses, including fatal                 Using the term overdose when referring to
     anaphylaxis                                            illicit drug use implies that individuals know
 •   M                                                      what the correct dose is (though no such dose
                                                            exists), are willingly exceeding such dose and are
 •   Unusual toxic responses that may involve               hence personally responsible, which can lead to
     susceptible subpopulations                             unnecessary stigma among already marginalized
 •   Adverse therapeutic events such as drug                populations (Xie et al. 2017). For such reasons,
     toxicity resulting from drug interactions,             the term poisoning is preferred and will be used
     increased susceptibility or true allergic              in this evidence Summary.

Evidence Summary on the Prevention of Poisoning in Canada                        De fi n i ti on o f Po is on i ng   | 6
POISON CENTRES IN CANADA
History                                                     Canadian Poison Centres
In 1958, Health and welfare canada (now Health              Currently, Canada has five Poison Centres: the
canada), established the Poison control Program             British columbia drug and Poison Information
within the Product-Related diseases division.               centre (dPIc), Alberta’s Poison and drug
Product formulation cards (and later microfiche)            Information Service (PAdIS), ontario Poison
served as the database for information requests             centre (oPc), centre antipoison du Québec, and
regarding exposures. these cards were                       the Iwk Regional Poison centre in nova Scotia.
distributed to all active treatment hospitals               See Figure 2 for the location of each poison centre
throughout canada. manufacturers would                      and their associated service regions. each of
voluntarily submit this information to Health               these Centres are staffed with registered nurses
and welfare canada. missing information would               and pharmacists certified by the American
be solicited by Health and Welfare Canada staff             Association of Poison control centers (AAPcc)
when an exposure occurred to a product about                as specialists in poison information, or eligible
which no information was available. In exchange             for certification after approximately two years
for these information cards, centres kept                   of full-time employment at a poison centre,
statistics and reported these back to the Program.          handling of 2,000 human exposure calls and
Annual reports were produced from the data                  1,200 hours. they strive to follow the criteria as
until 1988 when the federal program folded.                 set by the AAPcc for medical management of
                                                            exposures and coding uniformity among five
Although the database and statistical reports
                                                            poison centres.
came from the Federal Poison control Program,
funding for the centres was provincial and                  See Appendix A for detailed information on each
varied from province to province. In the ’60s               Poison centre in canada.
and ’70s, most centres were in the emergency
departments of active treatment hospitals. the              Canadian Association of Poison
“Poison Telephone” was usually answered by an               Control Centres
eR nurse. In the ’80s, most of these local centres          In order to provide some cohesiveness and sense
were replaced by regional or provincial centres             of “system” to a fragmented group of poison
with dedicated, trained staff. Physicians with              centres dispersed across the country, a voluntary
specific training in toxicology were hired to give          association, the canadian Association of Poison
medical direction and continuing education. As              control centres (cAPcc) was formed at a
many of the exposures were pediatric, four of the           meeting of medical directors in toronto in 1982.
dedicated centres were located within pediatric             The CAPCC provides a centralized forum for
hospitals. Although initially calls to the Poison           communication, information and idea exchange
Information centres were from the public, over              among canadian poison centres. while its
the years, increasingly, health care providers              members are primarily professionals working
have come to rely on the toxicological expertise            in poison control centres, other members
of the staff at Poison Centres to assist with the           have included pharmacists, pharmaceutical
management of poisoned patients who present                 companies, forensic toxicologists, public health
to Health care facilities. Pediatric and adult calls        staff and emergency physicians.
are approximately equal in number.

Evidence Summary on the Prevention of Poisoning in Canada                      P O IS ON CENT RE S I N C AN AD A   | 7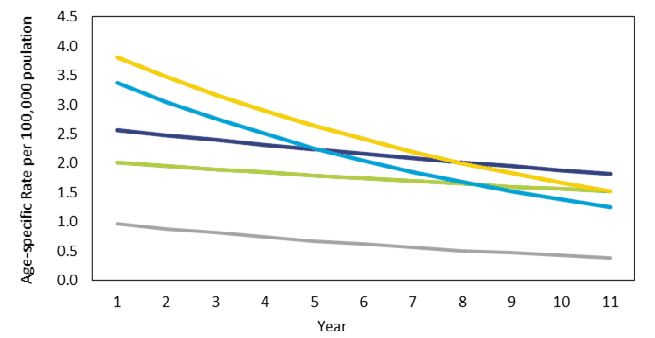
Poison Centres of Canada

                          Figure 2 . map of poison centres and the regions they serve in canada.

Product Formulations Database
the canadian Poison control Program was                        poison centres. the federal government product
initiated in 1957 as a joint undertaking between               database was maintained and distributed until
the Federal and Provincial departments of health               1986 when the program as cut. In 1988. this
as well as a commitment from the canadian                      responsibility was handed over the canadian
Paediatric Society (at that time, poison ingestions            Paediatric Society. the cPS agreed to use its
were mainly a very young children’s issue).                    permanent secretariat address for the receipt of
At the time, patent and proprietary medicine                   canadian product formulations from industry
formulas were registered in the then Food and                  and manufactures. the cAPcc decided that
Drugs Directorate and, because of confidentiality              the needs of its members would be best served
of the information, only selected information                  by incorporating the canadian data into the
was given to a physician on direct request or in               existing U.S.-based PoISIndeX database that
an emergency. In 1965 there was no regulation                  was presently being used by all members.
that allowed for product information to be                     PoISIndeX is the largest and most complete
given to the poison control centres. to address                resource for quickly identifying, managing
this problem, Health and welfare canada                        and treating toxicological exposures. It is used
collaborated with industry and manufacturers                   by poison and drug information specialists,
to establish a voluntary mechanism to collect                  emergency department personnel and clinical
and distribute product formulations to the                     toxicologists in hospitals, healthcare facilities and

Evidence Summary on the Prevention of Poisoning in Canada                              P O IS ON CENT RE S I N C AN AD A   | 8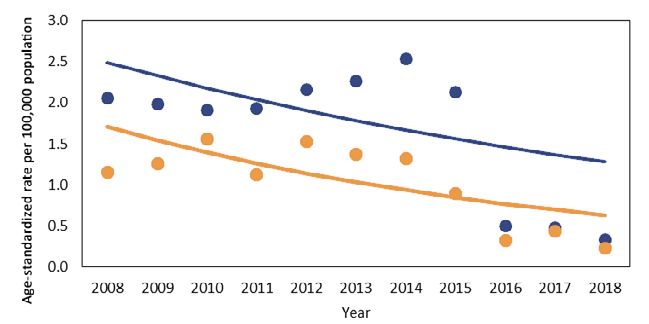
poison control centres all over the U.S. Because            information to support patient treatment.
of cross-border trade, having access to American            Further, without such information, data collected
data was important. Subsequently, the canadian              from poison exposure cases lacks specific
federal data files were downloaded into the                 product information which can inform poison
PoISIndeX system. Late in 2005, the ottawa                  prevention and harm reduction. By having
Regional Poison centre based at cHeo closed.                product information, harmful outbreaks could
After this time, only a fairly limited amount of            be detected quicker and valuable comparisons
canadian information is sent to be included                 could be made between products: for example,
in PoISIndeX. canadian poison centres                       examining effectiveness of different types of
continue to struggle to access domestic product             child- resistant closures.

POPULATIONS AT RISK
the public health approach seeks to understand              While it is important to recognize that poisonings
the underlying determinants of a health issue in            can occur in individuals from all walks of life
order to develop effective prevention strategies            regardless of age, sex, or socioeconomic status,
at the population level. An important step in this          certain populations have been identified through
approach is identifying specific determinants               research and surveillance as being at an elevated
of health and risk factors that predispose                  risk for poisoning and are thus discussed briefly
individuals to a specific health concern, in our            in this evidence Summary.
case, poisonings. Factors collectively referred to
as the social determinants of health (e.g. income,          Pediatric, Youth and Young Adults
housing, access to health care, education, social           though the pediatric age range is commonly
inclusion/exclusion) have gained increased                  defined as birth to 18 years of age, initial interest
recognition as a major influence on injury                  in poison prevention arose from the need to
risk. while these factors are often considered              prevent unintentional poisonings among young
modifiable and can be addressed by specific                 children, especially those ages zero to five years.
interventions, other risk factors are fixed and             data from the U.S. indicate that approximately
unchangeable (e.g. age, sex, ethnicity).                    one million poison exposures occur annually
For example, when considering opioid-related                among children under the age of six years
poisonings, national canadian data indicate                 (Gummin et al., 2018). Although a significant
that nearly half of all deaths were among                   number of poisonings occur in this population,
individuals ages 30 to 49 and three-quarters of             deaths are extremely rare (gummin et al.,
all deaths were among males (Public Health                  2018). Several factors have been used to explain
Agency of canada [PHAc], 2019), suggesting                  why young children are at an increased risk
that males during mid-adulthood are the major               for poisoning, with the two major ones being
population at risk for opioid-related poisonings.           developmental and environmental factors. A
with respect to social determinants, research               child’s skin is thinner compared to an adult’s,
has also shown that drug- and substance-related             such that substances can be easily absorbed
poisonings are significantly higher in the lowest           when exposed on the skin. children are also
socioeconomic status communities compared to                physically smaller than adults, such that small
the highest socioeconomic status communities                doses of substances and medications can pose
(Xibiao et al., 2018).                                      significant health effects. As infants progress
                                                            through the typical developmental milestones

Evidence Summary on the Prevention of Poisoning in Canada                               Po pulati ons at R isk   | 9
during the first years of life, they become more presence of several comorbid conditions, and
mobile, explore their environments and grab cognitive changes that can result in medication-
objects as their motor skills improve. Young taking errors. Statistics show that more than a
children often also explore their environments quarter (26.5 per cent) of canadian adults over
by placing objects into their mouths that can the age of 65 years were prescribed medications
be inadvertently swallowed. Research has from 10 or more different drug classes and
further suggested that poisonings among young accounted for 58.6 per cent of all adverse drug-
children may be linked to imitative behaviours related hospitalizations in 2016 (Canadian
as they watch and copy their caregivers taking Institute for Health Information, 2018). the
oral medications (Rodgers, 2012). the home likelihood of severe long-term effects or death
environments in which young infants explore are also significantly higher among the elderly
(e.g. kitchen, bathrooms, laundry rooms) population following a drug poisoning event
commonly have low-lying, unlocked cabinets (wilson et al., 1995).
containing toxic cleaners that can often resemble
fruit juices or candy. In addition to unintentional poisonings related
to polypharmacy and adverse drug events,
Youth and adolescents (typically ages 12 to growing emphasis has been placed on intentional
18) have also been described as an at-risk self-harm poisonings among the elderly. older
group for poisonings. the teenage years are adults often experience increased stress in
often characterized by periods of impulsivity, their lives as a result of retirement, changes
rebelliousness and risky behaviour. Indeed, in their physical/cognitive abilities, chronic
research has suggested that children and illnesses or the loss of a partner or friend. these
adolescents who attempted suicide with stressors can compound feelings of loneliness
poisoning tend to have more impulsive or burdensomeness and potentially lead some
personality traits (ghanem et al., 2013). Youth older adults to harm themselves (conejero et al.,
and young adults may also be more influenced 2018). Self-harm via poisoning is of particular
by social media and peer pressure, as seen concern as research has shown that older adults
most recently with the viral laundry detergent with suicidal ideations often have relatively easy
pod challenge. Poisonings related to laundry access to large quantities of potent medications
detergent pods are discussed in greater detail in (cobaugh et al., 2015).
a separate section of this evidence Summary.
Intentional Self-Harm Poisonings
Older Adults Intentional self-harm (suicide) is a major cause of
Poisoning among older adults has become a death in canada, with recent statistics indicating
topic of increased discussion as the percentage that suicide is within the top three causes of
of canadians over the age of 65 is expected to death among canadians ages 15 to 44 years
increase from 17.2 per cent of the population in old (Statistics canada, 2019d). Poisoning is the
2018 to as high as 29.5 per cent by 2068 (Statistics second-leading method of suicide in canada,
canada, 2019b). older adults are at risk for accounting for approximately 23 per cent of all
poisoning primarily due to polypharmacy (the deaths by suicide in 2012 (Skinner et al., 2016).
use of multiple drugs or more drugs than are with respect to non-fatal self-harm attempts,
medically necessary) and adverse drug events. poisoning is the leading mechanism of self-
Risk factors unique to older adults can include harm and was responsible for 86 per cent of
changes in physiology, pharmacodynamics Canadian hospitalizations due to self-harm in
(what the drug does to the body or the response 2012 (Skinner et al., 2016). the most common
of the body to the drug), and pharmacokinetics substances implicated in self-harm poisonings
associated with aging (e.g. drug absorption), are medications, specifically acetaminophen,
Evidence Summary on the Prevention of Poisoning in Canada Po pulati ons at Risk | 10benzodiazepines and antidepressants (Rhodes et with the growing recognition that much of
al., 2008). the use of prescribed antidepressants this is a direct consequence of the devastating
for self-harm indicates that individuals with impacts of colonization and subsequent
depression and/or other mental health issues ongoing intergenerational trauma (truth and
are a major population at risk for self-harm Reconciliation commission of canada [tRcc],
2015). of particular concern is the growing
poisonings, especially with the fact that the
number of deaths among Indigenous peoples in
suicide rate among those with clinical depression canada due to illicit drug and substance-related
is higher compared to the general population poisonings (e.g. opioid poisonings). though the
(cassano & Fava, 2002). opioid crisis has affected individuals from all
walks of life, research suggests that Indigenous
while poisoning is the leading cause of non-
people are a disproportionately impacted group.
fatal self-harm, deaths by suicide are more data from British columbia demonstrates that
likely to involve other more lethal means (e.g. although Indigenous people comprise only
suffocation, firearms). Research has also shown 3.4 per cent of the province’s population, they
that differences exist between the sexes, with accounted for 10 per cent of all illicit drug-
females being more likely than males to choose and substance-related poisoning deaths and
poisoning as a method of self-harm (callanan & were three times more likely to die from such
davis, 2012). However, when males do choose poisoning events compared to non-Indigenous
poisoning as a method of self-harm, they are individuals (First nations Health Authority,
2017). Young Indigenous people who use drugs
more likely to die as a result of the poisoning
and substances are a particularly high-risk group
event compared to females (Spiller et al., 2010).
as research has shown they are 13 times more
Research in British columbia has demonstrated likely to die than non-indigenous canadians of
that female youth and young adults are a the same age, with the leading cause of death
particularly high-risk group, with self-harm being drug- and substance-related poisoning
poisoning hospitalization rate among females (Jongloed et al., 2017).
ages 15 to 19 years old being the highest across
the factors that increase mortality, morbidity and
all age groups and both sexes, and more than
predispose individuals to drug and substance
three times greater than the corresponding rate
use and poisonings among Indigenous people
among males in that age group (191.6 vs. 57.3 per in canada are complex and deeply rooted in
100,000) (Jiang et al., 2018). the historical, intergenerational and ongoing
trauma associated with colonization, the
together, this indicates that certain individuals
residential school and child welfare systems,
are more likely to harm themselves via poisoning
poverty, racism and inadequate access to health
as compared with others, such as those with
and social services (tRcc, 2015; First nations
mental health conditions including depression
Health Authority, 2017; goodman et al., 2017).
and other affective disorders. Suicidality, which
though a full discussion of these complex issues
can be seen as a clinical condition, is often the
is beyond the scope of this evidence Summary,
common factor that places these individuals at
a few key factors that have been proposed
risk of poisoning. this is an important distinction
to influence substance-related harms among
as suicide is a major cause of death in canada
Indigenous people are discussed below. A more
and mental health conditions are amenable to
general discussion on opioids, illicit drugs and
treatment that can prevent suicide attempts and
substance-related poisonings is also discussed in
self-harm poisonings.
a separate section of this evidence Summary.
Indigenous Peoples • Intergenerational trauma is associated with
Indigenous people in canada are at an an increased risk for substance use among
increased risk of mortality and morbidity Indigenous people in Canada. oppressive
compared to non-Indigenous canadians, colonial policies and practices, including
the residential school system, have had
Evidence Summary on the Prevention of Poisoning in Canada Po pulation s at Risk | 11a substantial intergenerational impact as • Reduced access and barriers to health services.
survivors pass on feelings of shame and self- Indigenous people using illicit drugs and
hatred to their descendants, which can lead substances have reported reduced access
to increased rates of suicide, depression, to medical therapy for their addiction and
anxiety and substance use (Syme et al., substance-use disorders, including suboxone
2010). drug and substance use have been and methadone maintenance therapy (Bc
reported among Indigenous populations centre for excellence in HIV/AIdS, 2009).
as a coping mechanism for trauma, stress Furthermore, Indigenous people may
and grief (Anderson & collins, 2014). experience increased prejudice in healthcare
As a result of the trauma experienced by settings when their pain symptoms are
survivors of the residential school system dismissed or being denied commonly
and the intergenerational trauma felt by prescribed pain-relieving medications,
their children, many Indigenous people may which can lead many to seek illicit drugs
have a certain level of distrust towards the and substances as a source of pain control
healthcare system, which can lead many to (western Aboriginal Harm Reduction
not seek appropriate care (monture, 2007). Society, n.d.).
THE IMPACT OF POISONINGS IN CANADA
Methodology
Statistics and figures presented in this Evidence Age-standardized rates are used throughout this
Summary are based on analyses performed report to describe rates across time. to allow for
by the Public Health Agency of canada a comparison across the years, age-standardized
of mortality data from Statistics canada’s rates were calculated using the direct method.
canadian Vital Statistics death database this method controls for potential sources of bias
(2008 to 2018), hospitalization data from the resulting from variations in the age distribution
canadian Institute for Health Information’s of populations across time.
Discharge Abstract Database (2008 to 2018 fiscal
years; data from Quebec not included), and The change in trending of the age-standardized
emergency department visit data from Alberta rates over time is expressed in annual per cent
and ontario from the canadian Institute for change (APc) between time periods. the sum
Health Information’s national Ambulatory care of the average percentage change will give the
Reporting System (2010 to 2018 fiscal years). Data overall change. the trending was done with the
were also available from the electronic canadian Joinpoint Regression Program. to ensure the data
Hospitals Injury Reporting and Prevention in this report are illustrated in an effective and
Program (ecHIRPP) database (2012 to 2019), useful manner, data fields with small numbers
which amalgamates emergency room data from are not included in graphs. In these cases, a
11 pediatric and nine general hospitals in canada. note is included below the graph. data trends
For full details of data extraction codes and on mortality, hospitalizations and emergency
methodology used to define poisonings in this department visits of undetermined nature can be
evidence Summary, please refer to Appendix B. found in Appendix d.
data are presented as rates per 100,000
population and, when applicable, standardized
based on the 2011 canadian population.
Evidence Summary on the Prevention of Poisoning in Canada T H E I M PA CT O F P O IS ON I NG S I N C A NA D A | 12Deaths due to Poisonings
data indicate that deaths due to unintentional period. Importantly, the mortality rate for
poisonings have shown a marked increase from unintentional poisonings among males more
2008 to 2018, with a peak observed in 2017 than tripled from 2008 to 2017, indicating that the
(Figure 3). comparatively, poisoning deaths bulk of the observed increase in unintentional
due to suicide have shown a modest decrease poisoning deaths are among males as opposed
during the same time period. when poisoning to females. the age groups with the highest
deaths are analyzed by sex (Figure 4), mortality observed mortality rate due to unintentional
rates among males are consistently higher than poisonings were individuals ages 30 to 49 (Figure
females for both unintentional and intentional 5). Individuals ages 40 to 64 had the highest
poisoning deaths during the available time mortality rates from suicide poisoning (Figure 5).
Figure 3 . mortality due to poisonings in canada by intent, 2008 to 2018.
*= The annual per cent change (APC) is significantly different from zero at alpha=.05
over the 11-year period from 2008 to 2018, the death rate due to unintentional poisoning had
a statistically significant average increase of 11.4 per cent each year. Intentional-suicide and
undetermined intention of poisoning both experienced a decrease in death rate. Intentional-suicide
poisoning death rate had a statistically significant decrease average of 3.2 per cent each year.
Undetermined intent poisoning death rate had an average 7.9 per cent decrease each year. due to the
small numbers, poisoning with intent to harm another person were not included.
Evidence Summary on the Prevention of Poisoning in Canada T H E I M PA CT O F P O IS ON I NG S I N C A NA D A | 13Figure 4 . Mortality due to poisonings in Canada by intent and sex, 2008 to 2018. Age-standardized rates rates per 100,000
population.
Unintentional
Males APC= 12.8*
Females APC= 8.0*
*= The annual per cent change (APC) is significantly different from zero at alpha=.05
Over the 11 year period from 2008 to 2018 both males and females had a statistically significant
increase in the unintentional poisoning death rate. males had an average increase in the unintentional
poisoning death rate of 12.8 per cent each year and females had an average increase in unintentional
poisoning death rate of 8.0 per cent each year.
Intentional-Suicide
Males APC= -3.8*
Females APC= -2.6*
*= The annual per cent change (APC) is significantly different from zero at alpha=.05
Over the 11 year period from 2008 to 2018 both males and females had a statistically significant
decrease in the death rate due to intentional-suicide poisonings. males had an average decrease in
intentional-suicide poisoning death rate of 3.8 per cent each year and females had an average decrease
in intentional-suicide death rate of 2.6 per cent each year.
Evidence Summary on the Prevention of Poisoning in Canada T H E I M PA CT O F P O IS ON I NG S I N C A NA D A | 14Figure 5 . mortality due to poisonings in canada by intent and age group (years), 2008 to 2018.
Age-specific rates per 100,000 population.
Unintentional
30 to 39 yrs APC= 15.7*
40 to 49 yrs APC= 9.1*
20 to 29 yrs APC= 16.5*
50 to 64 yrs APC= 9.4*
65+ yrs APC= 2.5
15 to 19 yrs APC= 2.5*
*= The annual per cent change (APC) is significantly different from zero at alpha=.05
Over the 11-year period from 2008 to 2018, all age groups 15 years of age and older had a statistically significant
increase in unintentional poisoning death rate with the exception of those 65 years of age and older. those 65
years of age and older had an increase but it was not statistically significant. Canadians 20 to 29 years of age had
the largest annual percent increase of unintentional poisoning death rate with an average 16.5 per cent each year.
this was followed by canadians 30 to 39 years of age with an average increase of unintentional poisoning death
rate of 15.7 per cent each year. due to small numbers, unintentional poisoning deaths of canadians under the age
of 15 are not presented.
Intentional-Suicide
50 to 64 yrs APC= -4.1*
40 to 49 yrs APC= -4.1*
65+ yrs APC= 0.8
30 to 39 yrs APC= -4.9*
20 to 29 yrs APC= -2.3*
15 to 19 yrs APC= 1.9*
*= The annual per cent change (APC) is significantly different from zero at alpha=.05
over the 11-year period from 2008 to 2018, all age groups except for canadians 15 to 19 years of age and those
65 years of age and older had a significant annual decrease in the intentional-suicide death rate. Canadians 30 to
39 years of age had the largest average decrease of intentional-suicide death rate of 4.9 per cent each year. this
was followed by canadians 40 to 49 years of age and those 50 to 64 years of age, each with a 4.1 per cent average
annual decrease in the intentional-suicide death rate. due to small numbers, intentional-suicide poisoning deaths
of canadians under the age of 15 are not presented.
Evidence Summary on the Prevention of Poisoning in Canada T H E I M PA CT O F P O IS ON I NG S I N C A NA D A | 15Hospitalizations due to Poisonings
Data on rates of hospitalization due to harm poisoning hospitalizations, rates among
poisonings indicate that unintentional poisoning males appear to have decreased during the
hospitalizations have shown a steady increase study period, whereas hospitalization rates
from 2008 to 2018 (Figure 6). Hospitalization among females have fluctuated, with the 2018
rates for intentional self-harm poisonings hospitalization rate approximately twice that
were consistently higher than unintentional of the corresponding rate among males. Rates
poisonings but did not show a clear trend during for unintentional poisoning hospitalizations
the observed time period. When analyzing data were highest among individuals 65 years of age
between males and females (Figure 7), rates or older (Figure 8). Hospitalization rates for
for unintentional poisoning hospitalizations intentional self-harm poisoning were highest
remained quite similar from 2008 to 2014; among individuals ages 15 to 19, with the rate
however, rates among males in the later end of nearly doubling between 2009 and 2017
the observed time period increased compared (Figure 8).
to females. with respect to intentional self-
Figure 6 . Hospitalizations due to poisonings in Canada, excluding Quebec, by intent, fiscal years 2008 to 2018.
Age- standardized rates per 100,000 population
*= The annual per cent change (APC) is significantly different from zero at alpha=.05
Over the 11-year period from 2008/09 to 2018/19, hospitalization rate due to unintentional poisoning
had a statistically significant average increase of 2.7 per cent each year. The hospitalization rate for self-
inflicted poisonings increased on average 0.7 per cent each year. The hospitalization rate for poisoning
with undetermined intention had a statistically significant decreased on average of 2.0 per cent each
year. due to the small numbers, poisoning with intent to harm another person were not included.
Evidence Summary on the Prevention of Poisoning in Canada T H E I M PA CT O F P O IS ON I NG S I N C A NA D A | 16Figure 7 . Hospitalizations due to poisonings in Canada, excluding Quebec, by intent and sex, fiscal years 2008 to 2018.
Age-standardized hospitalization rates per 100,000 population.
Unintentional
Males APC=3.8*
Females APC=1.5*
*= The annual per cent change (APC) is significantly different from zero at alpha=.05
Over the 11-year period from 2008/09 to 2018/19, both males and females had a statistically significant
increase in the unintentional poisoning hospitalization rate. Males had an average increase of
hospitalization rate for unintentional poisoning hospitalizations of 3.8 per cent each year and females
had an average increase of 1.5 per cent each year.
Intentional-Self-Inflicted
Females APC=1.8*
Males APC= -1.3*
*= The annual per cent change (APC) is significantly different from zero at alpha=.05
Over the 11-year period from 2008/09 to 2018/19, males had a statistically significant average decrease
in the intentional-self-inflicted hospitalization rate of 1.3 per cent each year and females had a
statistically significant average increase in the hospital admission rate of 1.8 per cent each year.
Evidence Summary on the Prevention of Poisoning in Canada T H E I M PA CT O F P O IS ON I NG S I N C A NA D A | 17Figure 8 . Hospitalizations due to poisonings in Canada, excluding Quebec, by intent and age group (years), fiscal years 2008
to 2018. Age-specific hospitalization rates per 100,000 population.
Unintentional
65+ yrs APC= 0.4
50 to 64 yrs APC= 3.0*
20 to 29 yrs APC= 7.1*
30 to 39 yrs APC= 6.1*
40 to 49 yrs APC= 2.1*Emergency Department Visits due to Poisonings
Available data from emergency departments in highest rate of emergency department visits for
two canadian provinces (Alberta and ontario) unintentional poisonings during the observed
demonstrate a gradual increase in visits due to study period (Figure 11). emergency department
both unintentional and intentional poisonings, visits for unintentional poisonings among
with the rate of unintentional poisonings being those ages 20 to 29 also saw a marked increase
more than double that of intentional self-harm during the study period. Similar to poisoning
poisonings in 2018 (Figure 9). males comprised hospitalizations, rates of intentional self-harm
a greater proportion of emergency department poisoning emergency department visits were
visits due to unintentional poisonings, whereas highest among those ages 15 to 19 and showed
rates of intentional-self harm poisoning were an increasing trend during the study period
higher among females (Figure 10). Young (Figure 11).
children younger than five years old had the
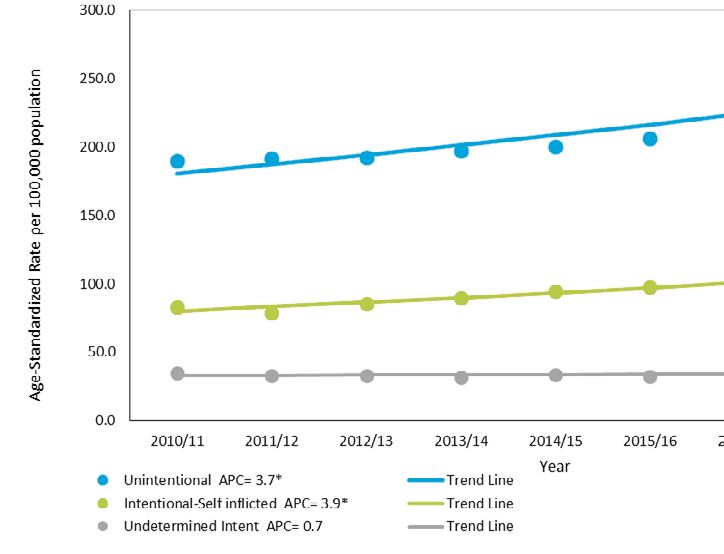
Figure 9 . Emergency department visits due to poisonings in Alberta and Ontario by intent, fiscal years 2010 to 2018.
Age-standardized rates per 100,000 population.
*= The annual per cent change (APC) is significantly different from zero at alpha=.05
over the nine-year period from 2010/11 to 2018/19, the emergency department visit rate of residents
of Alberta and Ontario due to unintentional poisoning had a statistically significant average increase
of 3.7 per cent each year. The visit rate for intentional-self-inflicted poisonings also had a statistically
significant average increase of 3.9 per cent each year. The emergency department visit rate for
poisoning with undetermined intention had a slight increase of 0.7 per cent each year. due to the small
numbers, poisoning with intent to harm another person were not included.
Evidence Summary on the Prevention of Poisoning in Canada T H E I M PA CT O F P O IS ON I NG S I N C A NA D A | 19Figure 10 . Emergency department visits due to poisonings in Alberta and Ontario by intent and sex, fiscal years 2010 to 2018.
Age-standardized rates per 100,000 population.
Unintentional
Males APC=4.9*
Females APC=2.4*
*= The annual per cent change (APC) is significantly different from zero at alpha=.05
over the nine-year period from 2010/11 to 2018/19, both males and female residents of Alberta and
Ontario had a statistically significant increase in the unintentional poisoning emergency department
visit rate. Males had a statistically significant average increase in emergency department visit rate of 4.9
per cent each year and females had a statistically significant average increase in emergency department
visit rate of 2.4 per cent each year.
Intentional-Self-Inflicted
Females APC=4.9*
Males APC=2.3*
*= The annual per cent change (APC) is significantly different from zero at alpha=.05
over the nine-year period from 2010/11 to 2018/19, both males and female residents of Alberta and
Ontario had a statistically significant increase in the intentional self-inflicted poisoning emergency
department visit rate. Males had a statistically significant average increase in emergency department
visit rate of 2.3 per cent each year and females had a statistically significant average increase in
emergency department visit rate of 4.9 per cent each year.
Evidence Summary on the Prevention of Poisoning in Canada T H E I M PA CT O F P O IS ON I NG S I N C A NA D A | 20Figure 11 . Emergency department visits due to poisonings in Alberta and Ontario by intent and age group (years), fiscal years 2010 to 2018. Age-specific rate per 100,000 population. Unintentional
Canadian Hospitals Injury Reporting and Prevention Program (CHIRPP)
the canadian Hospitals Injury Reporting and Prevention Program is a sentinel injury and poisoning
surveillance system that collects and analyzes data on injuries to people who are seen at the
emergency rooms of 11 pediatric hospitals and nine general hospitals in canada

Figure 12 . Visits due to poisoning (all intents) by age group and sex, 2012 to 2019.
data from the canadian Hospitals Injury Reporting and Prevention Program.

                                   600

                                                                                                                              Males
                                                                                                                              Females
Cases per 100,000 CHIRRP Records

                                   450

                                   300

                                   150

                                    0
Case Records for Canadian Poison Centres
Figure 13 . Yearly number of case records tracked by five Canadian poison centres.
Note: range of years in which data was available differed between the included poison centres.
Ontario Poison Centre
Number of Poison Centre Case Records (thousands)
Québec Poison Centre
Alberta Poison Centre
British Columbia Poison Centre
Nova Scotia Poison Centre
Based on data from five Canadian poison centres that collectively serve 11 provinces and territories
(British columbia, Yukon, Alberta, Saskatchewan, northwest territories, nova Scotia, Prince edward
Island, ontario, manitoba, nunavut, and Québec), 209,534 cases were recorded in 2018 by local poison
centres, which averages to 574 poison centre cases recorded per day.
11.3%
Other
Figure 14 . Proportion
(percentage) of poison centre
Poison cases by intent in 2018. data from
27.1% Centre Cases the British columbia, Alberta,
ontario, and nova Scotia poison
Suspected Suicide in 2018 centres. note: Québec poison
61.6% centre data not included due to
Unintentional differences in coding of intent.
With respect to intent, the large majority of poison centre case records in 2018 were classified as being
unintentional poisoning episodes. Importantly, more than a quarter of these poison centre cases in 2018
were classified as being a suspected suicide.
Evidence Summary on the Prevention of Poisoning in Canada T H E I M PA CT O F P O IS ON I NG S I N C A NA D A | 23Figure 15 . Number of poison centre case records classified as being unintentional (left) and suspected suicide (right) by
provincial poison centres, 2012 to 2018. Note: Data from the Québec Poison Centre is coded differently than the other Centres;
as such, only cases coded as strictly unintentional (involontaire) and intentional (volontaire; which includes self-harm/
suicide/assault/ homicide cases) are presented.
Number of Poison Center Case Records (thousands)
Number of Poison Center Case Records (thousands)
When poison centre case records data were analyzed by year and intent, results demonstrated that,
while cases records for unintentional poisonings remained relatively constant between 2012 and 2018,
a steady increase in the number of cases related to suspected suicide attempts was seen across all five
poison centres, with the most marked increases seen in the ontario and Alberta poison control centres.
Percentage of Poison Centre Case Records Figure 16 . Proportion (percentage) of poison centre cases
by age group (years) in 2018. data from British columbia,
Age ontario, Québec, and nova Scotia poison centres. note:
Alberta poison centre data not included due to differences
in age-group reporting.
32 .1% 5 or less
the largest proportion of poison centre case
4.5% 6 to 12 recorded made in 2018 were concerning
children ages five years or less (Figure 16).
11.5% 13 to 19
when considering the location in which cases
originated, data from four poison centres
14.7% 20 to 29
indicated 85 per cent of poison centre cases
10.2% 30 to 39 in 2018 originated from a call placed from the
7.7% 40 to 49 caller’s own residence while four per cent were
from a healthcare facility (Québec Poison centre
7.6% 50 to 59
60 and data unavailable).
11.7% above
Evidence Summary on the Prevention of Poisoning in Canada T H E I M PA CT O F P O IS ON I NG S I N C A NA D A | 248.8%
2 .5%
Other
26.2%
Major Clinical Effects
No Expected Clinical Effects
11.6%
Moderate Clinical Effects
Outcome of
Poison Centre
Figure 17 . documented outcome of
four canadian poison centre cases in
Cases in 2018
2018. data from the Alberta, ontario,
Québec, and nova Scotia poison
centres. data from British columbia 50.9%
poison centre were not available. Minor or Minimal Clinical Effects
when considering the outcome of poison centre cases in 2018, a majority of the cases had either no
expected or minimal clinical effects (Figure 17), e.g. self-limited gastrointestinal symptoms (aka “mild
GI upset”), skin irritation, first-degree dermal burn, transient cough. A minority of cases had any major
clinical effect. Of note, out of the 182,290 poison centre cases in 2018 (excluding British Columbia data),
390 deaths (0.2%) were recorded as an outcome of the exposure.
Data on the specific substances associated with poison centre cases were available for the British
columbia, nova Scotia and Québec poison centres (Appendix c). Analgesics and household cleaners
were the leading pharmaceutical and non-pharmaceutical causes for cases at all three of the included
poison centres.
Limitations of Poisoning Data
Several limitations of the poisoning data in substance-related, addictions, and mental-health
this evidence Summary should be mentioned conditions that often involve substances such as
and kept in mind when interpreting the data opioids and other illicit drugs. data on deaths,
presented. Firstly, the statistics for mortality hospitalizations, and emergency department
due to poisonings are based on the underlying visits due to mental health, addictions and
cause of death. this is an important point as substance-use-related conditions are beyond
poisonings can often play a pivotal role in the scope of this evidence Summary and are
deaths but may not be coded as the underlying captured using different ICD-10 codes than the
cause of death. For example, a death due to ones used presently. As such, while the data
a motor vehicle collision under the influence in this evidence Summary present the overall
of drugs or alcohol would most likely be impact of poisonings in canada, it does not
coded as a traffic-related cause of death with allow for interpretation of trends or patterns
poisoning being a supplementary factor. in substance-use, illicit drug use, or addictions
thus, the statistics presented in this evidence and mental health issues. data on emergency
Summary can be seen as only conservative department visits (cHIRPP) due to poisoning
estimates as to the true burden of poisonings in Canada reflect only that of the participating
in canada. Secondly, the data in this evidence hospitals and not all emergency departments
Summary do not capture the growing burden of in the country and thus may not be completely
Evidence Summary on the Prevention of Poisoning in Canada T H E I M PA CT O F P O IS ON I NG S I N C A NA D A | 25You can also read


