Examining the Effectiveness of Computer-Supported Collaborative Learning for Language Proficiency Purposes - MDPI
←
→
Page content transcription
If your browser does not render page correctly, please read the page content below
sustainability

Article
Examining the Effectiveness of Computer-Supported
Collaborative Learning for Language Proficiency Purposes
Alexandra Dashkina, Aleksandra Kobicheva * , Tatiana Lazovskaya, Elena Tokareva, Dmitriy Tarkhov
and Irina Guselnikova

                                           Institute of Humanities, Peter the Great Saint-Petersburg Polytechnic University, 195251 St. Petersburg, Russia;
                                           dashkina_ai@spbstu.ru (A.D.); lazovskaya_tv@spbstu.ru (T.L.); tokareva_eyu@spbstu.ru (E.T.);
                                           tarkhov_da@spbstu.ru (D.T.); guselnikova_iv@spbstu.ru (I.G.)
                                           * Correspondence: kobicheva_am@spbstu.ru

                                           Abstract: (1) The main goal of this research was to assess the effectiveness of the computer-supported
                                           collaborative learning for language learning purposes using the indicators of students’ learning
                                           outcomes and the level of their engagement, as well as to determine the most effective benchmarks for
                                           teams’ forming. (2) Methods: A total of 81 undergraduate students studying at the Humanity Institute
                                           of Peter the Great Polytechnic University voluntarily participated in the study. For our research, we
                                           used the results on final English testing and survey results on students’ engagement. Each year, three
                                           groups of students were formed into teams according to three criteria: leadership skills, academic
                                           performance and personal choices. Microsoft Excel 2016 tools were used for data interpretation:
                                           testing samples for normality, a one-way analysis of variance (ANOVA) and comparison of means.
                                           Neural network dependencies of test results were built by means of Mathematica Wolfram Software.
                                           (3) Results: According to the results of this study, the underlying principles of forming teams highly
Citation: Dashkina, A.; Kobicheva,         influenced the indicators of students’ English proficiency; in particular, the experiment proved
A.; Lazovskaya, T.; Tokareva, E.;
                                           the effectiveness of selecting students according to their academic performance. In addition, the
Tarkhov, D.; Guselnikova, I.
                                           correlation analysis revealed that the engagement of students played an important role and influenced
Examining the Effectiveness of
                                           the results of their learning. This was especially seen in a group where teams were distributed due
Computer-Supported Collaborative
Learning for Language Proficiency
                                           to the differences in academic performance. (4) Conclusions: As the COVID-19 pandemic is an
Purposes. Sustainability 2022, 14, 5908.   ever-changing situation, it is important to implement effective learning models that promote higher
https://doi.org/10.3390/su14105908         learning outcomes and students’ engagement. This study contributes to such knowledge and provides
                                           insightful implications to academia.
Academic Editors: Danial Hooshyar,
Michael D. Kickmeier-Rust and Nour
                                           Keywords: e-learning; computer-supported collaborative learning; language learning; emotional
El Mawas
                                           engagement; cognitive engagement; behavioral engagement
Received: 4 March 2022
Accepted: 6 May 2022
Published: 13 May 2022

Publisher’s Note: MDPI stays neutral
                                           1. Introduction
with regard to jurisdictional claims in         The devastating nature of the COVID-19 pandemic has affected almost every sector
published maps and institutional affil-    of society in the world, and higher education is no exception [1]. In terms of teaching,
iations.                                   the COVID-19 pandemic has disrupted most existing practices, with the exception of
                                           specific online providers such as the Open University and forced the teaching and learning
                                           process to change unpredictably and quickly [2]. A variety of learning technologies and
                                           approaches were introduced to maintain the quality of higher education. Some of them
Copyright: © 2022 by the authors.
                                           proved to be effective for learning professional disciplines, others for language learning
Licensee MDPI, Basel, Switzerland.
                                           purposes. Many researchers have analyzed the transformation brought about by such a
This article is an open access article
                                           pedagogical approach as computer-assisted language learning (CALL), which appeared in
distributed under the terms and
                                           the theory and practice of teaching in the 1990s. This methodology is evolving and will
conditions of the Creative Commons
Attribution (CC BY) license (https://
                                           make it possible to apply digital education on a wide scale. This type of learning proved
creativecommons.org/licenses/by/
                                           instrumental in the integration of individual and personality-oriented education. However,
4.0/).
                                           in view of the situation which the whole world faced during the COVID-19 pandemic,

Sustainability 2022, 14, 5908. https://doi.org/10.3390/su14105908                                          https://www.mdpi.com/journal/sustainability
Sustainability 2022, 14, 5908                                                                                           2 of 16

                                scientists and educators started to explore the ways of collaborative work among students
                                isolated from one another.
                                     The goal of the current research is to investigate the concrete technologies of collab-
                                orative learning for foreign language proficiency purposes with the help of computer-
                                supported learning in the system of teaching foreign languages in technical universities,
                                and to assess the effectiveness of the proposed teaching approaches using the indicators
                                of students’ learning outcomes and the level of students’ engagement. Thus, the paper is
                                focused on three major research questions:
                                1.   Do the criteria of forming the teams influence the indicators of students’ learning
                                     outcomes (English proficiency)?
                                2.   Do the criteria of forming the teams influence the level of students’ engagement?
                                3.   Does the level of students’ engagement influence the students’ learning outcomes?
                                     The rest of this paper is organized as follows. Section 1 describes the theoretical
                                background on computer-assisted language learning (CALL) and computer-supported col-
                                laborative learning (CSCL). In Section 2, the methodological basis of the study is described.
                                In Section 3, the results on English proficiency and engagement level in three groups of stu-
                                dents are presented. Furthermore, a correlation analysis of students’ learning outcomes and
                                engagement levels in CSCL are analyzed and discussed. Lastly, the conclusion, limitations
                                of the study and future research directions are given in Section 4.

                                1.1. Literature Review
                                1.1.1. Computer-Assisted Language Learning (CALL)
                                      In the last decade, computers have inevitably become an integral part of education.
                                CALL is of particular relevance for language learning. In a broad sense, CALL is defined
                                as “the search for and learning of applications on a computer for teaching and learning
                                languages” [3]. Such a definition reveals the term as the use of computers for the presenta-
                                tion of linguistic material. However, Schofield [4] defines CALL as any form of language
                                learning or language teaching performed using computers. Another definition of CALL is
                                based on its variability characteristic, which is “any process in which a student uses a com-
                                puter and improves his language as a result” [5]. This term is widely used to refer to “the
                                field of technology and teaching and learning a second language” [6]. CALL has evolved
                                to include material design, technology, pedagogical theories and teaching methods [5]. It
                                is now used regularly in a variety of learning situations. Thus, the possession of digital
                                devices for language learning; general computer literacy, i.e., higher digital and computer
                                literacy to use a wide range of skills for general or “technical purposes”, as well as for
                                educational purposes, being “tech savvy” [7]; and the frequency of use of these devices
                                for language learning purposes, weighted by their ratio, can be considered as potential
                                determinants of language achievement.
                                      CALL helps learners not only improve their language skills, but also allows them to
                                learn at their own pace and get fast feedback, bug and correction information and error
                                analysis. In other words, it is the learner who gets to control the educational track of their
                                own learning, construct meaning and evaluate and control their own work [8]. Jaber [9]
                                also mentions that with the help of a computer, students can collaborate, use their critical
                                thinking skills and find alternatives to problem solving in student-centered classrooms.
                                      A literature analysis shows that foreign language learners usually have a positive
                                attitude towards CALL. In a study by Al-Juhani [10], which examined the attitudes of EFL
                                students towards CALL, it was noted that participants had a positive attitude towards
                                CALL. In a study by Askar, Yavuz and Köksal [11], it was found that all perception scores
                                for both computer and traditional environments were in favor of CALL. Students also
                                reported positive changes, including focus and self-esteem while studying in the computer
                                lab. Another study [12], which focused on student and teacher attitudes towards CALL use,
                                noted that both students and teachers had a positive attitude towards CALL. CALL proved
                                to be especially effective in teaching writing. Hirvela [13] explains that college writing is
Sustainability 2022, 14, 5908                                                                                           3 of 16

                                becoming increasingly computer-based, and the computer is becoming a popular tool of
                                developing writing skills.
                                      However, a study by Min [14], examining the attitudes of adult Korean students
                                towards the use of computers in learning English as a foreign language, found that a
                                significant proportion of adult learners of Korean did not express positive attitudes towards
                                the use of computers in teaching English. In addition, Tang [15] sought to determine the
                                attitudes of ESL learners towards CALL and found no significant differences in participants’
                                attitudes towards computer-assisted learning. In summary, although most studies show
                                that students hailed CALL as a novel and fresh approach to teaching and learning foreign
                                languages, it is important to note that in some studies students were less enthusiastic about
                                CALL. However, it is now recognized that negative attitudes towards the use of technology
                                for language education hinder language achievement [16], while positive attitudes promote
                                the integration of technology into language teaching and learning and improve language
                                skills [17].

                                1.1.2. Computer-Supported Collaborative Learning (CSCL)
                                     Computer-supported collaborative learning (CSCL) is an area related to how com-
                                puters can support learning in groups (co-located and distributed). This also applies to
                                understanding computer-mediated actions in collaborative learning [18]. The research
                                questions addressed in the CSCL include how people learn with domain-specific tools, how
                                small groups interact and develop shared meanings over time and how online learning
                                in communities (e.g., MOOCs) creates new conditions for teaching and learning at scale.
                                In this rapidly developing field, Ludvigsen et al. [19] argue that CSCL is characterized
                                by a more or less stable basis of two epistemological positions: individualism and rela-
                                tionism. Individualism in CSCL means that researchers use a cognitive perspective on
                                group learning (e.g., collaborative cognition, predefined analytic categories, individual-
                                ized knowledge), while relationism in CSCL is consistent with a sociocultural perspective
                                (emergent collaboration, mediation, learning as a process).
                                     CSCL promotes the creation of learning communities that are consistent with the edu-
                                cational paradigm emerging in today’s social and technological environment, in which par-
                                ticipants can alternate between the roles of student, designer and active participant [20–22].
                                CSCL involves creative problem solving from an interdisciplinary perspective during a
                                period of intense collaboration when students need to find a co-created solution, develop
                                a project, create a prototype or produce a product. The collaborative process leads to
                                multiple opportunities for constructing shared meaning, which entails both convergence
                                and divergence of cognition or knowledge [23,24]. Convergence and divergence occur
                                in a process of intense negotiation aimed at achieving a common vision and outcome,
                                overriding previous individual constructs and therefore encouraging a restructuring of
                                previous knowledge [25].
                                     Learning processes within CSCL require detailed planning, in which all pedagogical,
                                educational, social and technological aspects must be clearly defined [26–29]. Engagement
                                in the search for a common goal is a key element through which the actions are carried out
                                and the structure of cooperation is shaped [30].
                                     At the stage of implementation of the educational process, organizing effective in-
                                teraction is a problem at the organizational, social and cognitive levels [25,31]. Through
                                planned exchanges of information, each student must restructure their previous knowledge
                                and be ready to learn with others. Motivation, task engagement, in-group support and
                                a sense of community are key factors for students’ success [32–34]. Computer-assisted
                                language learning allows educators to adjust the learning input to the specific requirements
                                of individual students. Moreover, learners can get instant feedback on their answers, which
                                enables them to assess their own performance [35]. Teacher feedback is also very important,
                                due to its influence on the management and adjustment of knowledge convergence and
                                divergence processes [25,31,34,36].
Sustainability 2022, 14, 5908 4 of 16
When evaluating CSCL processes, one should take into account not only the achieve-
ment of goals or the final result in the form of a product, but also the dynamics of the
interactions that took place, as well as cognitive and social elements [37,38]. In this respect,
participatory appraisal is a very appropriate system for reviewing individual and group
achievements, whether through summative or formative appraisal processes [37–39].
Collaboration and negotiation are essential to learning at CSCL as they influence the
satisfaction levels of both students and teachers who participate in the experience [31,40].
Therefore, collaboration must be carefully defined during the design phase of the CSCL so
that the implementation includes consideration of social relationship aspects and ensures
the articulation of cognitive aspects related to task performance and intended knowl-
edge construction [23–25,41]. In this regard, intragroup emotional support is especially
important [33].
The technology tools used in CSCL have a significant positive impact on learning
processes and the underlying dynamics of collaboration [42–44]. Technological resources
should be chosen in accordance with the learning objectives pursued and should be consis-
tent with the planned pedagogical, cognitive and social activities [45,46]. In this regard, a
technology that enables collaborative learning must be able to structure complex tasks and
facilitate group analysis and negotiations that will lead to task solution [47].
Computer-facilitated communication between students will go smoothly only if collab-
orative learning activities are in place [48]. To facilitate a networked learning environment
conducive to the sharing of knowledge, it is essential to form cohesive groups of learners
taking into consideration their individual preferences and characteristics.
CSCL gives all learners a number of advantages, even if they are backward in their
studies. All team members are more motivated since teamwork reduces stress levels and
saves time. CSCL produces a synergy effect as teams of students have higher levels of
thinking and keep information longer than individual learners [49]. Students appreciate
being given a lot of responsibility for their performance, which results in better learning
outcomes [50].
CSCL coupled with structured, online intervention is especially beneficial for students
with low levels of foreign language proficiency since educators can use the class time more
effectively. In such an environment, peer support and technology become scaffolds in the
learning process [51].
At the moment, CSCL is facilitated by special groupware developed for educational
purposes, but these computer applications do not embrace social, motivational and emo-
tional demands [52]. In-depth research needs to be conducted to meet these demands, and
CSCL will produce the desired results only if teams of learners are formed not randomly,
but in evidence-based ways.
1.1.3. Teams’ Forming
Student teams face many challenges, especially if they have little teamwork expe-
rience [53]. The following are some of the main factors that influence successful team
building [53–59]: group composition, different motivations, expectations or obligations
within teammates, personality conflicts, task ambiguity, role ambiguity, nervousness in
knowledge levels, lack of interpersonal communication skills, etc. Among these, interper-
sonal conflicts related to unequal efforts and contributions of team members and poor time
management stand out [60].
Several strategies have been considered in the work of some researchers to promote the
correct formation of a team [53,56,57,61,62]: small group, processing group and individual
contributions, coaching sessions, reflection sessions on teamwork, formal and informal
communication, providing feedback on individual and collective work in a team, self-
assessment and peer assessment, incentives, etc.
One of the ways is forming a team on the basis of psychometric data. In one study,
the authors used Myers–Briggs Type Indicator metrics to evaluate the team members’
personality traits so as to strike the right balance between them and select the team membersSustainability 2022, 14, 5908 5 of 16
whose psychological characteristics are complementary [63]. Psychological compatibility
can be measured in a number of ways: by getting students to complete pen-and-paper
tests, watching their behavior in the course of teamwork, distributing questionnaires to
determine the students’ social preferences, organizing psychological trainings or by simply
allowing them to choose their learning partners.
Another way is to unite students who have high outcomes with those whose outcomes
are weak.
Higher-level learners should act as motivators involving their peers in teamwork
since they tend to initiate communication with the teacher and other students. Each team
member should be given a clearly defined role in the team collaboration and assume
collective responsibility for the final result [64].
A cohesive atmosphere (including psychological safety, positive emotions and a struc-
tured team organization) is directly related to the students’ performance [65], so it makes
sense to do research into different ways of organizing collaborative learning. After con-
ducting a number of experiments with different techniques, it will be possible to compare
the learning outcomes, and the technique with the best outcome should then be integrated
into the educational process. Whereas in the course of face-to-face learning a teacher could
form teams on the basis of personal observations, it is virtually impossible in the distance
learning environment.
2. Materials and Methods
On the basis of the Humanity Institute of Peter the Great St. Petersburg Polytechnic
University we elaborated an educational model based on the computer-supported collab-
orative learning approach. During the whole semester, students were working in teams
(special assignments were created in the Moodle, separate rooms in MS Teams were devel-
oped for collective discussions, the additional material was uploaded to Google platform).
To distribute students into teams we used several criteria. The experiment, which aimed at
identifying the best possible criterion according to which teams of learners can be formed,
was conducted in two spring semesters (2020–2021) when the pandemic caused abrupt
transition to distance learning. It was carried out at Peter the Great Polytechnic Univer-
sity in the groups of students majoring in linguistics in listening comprehension classes.
Each year, groups were formed in accordance with three criteria, the first of which was
personality traits. The students who possessed leadership skills worked in collaboration
with the learners who were reluctant to assume responsibility for the completion of the
assignment and willing to accept a subordinate role. The students’ leadership characteris-
tics were identified on the basis of the test “Diagnosing leadership skills” [66]. The second
principle of forming teams for collaborative work was the students’ personal preferences:
they were guided by their personal affinities when they chose the partners to work with.
In accordance with the third criterion, the students with a high level of foreign language
proficiency worked in collaboration with the ones whose level of foreign language training
was inadequate.
The experiment was conducted in the fall semesters of 2020–2021 in 6 groups of second-
year students (75 females and 6 males, 81 total). In 2020 and 2021, we had different groups of
students, since listening comprehension is studied through only one semester in accordance
with the curriculum of the bachelor course for students specializing in linguistics. In 2021,
we had a sample of 3 equal groups, 13 students in each of them, whereas in 2022 the number
of students in each group equaled 14 (since more students had enrolled in the course).
Each semester, we had 3 groups of students that were studying according to the proposed
learning model, but the principles according to which the students were selected to the
working teams were different. The group of students in which the teams were formed on
the basis of psychological factors (leadership skills) is referred to as Group A (N = 27); the
group in which the teams were formed depending on the level of academic attainments is
Group B (N = 27); and the group in which teams were created according to the students’
individual choices is Group C (N = 27).Sustainability 2022, 14, 5908 6 of 16
For our research, we used the scores of the initial and final testing on English profi-
ciency. Both tests were structured in a similar way: they included one lexical multiple-choice
assignment (maximum 20 points); one listening comprehension assignment in which it was
necessary to identify whether the statement was true or false on the basis of the first part of
an audio record (maximum 15 points); and one multiple-choice listening comprehension
assignment on the basis of the second part of the same audio record (maximum 15 points).
The final test was based on the lexical material and the topics which were studied in the
course of the experiment. To evaluate students’ level of engagement we used the Academic
Engagement Scale based on the three most common dimensions identified by researchers
(behavioral, emotional and cognitive engagement). To collect the data, we conducted an
online survey that consisted of three questionnaires. The first questionnaire measuring the
students’ cognitive engagement included six statements:
(a) I am willing to acquire new knowledge.
(b) I feel confident in the course of acquiring new knowledge.
(c) I take many efforts when I do my home assignment.
(d) I am always involved in classroom discussions and interested in the topics un-
der discussion.
(e) I pay attention in class and do my home assignments very carefully; therefore, I
understand the learning material.
(f) If I do not understand the learning material, I ask questions.
The students were asked to give from 1 to 5 points to each statement (1—totally
disagree; 5—absolutely agree).
In the second questionnaire, which was aimed at measuring emotional engagement,
the students also rated their attitudes on a 5-point scale, as in the first questionnaire. The
second questionnaire included four statements:
(a) I enjoy attending foreign language classes.
(b) I am willing to continue studying the foreign language after graduation.
(c) I enjoy doing home assignments given by the foreign language teacher.
(d) I feel tension and inner uneasiness when I have to study a foreign language.
Behavioral engagement was measured in percentages on the basis of the following
three criteria:
(a) The completed assignments were regularly uploaded in Moodle;
(b) The students attended the classes in MS Teams;
(c) The learners studied the material available on the Google platform.
The results of the questionnaires were then checked for validity using SPSS. We tested
the validity of Pearson’s product-moment correlation using the principle of correlating, or
connecting, each item’s score with the overall score derived from the respondents’ answers.
The results of the questionnaire validity test (Pearson product-moment correlation) showed
that all items are valid. After checking and testing the questionnaire, the Cronbach reliability
coefficient alpha was 0.871.
Microsoft Excel 2016 tools were used for data interpretation [67]: testing samples for
normality, a one-way analysis of variance (ANOVA) and comparison of means. Neural net-
work dependencies of test results were built by means of Mathematica Wolfram Software.
3. Results
3.1. English Proficiency Results
At first, we checked all formed groups’ results distribution. The diagnostic test data
of each team were distributed according to the normal distribution (based on Pearson’s
chi-squared test). The means were equal at the 5 percent level based on the three sample
Student’s t-test. Smooth histograms are presented in Figure 1. Thus, we can reliably state
that there were no differences in the initial results between groups.Sustainability 2022,2022,
Sustainability 14, x
14,FOR
5908 PEER REVIEW 7 of 16
Figure
Figure 1. Smooth
1. Smooth histogram
histogram of diagnostic
of diagnostic test data
test data distribution distribution
of three teams. of three teams.
In all the groups participating in the experiment, the students worked with the course
book by InDashkina,
all the groups participating
A.I, Popova, N.V. calledin the experiment,
Listening comprehensionthe students
tasks worked w
for linguistic
book by Dashkina, A.I, Popova, N.V. called Listening comprehension tasks fo
majors [68].
jorsAll the students completed some listening comprehension assignments individually
[68].
in class, but the tasks that required listening for details and listening aimed at full under-
standingAllwerethecompleted
studentsincompleted
collaboration.some listening
The examples comprehension
of such assignment
tasks included finding
in class, and
synonyms butwords
the tasks that required
corresponding listening
to the definitions forasdetails
as well integrativeandassignments,
listening aimed
in which the students were asked to find differences between the video they watched and
standing were completed in collaboration. The examples of such tasks inc
the text they read. Sometimes, they had to prepare a monologue related to a listening
synonyms and
comprehension topicwords
using opencorresponding to theproduce
electronic resources, definitions as well
a transcript as integrativ
of a video or
in which the students were asked to find differences between the video the
watch another video dedicated to the same topic.
the Teamwork
text theywasread. employed through discussion and correspondence in MS Teams. The
Sometimes, they had to prepare a monologue related
learners had regular meetings in a distant format on the MS Teams platform; they added
comprehension
the teacher as a member topic using
of the team,open
and eachelectronic
meeting was resources,
recorded. produce
The teacherawas transcrip
watch another
informed about the video dedicated
time of online meetings,to the
whichsame topic.
enabled him to join the discussion at
some point and check how much the team members contributed to the teamwork. When
Teamwork was employed through discussion and correspondence in M
the students did a lexical assignment, they recorded their answers in the MS Teams chat.
learners
Even thoughhad regular
the teacher didmeetings
not have time in toa join
distant
all theformat
meetingson thesmall
of the MSgroups,
Teamsheplatfor
theaccess
had teacher asrecord.
to their a member of the team, and each meeting was recorded. Th
Here is an
informed about the example to illustrate
time ofhow a small
online group of students
meetings, whichprepared
enabled a monologue
him to join the
“Dressing for a job interview”. Before the meeting in MS Teams, they worked individually
some
and foundpoint
someand checkonhow
information muchabout
the Internet the team members
what clothes contributed
candidates should wearto forthe tea
the
an students
interview. At thedidMSaTeams
lexical assignment,
meeting, theytorecorded
they took turns their answers
read the recommendations theyin the M
had found and discussed in English which of them could be included
Even though the teacher did not have time to join all the meetings of the sm in the presentation.
One of the team members recorded the plan of the monologue in the chat. Such a discussion
had
on the access
MS Teams toplatform
their record.
gave the learners a chance to speak English outside the classroom
and alsoHere is an
enabled theexample to illustrate
teacher to check whether the how a small
meeting group
actually took of students prepared
place.
All the groups that participated in the experiment
“Dressing for a job interview”. Before the meeting in MS Teams, were given exactly the same assign-
they worke
ments; the only difference was the criteria, according to which teams were formed.
andAtfound
the endsome information
of the semester, on the
the students sat Internet aboutonwhat
a final test based clothes
the topics studiedcandidate
in
forcourse
the an interview. At theIt MS
of the experiment. was aTeams
50-pointmeeting, theytest
multiple-choice took turns
in the sameto readasthe reco
format
the diagnostic
they had found one. Smooth histograms ofin
and discussed theEnglish
final test which
data are presented
of them in Figurebe
could 2. included
tation. One of the team members recorded the plan of the monologue in th
discussion on the MS Teams platform gave the learners a chance to speak E
the classroom and also enabled the teacher to check whether the meeting
place.
All the groups that participated in the experiment were given exactlustainability 2022, 14, x FOR PEER REVIEW
tainability 2022, 14, x FOR PEER REVIEW
Sustainability 2022, 14, 5908 8 of 16
Figure 2. Smooth histogram of final test data distribution of three teams.
Figure
Figure2.Note
Smooththat thehistogram
histogram
2. Smooth offinal test
final test data
data
of finaloftest
the
distribution first
of data
three two teams of
teams.
distribution were still
three distri
teams.
theNote
normal distribution
that the final test data ofand thetwo
the first null hypothesis
teams was notaccording
were still distributed rejected to at the
the
the Student’s
normal
Note that t-test.
distribution The
and the
the nullthird
final team’s
hypothesis
test data was final
of not testattwo
therejected
first data had
the 0.05 levelabased
teams different
were onstilldis
di
the Student’s t-test. The third team’s final test data had a different distribution. Figure 3
clearly
the normal
clearly
shows the difference
shows the distribution andinthe
difference in the distribution
theof distribution
null hypothesis
the increase
of the
in resultswas
increase
not
for the
in result
tworejected
tests. at
the Student’s t-test. The third team’s final test data had a differen
clearly shows the difference in the distribution of the increase in re
Figure
Figure 3. Smooth histogram
3. Smooth of the difference
histogram between
of the the resultsbetween
difference of the final the
and the diagnostic
results testsfinal an
of the
of three teams.
of three teams.
Further, for all the teams, we approximated the dependency of the final test result on
the diagnostic
Further, test data
for by
allmeans of the neural
the teams, network model. Neural
wedifference
approximated thenetwork models of the
dependency
Figure
for 3. Smooth
data allowed histogram
us to see of the
an overall pattern between
and revealed hidden onesthe results
[69,70]. of4the fina
Figure
the diagnostic
of three
illustrates teams.
that test data bywere
these approximations means of the neural network model. Neur
quite accurate.
for data allowed us to see an overall of
Thus, we also have the neural network model pattern andinrevealed
the increase the students’hidden
test on
results. The correspondent line graph is presented in Figure 5. It allows the interpretation
ofillustrates
Further,
the difference that these
for
between all approximations
thetest
the final teams, were
we approximated
data distribution quite
of the accurate.
first two, thethird,
and dependency
teams. o
the diagnostic test data by means of the neural network model. N
for data allowed us to see an overall pattern and revealed hidden
illustrates that these approximations were quite accurate.of three teams.
Further, for all the teams, we approximated the dependency of the final te
the diagnostic test data by means of the neural network model. Neural netw
Sustainability 2022, 14, 5908 for data allowed us to see an overall pattern and revealed hidden9 ones
of 16 [69,7
illustrates that these approximations were quite accurate.
Sustainability 2022, 14, x FOR PEER REVIEW
Figure 4. Neural network approximation of the dependency of the final test result on
test data and personality traits criteria of forming the team.
Thus, we also have the neural network model of the increase in the s
results. The correspondent line graph is presented in Figure 5. It allows the in
of the4.difference
Figure between
Neural network theoffinal
approximation test dataofdistribution
the dependency ofonthe
the final test result first two, and
the diagnostic
test data and personality traits criteria of forming the team.
Figure5. 5.
Figure Neural
Neural network
network approximation
approximation of the of
of the dependency dependency of the difference
the difference between the results ofbetween
the
thefinal and
final the diagnostic
and tests of three
the diagnostic teststeams on theteams
of three diagnostic test data.
on the diagnostic test data.
The progress made by the students by the end of the experiment is clearly visible
on theThe progress
line graph made
built by by network.
a neural the students by the
The results end
of the of the experiment
diagnostic test are on the is clea
horizonal axis, whereas the difference between the results of the final and the diagnostic
the line graph built by a neural network. The results of the diagnostic test are
tests is given on the vertical axis.
zonal Theaxis,
mostwhereas
considerable theprogress
difference between
was made the results
in the groups where theof the
teams final and the dia
consisted
is given on the vertical axis.
of the students with different levels of foreign language training (the green graph). The
learnersThewhose
mostforeign language proficiency
considerable progresswas was
just atmade
a rudimentary
in the levelgroupsbenefited fromthe tea
where
the collaboration with the students with high levels of language proficiency. For this reason,
of the
the students
starting with
point of the different
graph levels
is the highest of vertical
on the foreign language
axis. training
All the graphs bulge in(the
the green
learners
middle, whose
which meansforeign language
that the students proficiency
with the average results was just
of the at a rudimentary
diagnostic text made lev
more impressive progress than the learners with the lowest level of
from the collaboration with the students with high levels of language proficielanguage training, since
it was easier for them to internalize the new learning material than for the ones who had
reason, the starting point of the graph is the highest on the vertical axis. A
hardly any initial foreign language base.
bulge Thein the middle,
groups in which which
the teams means that the
were formed studentswith
in accordance with thethe average
results of the results
psychological
nostic text made test, and in which
more learners with
impressive leadership
progress qualities
than collaborated
the learners withthe
with the lowes
guage training, since it was easier for them to internalize the new learning m
for the ones who had hardly any initial foreign language base.
The groups in which the teams were formed in accordance with the rSustainability 2022, 14, 5908 10 of 16
students who accepted a subordinate role (the blue graph in the middle), made less sub-
stantial progress than the previous group. The students with leadership skills did not
necessarily have high levels of foreign language proficiency. They facilitated teamwork so
that the whole process of completing assignments ran smoothly, but they were unable to
help their partners when the latter had queries. Nevertheless, the progress achieved by
Sustainability 2022, 14, x FOR PEER REVIEW
these groups was more substantial than the progress in the groups in which the teams were
formed on the basis of the students’ personal preferences. Very often, the team members
did not produce the desired synergy effect because they could not share knowledge or
facilitate teamwork. Indeed, students with low levels of academic performance often
In all the groups, the students whose initial level of foreign language pr
formed partnerships and completed assignments together, but they did not benefit from
very
such high did not
collaboration. have evidence
Anecdotal much room forthat
suggests improvement;
top performers also therefore,
tended totheformline gra
that they made
partnerships, and they less progress
could thanconsiderable
certainly gain the ones advantage
with thefrom average
workingresults of the d
together.
However, students with high levels of academic performance did
Thus, the results of the tests illustrate that when small groups were formednot make much progress
because the difference between their results in the final test and the diagnostic one was
of substantial.
not difference in academic performance, the progress made by students was
cant In than
all thewhen
groups,the other criteria
the students were
whose initial applied.
level The
of foreign students
language who was
proficiency worked i
very high did not have much room for improvement; therefore, the
formed in accordance with this principle could clearly identify their own fore line graphs illustrate
that they made less progress than the ones with the average results of the diagnostic test.
deficiencies
Thus, the results by comparing
of the themselves
tests illustrate with
that when small thewere
groups other team
formed onmembers
the basis of [71]. W
dents collaborated
difference with the partners
in academic performance, the progressofmade
theirbyown choice
students was as
morewell as in the team
significant
than when the other criteria were applied. The students
the basis of the psychological test, it was more difficult for them who worked in small teams
to draw
formed in accordance with this principle could clearly identify their own foreign language
with their partners because in many cases they were all at the same rudime
deficiencies by comparing themselves with the other team members [71]. When the students
foreign language
collaborated proficiency.
with the partners of their own choice as well as in the teams formed on the
basis of the psychological test, it was more difficult for them to draw comparisons with
their
3.2.partners
Resultsbecause in many cases they were all at the same rudimentary level of foreign
on Engagement
language proficiency.
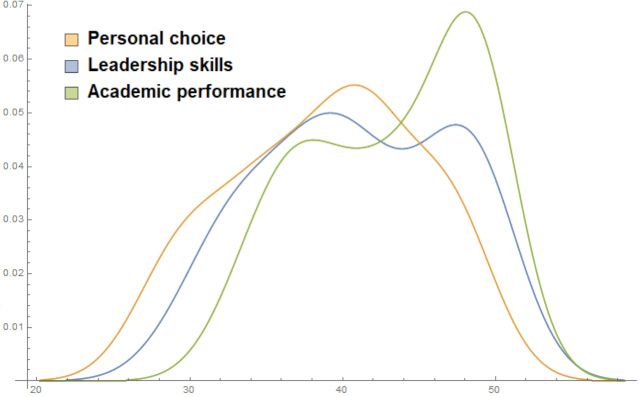
The highest levels of cognitive and emotional engagement were reg
3.2. Results on Engagement
groups in which the teams were formed on the basis of the students’ indiv
The highest levels of cognitive and emotional engagement were registered in the
ences, whereas the lowest level of emotional engagement was observed in
groups in which the teams were formed on the basis of the students’ individual preferences,
whichthe
whereas thelowest
criterion ofemotional
level of formingengagement
the teamswas was the difference
observed in academic
in the groups in which perf
the
the lowest level of cognitive engagement was observed in the and
criterion of forming the teams was the difference in academic performance, the in wh
groups
lowest level of cognitive engagement was observed in the groups in which the criterion of
rion of forming the teams was leadership qualities. Figure 6 illustrates this o
forming the teams was leadership qualities. Figure 6 illustrates this observation.
Figure
Figure 6. Smooth
6. Smooth histogram
histogram of emotional
of emotional engagement engagement test of
test data distribution data
threedistribution
teams. of three
The students felt more positive when they were free to choose the partn
felt comfortable with. On the contrary, when they had to work with the part
sometimes had difficulty establishing rapport with, they perceived it as aSustainability 2022, 14, 5908 11 of 16
The students felt more positive when they were free to choose the partners who they
felt comfortable with. On the contrary, when they had to work with the partners that they
sometimes had difficulty establishing rapport with, they perceived it as a restriction of their
Sustainability 2022, 14, x FOR PEER REVIEW
personal freedom, which resulted in the backlash and affected the levels of the cognitive
and emotional engagement (see Figure 7).
Figure
Figure 7. Smooth
7. Smooth histogram
histogram of cognitive
of cognitive engagement
engagement test dataofdistribution
test data distribution three teams. of three team
However, the analysis of the behavioral engagement showed different results (see
However, the analysis of the behavioral engagement showed different
Figure 8).
re
Figure 8).
Figure 8. Smooth histogram of behavioral engagement test data distribution of three team
Figure 8. Smooth histogram of behavioral engagement test data distribution of three teams.
The behavioral engagement in the groups formed on the basis of different
The behavioral engagement in the groups formed on the basis of different levels of
individual preferences was the lowest, while in the groups formed on the basis of
individual preferences was the lowest, while in the groups formed on the basis of different
levels
levels of of academic
academic performance,
performance, studentsstudents
showed the showed the highest
highest level level of this indica
of this indicator.
3.3. Correlation Analysis
Since one of the goals of our study was to identify the influence of students
ment on their academic outcomes, a Pearson correlation analysis was conducted
late the significance of the indicators’ impact in three groups. The results are
Table 1.Sustainability 2022, 14, 5908 12 of 16
3.3. Correlation Analysis
Since one of the goals of our study was to identify the influence of students’ engage-
ment on their academic outcomes, a Pearson correlation analysis was conducted to calculate
the significance of the indicators’ impact in three groups. The results are shown in Table 1.
Table 1. Correlation analysis.
Group A Emotional Engagement Behavioral Engagement Cognitive Engagement Learning Outcomes
Emotional engagement 1
Behavioral engagement 0.24 1
Cognitive engagement 0.28 * 0.33 * 1
Learning outcomes 0.36 * 0.44 ** 0.22 1
Group B Emotional Engagement Behavioral Engagement Cognitive Engagement Learning Outcomes
Emotional engagement 1
Behavioral engagement 0.17 1
Cognitive engagement 0.21 0.28 * 1
Learning outcomes 0.31 * 0.67 *** 0.37 * 1
Group C Emotional Engagement Behavioral Engagement Cognitive Engagement Learning Outcomes
Emotional engagement 1
Behavioral engagement 0.26 1
Cognitive engagement 0.38 * 0.15 1
Learning outcomes 0.35 * 0.29 * 0.17 1
Note: * p < 0.05; ** p < 0.01; *** p < 0.001.
The correlation analysis revealed a positive correlation between all the indicators
considered. It was a strong relationship between behavioral engagement and learning
outcomes, especially in Group B (p < 0.001). Thus, most students who attended live online
classes, completed assignments in Moodle and learned materials using the Google platform
had higher results on final English testing. Emotional engagement significantly predicted
results on English testing (p < 0.05). At the same time, the relationship between emotional
engagement and behavioral engagement was weak in three groups (0.17 < R < 0.26).
Furthermore, cognitive engagement had a slight impact on students’ outcomes. Thus, it can
be concluded that the level of engagement significantly influences the students’ learning
outcomes, and this should be taken into account by teachers and academic managers.
4. Conclusions
According to the results on academic outcomes, students improved their English
proficiency in all groups, which confirms the adequacy of computer-supported collaborative
learning approach usage for English learning purposes. At the same time, the group in
which the students were distributed according to academic performance results (students
with a high level of foreign language proficiency worked in collaboration with the ones
whose level of foreign language training was quite low) showed the highest results, while
the results of the group in which teams were formed on the basis of the students’ personal
choices reflected an insignificant improvement. These conclusions are confirmed by the
results of statistical processing. Thus, we can conclude that the criteria underlying the
principles of forming teams highly influence the indicators of students’ English proficiency;
in particular, the experiment proved the effectiveness of selecting students according to
their academic performance.
Besides the improvements in academic performance, it is also essential that students
should be highly motivated and involved in the collaborative activities. To this end, at the
end of the experiment, the students were asked to complete two questionnaires measuring
their cognitive and emotional engagement in learning the English language. The behavioral
engagement level was also analyzed. Generally, the level of students’ engagement was
high in all the groups, which corroborates the positive impact of computer-supported
collaborative learning for linguists. Students who were grouped in accordance with their
individual preferences showed the highest level of emotional and cognitive engagement,Sustainability 2022, 14, 5908 13 of 16
while students who were split into teams on the basis of their academic performance
showed the highest level of behavioral engagement. Despite the fact that indicators did not
vary significantly, we can confirm that the underlying principles of forming teams influence
the students’ level of engagement.
According to the obtained results on academic performance and students’ engage-
ment, we can state that the learning process based on this model is effective, as indicators
showed positive values. After conducting a correlation analysis of all the indicators under
consideration, we revealed that the engagement of students played an important role and
influenced the outcomes of their learning, and this was especially seen in Group B. We
can conclude that due to the implemented computer-supported collaborative learning
and appropriate criteria of teams’ forming, students were highly engaged in the learning
process and, therefore, accomplished high results.
The theoretical work of other scholars in this field has been a useful resource for
planning and designing, and we expect that our study will provide something of value for
future researchers, too.
The study was based on the work of scientists involved in the analysis of two different
models used: CALL [11–16] and CSCL [43–48]. After studying the results of research
on the application of such educational models in various settings, a proprietary model
was developed, adapted to the local university environment. The main difference from
previous works is the combination of models. In addition, an important part of the study
is the formation of teams and the impact of teamwork on academic performance, English
language development and student engagement.
The results of our study contribute to previous studies [10,11,27,34,46] in terms of
the developed new educational model, which has a positive effect not only on learning
a foreign language, but can also be applied in other areas. The main advantage is the
successful combination of the two previously described models, which contributes to
effective teamwork, stress reduction, increased motivation and, as a result, increased
engagement in the educational process.
Our study has its limitations. Since the research was conducted only in Russia, cultural
differences may influence the results of students in other countries. The study included
only the students specializing in humanities, particularly the ones majoring in linguistics.
Undergraduates studying in technical areas have their own peculiarities, and the results
may differ. In addition, the sample size was quite small as the number of students studying
linguistics at Peter the Great St. Petersburg Polytechnic University is small, but the results
are supposed to be checked every year.
Author Contributions: Conceptualization, A.K. and A.D.; methodology, A.K.; software, T.L.; valida-
tion, T.L., I.G. and D.T.; formal analysis, D.T.; investigation, E.T.; resources, E.T.; data curation, A.K.;
writing—original draft preparation, A.D.; writing—review and editing, A.D.; visualization, A.K.;
supervision, E.T.; project administration, A.K.; funding acquisition, A.D. All authors have read and
agreed to the published version of the manuscript.
Funding: The research is partially funded by the Ministry of Science and Higher Education of the
Russian Federation under the strategic academic leadership program ‘Priority 2030’ (Agreement
075-15-2021-1333 dated 30 September 2021).
Institutional Review Board Statement: The study was conducted in accordance with the Declaration
of Helsinki, and approved by the Institutional Review Board of INSTITUTE OF HUMANITIES
(protocol code 715, 1 September 2021).
Informed Consent Statement: Informed consent was obtained from all subjects involved in the study.
Data Availability Statement: Not applicable.
Conflicts of Interest: The authors declare no conflict of interest.Sustainability 2022, 14, 5908 14 of 16
References
1. Baranova, T.; Kobicheva, A.; Tokareva, E. Web-based Environment in the Integrated Learning Model for CLIL-Learners: Examina-
tion of Students’ and Teacher’s Satisfaction. In Advances in Intelligent Systems and Computing, Proceedings of the Digital Science 2019,
DSIC 2019, Limassol, Cyprus, 11–13 October 2019; Antipova, T., Rocha, A., Eds.; Springer: Cham, Switzerland, 2020; Volume 1114,
pp. 263–274.
2. Baranova, T.; Kobicheva, A.; Tokareva, E. The Impact of an Online Intercultural Project on Students’ Cultural Intelligence
Development. In Knowledge in the Information Society. PCSF 2020, CSIS 2020. Lecture Notes in Networks and Systems; Bylieva, D.,
Nordmann, A., Shipunova, O., Volkova, V., Eds.; Springer: Cham, Switzerland, 2021; Volume 184. [CrossRef]
3. Levy, M. Computer-Assisted Language Learning: Context and Conceptualization; Oxford University Press: Oxford, UK, 1997.
4. Schofield, J.W. Computers and Classroom Culture; Cambridge University Press: Cambridge, UK, 1995.
5. Beatty, K. Teaching & Researching: Computer-Assisted Language Learning; Routledge: Oxfordshire, UK, 2013.
6. Chapelle, C.A. Computer Applications in Second Language Acquisition; Cambridge University Press: Cambridge, UK, 2001.
7. Dudeney, G.; Hockly, N.; Pegrum, M. Digital Literacies: Research and Resources in Language Teaching; Pearson Education Limited:
London, UK, 2013.
8. Hanson-Smith, E. Technology in the Classroom: Practice and Promise in the 21st Century. TESOL Professional Papers#2; Teachers of
English to Speakers of Other Languages, Inc.: Alexandria, VA, USA, 1997.
9. Jaber, W.E. A Survey of Factors Which Influence Teachers’ Use of Computer-Based Technology. Ph.D. Thesis, Virginia Polytechnic
Institute and State University, Blacksburg, VA, USA, 1997.
10. Al-Juhani, S.O. The Effectiveness of Computer-Assisted Instruction in Teaching English as a Foreign Language in Saudi Secondary
School. Ph.D. Thesis, University of Denver, Denver, CO, USA, 1991.
11. Aşkar, P.; Yavuz, H.; Köksal, M. Students’ perceptions of computer assisted instruction environment and their attitudes towards
computer assisted learning. Educ. Res. 1992, 34, 133–139. [CrossRef]
12. Önsoy, S. Students’ and Teachers’ Attitudes towards the Use of Computer-Assisted Language Learning at the Preparatory School
of Celal Bayar University. Ph.D. Thesis, Bilkent University, Ankara, Turkey, 2004.
13. Hirvela, A. Computer-based reading and writing across the curriculum: Two case studies of L2 writers. Comput. Compos. 2005, 22,
337–356. [CrossRef]
14. Min, B.C. A Study of the Attitudes of Korean Adults toward Technology-Assisted Instruction in English-Language Programs.
Ph.D. Thesis, Northern Illinois University, DeKalb, IL, USA, 1998.
15. Tang, L.H. Whole Language Instruction in the Computer-Assisted Instruction Setting: ESL Learners’ Attitudes. Ph.D. Thesis,
Southern Illinois University, Carbondale, IL, USA, 1995.
16. Yang, S.C.; Huang, Y.F. A study of high school English teachers’ behavior, concerns and beliefs in integrating information
technology into English instruction. Comput. Hum. Behav. 2008, 24, 1085–1103. [CrossRef]
17. Chen, Y.L. Modeling the determinants of Internet use. Comput. Educ. 2008, 51, 545–558. [CrossRef]
18. Ludvigsen, S.; Mørch, A. Computer-supported collaborative learning: Basic concepts, multiple perspectives, and emerging trends.
Int. Encycl. Educ. 2010, 5, 290–296.
19. Ludvigsen, S.; Lund, K.; Oshima, J. International handbook of computer-supported collaborative learning. In Computer-Supported
Collaborative Learning Series; Springer: Cham, Switzerland, 2021; Volume 19. [CrossRef]
20. Fischer, G.; Rohde, M.; Wulf, V. Community-based learning: The core competency of residential, research-based universities. Int.
J. Comput.-Support. Collab. Learn. 2007, 2, 9–40. [CrossRef]
21. Stahl, G.; Koschmann, T. Computer-supported collaborative learning: An historical perspective. In Cambridge Handbook of the
Learning Sciences; Cambridge University Press: Cambridge, UK, 2006; pp. 409–426.
22. Al-Emran, M.; Mezhuyev, V.; Kamaludin, A.; ALSinani, M. Development of M-learning application based on knowledge
management processes. In Proceedings of the 2018 7th International Conference on Software and Computer Applications,
Kuantan, Malaysia, 8–10 February 2018; pp. 248–253.
23. Puntambekar, S. Analyzing collaborative interactions: Divergence, shared understanding and construction of knowledge. Comput.
Educ. 2006, 47, 332–351. [CrossRef]
24. Weinberger, A.; Stegmann, K.; Fischer, F. Knowledge convergence in collaborative learning: Concepts and assessment. Learn.
Instr. 2007, 17, 416–426. [CrossRef]
25. Borge, M.; Ong, Y.S.; Rosé, C.P. Learning to monitor and regulate collective thinking processes. Int. J. Comput.-Support. Collab.
Learn. 2018, 13, 61–92. [CrossRef]
26. Darling-Hammond, L.; Hyler, M.E. Preparing educators for the time of COVID . . . and beyond. Eur. J. Teach. Educ. 2020, 43,
457–465. [CrossRef]
27. Haake, J.M.; Pfister, H.R. Scripting a distance-learning university course: Do students benefit from net-based scripted collabora-
tion? Int. J. Comput.-Support. Collab. Learn. 2010, 5, 191–210. [CrossRef]
28. Sobreira, P.; Tchounikine, P. A model for flexibly editing CSCL scripts. Int. J. Comput.-Support. Collab. Learn. 2012, 7, 567–592.
[CrossRef]
29. Sellés, N.H.; Sanmamed, M.G.; Carril, P.C.M. Planning collaborative learning in virtual environments. Comun. Media Educ. Res. J.
2014, 22.Sustainability 2022, 14, 5908 15 of 16
30. Näykki, P.; Isohätälä, J.; Järvelä, S.; Pöysä-Tarhonen, J.; Häkkinen, P. Facilitating socio-cognitive and socio-emotional monitoring
in collaborative learning with a regulation macro script–an exploratory study. Int. J. Comput.-Support. Collab. Learn. 2017, 12,
251–279. [CrossRef]
31. King, A. Scripting collaborative learning processes: A cognitive perspective. In Scripting Computer-Supported Collaborative Learning;
Springer: Boston, MA, USA, 2007; pp. 13–37.
32. Capdeferro, N.; Romero, M. Are online learners frustrated with collaborative learning experiences? Int. Rev. Res. Open Distrib.
Learn. 2012, 13, 26–44. [CrossRef]
33. Garrison, D.R.; Cleveland-Innes, M.; Fung, T.S. Exploring causal relationships among teaching, cognitive and social presence:
Student perceptions of the community of inquiry framework. Internet High. Educ. 2010, 13, 31–36. [CrossRef]
34. Vuopala, E.; Hyvönen, P.; Järvelä, S. Interaction forms in successful collaborative learning in virtual learning environments. Act.
Learn. High. Educ. 2016, 17, 25–38. [CrossRef]
35. Dimulescu, C.; Nechifor, A. Accommodating English for Specific Purposes to Computer Assisted Language Learning. Bull.
Transylvania Univ. Brasov 2021, 14, 5–18. [CrossRef]
36. Yilmaz, F.G.K.; Yilmaz, R. Impact of pedagogic agent-mediated metacognitive support towards increasing task and group
awareness in CSCL. Comput. Educ. 2019, 134, 1–14. [CrossRef]
37. Gikandi, J.W.; Morrow, D.; Davis, N.E. Online formative assessment in higher education: A review of the literature. Comput. Educ.
2011, 57, 2333–2351. [CrossRef]
38. Evans, C. Making sense of assessment feedback in higher education. Rev. Educ. Res. 2013, 83, 70–120. [CrossRef]
39. Sellés, N.H.; Carril, P.C.M.; Sanmamed, M.G. La e-evaluación en el trabajo colaborativo en entornos virtuales: Análisis de la
percepción de los estudiantes. Edutec. Rev. Electrónica Tecnol. Educ. 2018, 65, 16–28.
40. Kwon, K.; Liu, Y.H.; Johnson, L.P. Group regulation and social-emotional interactions observed in computer supported collabora-
tive learning: Comparison between good vs. poor collaborators. Comput. Educ. 2014, 78, 185–200. [CrossRef]
41. Borge, M.; Mercier, E. Towards a micro-ecological approach to CSCL. Int. J. Comput.-Support. Collab. Learn. 2019, 14, 219–235.
[CrossRef]
42. Bowman, N.D.; Akcaoglu, M. “I see smart people!”: Using Facebook to supplement cognitive and affective learning in the
university mass lecture. Internet High. Educ. 2014, 23, 1–8. [CrossRef]
43. Hamid, S.; Waycott, J.; Kurnia, S.; Chang, S. Understanding students’ perceptions of the benefits of online social networking use
for teaching and learning. Internet High. Educ. 2015, 26, 1–9. [CrossRef]
44. Molinillo, S.; Aguilar-Illescas, R.; Anaya-Sánchez, R.; Vallespín-Arán, M. Exploring the impacts of interactions, social presence
and emotional engagement on active collaborative learning in a social web-based environment. Comput. Educ. 2018, 123, 41–52.
[CrossRef]
45. Tarun, I.M. The Effectiveness of a Customized Online Collaboration Tool for Teaching and Learning. J. Inf. Technol. Educ. 2019, 18,
275–292. [CrossRef]
46. Lyons, K.M.; Lobczowski, N.G.; Greene, J.A.; Whitley, J.; McLaughlin, J.E. Using a design-based research approach to develop
and study a web-based tool to support collaborative learning. Comput. Educ. 2021, 161, 104064. [CrossRef]
47. Strijbos, J.W.; Martens, R.L.; Jochems, W.M. Designing for interaction: Six steps to designing computer-supported group-based
learning. Comput. Educ. 2004, 42, 403–424. [CrossRef]
48. Riga, A.; Ioannidi, V.; Papayiannis, N. Study on Computer Supported Collaborative Learning in Greek Inclusive Secondary
Education. Curr. Res. Lang. Lit. Educ. 2021, 2, 45–56.
49. Rao, P.S. Collaborative learning in English language learning environment. Res. J. Engl. Lang. Lit. RJELAL 2019, 7, 330–339.
50. Laal, M.; Laal, M. Collaborative learning: What is it? Procedia—Soc. Behav. Sci. 2012, 31, 491–495. [CrossRef]
51. Li, J.; Mak, L. The effects of using an online collaboration tool on college students’ learning of academic writing skills. System
2022, 105, 102712. [CrossRef]
52. Hakkarainen, K. Emergence of Progressive-Inquiry Culture in Computer-Supported Collaborative Learning. Learn. Environ. Res.
2003, 6, 199–220. [CrossRef]
53. Oakley, B.; Felder, R.M.; Brent, R.; Elhajj, I. Turning student groups into effective teams. J. Stud. Cent. Learn. 2004, 2, 9–34.
54. Aritzeta, A.; Senior, B.; Swailes, S. Team role preference and cognitive styles: A convergent validity study. Small Group Res. 2005,
36, 404–436. [CrossRef]
55. Del Barco, B.L.; Mendo-Lázaro, S.; Felipe-Castaño, E.; del Río, M.I.P.; Fajardo-Bullón, F. Potencia de equipo y aprendizaje
cooperativo en el ámbito universitario. Rev. Psicodidáctica 2017, 22, 9–15. [CrossRef]
56. Leung, W.S. Bad blood: Managing toxic relationships through belbin roles for first year software engineering students. In
Proceedings of the 3rd International Conference on Communication and Information Processing, Tokyo, Japan, 24–26 November
2017; pp. 82–86.
57. Loughry, M.L.; Ohland, M.W.; Woehr, D.J. Assessing teamwork skills for assurance of learning using CATME team tools. J. Mark.
Educ. 2014, 36, 5–19. [CrossRef]
58. Pieterse, V.; Thompson, L. Academic alignment to reduce the presence of ‘social loafers’ and ‘diligent isolates’ in student teams.
Teach. High. Educ. 2010, 15, 355–367. [CrossRef]
59. Prichard, J.S.; Stanton, N.A. Testing Belbin’s team role theory of effective groups. J. Manag. Dev. 1999, 18, 652–665. [CrossRef]You can also read