Exploring the Relationship among Mathematics Attitude, Gender, and Achievement of Undergraduate Health Science Students
←
→
Page content transcription
If your browser does not render page correctly, please read the page content below
MATHEMATICS TEACHING RESEARCH JOURNAL                                                          5
                                   Vol 13, no 3
                                  FALL 2021

  Exploring the Relationship among Mathematics Attitude, Gender, and
         Achievement of Undergraduate Health Science Students
                                            Abraham Ayebo, Molly Dingel

                                      University of Minnesota Rochester, USA
                                     aayebo@r.umn.edu, dinge016@r.umn.edu

          Abstract: The purpose of this study was to investigate the gender differences in students'
          attitude toward mathematics and how attitude impacts achievement in the course. The
          sample consisted of 172 undergraduate health science students (123 women, 49 men)
          enrolled in mathematics courses at a University in the Midwestern United States. Data
          were collected using a 20-item self-report survey adapted from the TIMSS 2011 context
          questionnaire. Independent sample t-test, Pearson correlation analysis and Path analysis
          were performed on the data. We found that there is a positive relationship between
          mathematics attitude and achievement. There is also a statistically significant gender
          difference for students liking of mathematics, with men reporting higher scores than
          women.
                                                  INTRODUCTION
          In recent times, studies of learning mathematics have expanded to include conceptions and
beliefs of mathematics (Andrews & Hatch, 2000; Cai & Wang, 2010), motivation and self-
regulation (Cleary & Chen, 2009; Meyer & Turner, 2002; Schmitz & Perels, 2011), self-concept,
self-esteem and self-efficacy (Bong & Skaalvik, 2003; Parker, Marsh, Ciarrochi, Marshall, &
Abduljabbar, 2014; Skaalvik & Skaalvik, 2006). The general view is that people are not only
cognitive individuals but also social persons with emotions and beliefs that influence their
development as learners. People's behavior and choices, when confronted with a task, are

   Readers are free to copy, display, and distribute this article as long as the work is attributed to the author(s) and Mathematics
Teaching-Research Journal Online, it is distributed for non-commercial purposes only, and no alteration or transformation is made in
    the work. All other uses must be approved by the author(s) or MTRJ. MTRJ is published by the City University of New York.
                                           http://www.hostos.cuny.edu/mtrj/
MATHEMATICS TEACHING RESEARCH JOURNAL 6
Vol 13, no 3
FALL 2021
determined more by their attitudes, emotions, beliefs and personal theories, rather than by their
knowledge of the specifics of the task. As such, efforts to improve mathematics education must
take these attitudes into account.
The term attitude generally refers to an individual's learned tendency to respond either
positively or negatively to a situation or concept, or in this case, towards mathematics (McLeod,
1994). Hart (1989) characterized attitude towards mathematics as consisting of three components:
an emotional response to mathematics, a conception about mathematics, and a behavioral tendency
toward mathematics. Ma and Kishor (1997) defined attitudes towards mathematics as "an
aggregated measure of a liking or disliking of mathematics, a tendency to engage in or avoid
mathematical activities, a belief that one is good or bad at mathematics, and a belief that
mathematics is useful or useless" (p. 27).
Mathematics Attitude and Achievement
Many scholars have observed that students' attitudes are associated with their performance
in mathematics. Pajares and Graham (1999) observed that mathematics self-efficacy was
significantly related to the performance of middle school students. House (1993) observed that
students who had higher academic self-concept earned higher grades in mathematics. Additionally,
House (1995) found that several aspects of academic self-concept and achievement expectancies
were significantly associated with mathematics achievement. These findings emerge across
cultures and ages. In a study of high school students in Hong Kong, Rao, Moely, and Sachs (2000)
observed that self-concept was a significant predictor of mathematics performance. Results of a
study of elementary and middle school students showed that initial mathematics achievement was
significantly related to mathematics self-concept (Skaalvik & Valas, 1999).
Though students’ mathematics achievement is linked to their attitudes toward mathematics,
the direction of this relationship is not agreed upon. Some studies claim that students’ mathematics
Readers are free to copy, display, and distribute this article as long as the work is attributed to the author(s) and Mathematics
Teaching-Research Journal Online, it is distributed for non-commercial purposes only, and no alteration or transformation is made in
the work. All other uses must be approved by the author(s) or MTRJ. MTRJ is published by the City University of New York.
http://www.hostos.cuny.edu/mtrj/MATHEMATICS TEACHING RESEARCH JOURNAL 7
Vol 13, no 3
FALL 2021
attitude is formed and influenced by achievement in mathematics (Pajares & Graham, 1999;
House, 2003). Conversely, other studies suggest that mathematics achievement occurs as a result
of students’ attitude toward the subject (Di Martino & Zan, 2011; Goldin, 2002). Marsh and Young
(1997) also observed that adolescent students’ academic self-concept had a significant causal
effect on their mathematics achievement. Trautwein, Lüdtke, Marsh, Köller, & Baumert (2006)
observed that once students gain interest in the mathematics course, they may be likely to surpass
initial achievement expectations. Hence, a student's attitude can affect their achievement in
mathematics. Another school of thought is that the effect one has on the other is cyclical. Abu-
Hilal (2000) observed that the views of students regarding the importance of mathematics had a
significant effect on their mathematics performance, and that mathematics performance results in
an increase in self-concept. That is, mathematics attitude is influencing achievement and
achievement is influencing mathematics attitude simultaneously. Other studies (Ma & Xu, 2004;
Michelli, 2013) did not find any relationship between attitudes and achievement.
In sum, this body of research confirms the importance of attitudes on students’
performance. Further, we operate under the assumption that attitudes are not innate but result from
experiences that can be changed. Students’ attitudes toward mathematics are critical to understand
because they affect how invested students will be in their approach to learning mathematics, and
how much enjoyment they derive from it (Moenikia, M., & Zahed-Babelan, 2010). Therefore, even
moderate attitude changes could ultimately impact cognitive processing and achievement.
Mathematics Attitude and Gender
Earlier studies on mathematics attitudes reported significant gender differences in favor of
men (Fennema & Sherman, 1976). However, with time, the trends became more complex and
tenuous. While some studies emphasized that males showed more positive attitudes towards
mathematics than females (Michelli, 2013; Tasdemir, 2009); other studies found just the opposite
Readers are free to copy, display, and distribute this article as long as the work is attributed to the author(s) and Mathematics
Teaching-Research Journal Online, it is distributed for non-commercial purposes only, and no alteration or transformation is made in
the work. All other uses must be approved by the author(s) or MTRJ. MTRJ is published by the City University of New York.
http://www.hostos.cuny.edu/mtrj/MATHEMATICS TEACHING RESEARCH JOURNAL 8
Vol 13, no 3
FALL 2021
(Savas & Duru, 2005). Ma and Xu (2004) stated that both males’ and females’ attitude scores
decrease in the same manner across grade levels indicating no gender difference regarding
mathematics attitude among secondary school students.
Schoenfeld (1989) conducted a study with high school students and found that gender differences
were consistently negligible. Pajares and Graham (1999) did not find gender differences in
mathematics attitudes in their study with gifted middle school students. A study conducted by
Kenney-Benson, Pomerantz, Ryan and Patrick (2008) using students in 5th and 7th grades found
significant differences in mathematics attitudes by gender in favor of girls. Hall (2012) found that
gender gaps in mathematics attitudes and achievement at the elementary and secondary level were
statistically insignificant, with boys scoring higher than girls. Research shows that gender gaps in
mathematics carry on after high school. For instance, males in the United States regularly score
higher on the mathematics section of the Scholastic Aptitude Test (SAT) than their female
counterparts (Chubbuck et al., 2016). Also, in Turkey, males in college outperformed females in
mathematics (Saygin, 2020).
A meta-analysis by Hyde et al. (1990) showed that there are gender-based inconsistencies
in attitudes towards mathematics. Emotions are typically discussed in the literature on gender
differences in mathematics. For example, Brush (1985) noted a feelings factor in mathematics
learning, and observed that this feelings factor was highly predictive of the level of students’ course
preferences.
Stipek and Gralinsky’s (1991) noted that females attributed failure to low ability, while
attributing success to luck. Girls were further found to report less pride after success and a stronger
desire to hide their paper after failure, a behavior interpreted as representing feelings of shame.
Readers are free to copy, display, and distribute this article as long as the work is attributed to the author(s) and Mathematics
Teaching-Research Journal Online, it is distributed for non-commercial purposes only, and no alteration or transformation is made in
the work. All other uses must be approved by the author(s) or MTRJ. MTRJ is published by the City University of New York.
http://www.hostos.cuny.edu/mtrj/MATHEMATICS TEACHING RESEARCH JOURNAL 9
Vol 13, no 3
FALL 2021
Aim of the Study
The aim of this study is to investigate the gender differences in students' attitudes toward
mathematics and how attitudes impacts achievement in the course. The specific research questions
for this study are:
1. What differences exist between the way women and men characterize their attitudes toward
mathematics in a health science institution?
2. How are undergraduate health science students' attitude toward mathematics (liking, value, and
confidence in mathematics) related to their mathematics achievement (measured by their final
grade in the course)?
METHOD
Participants
The participants of this study were 172 undergraduate health science students (49 men, 123
women) enrolled in mathematics courses at a research university in the Midwest. The mathematics
classes were College Algebra, Precalculus, and Calculus. Students were asked to complete the
survey, which was provided through a link to a google form during the first week of classes.
Participation was voluntary. Ethical approval for this study was granted by the University's
Institutional Review Board.
Instrumentation
A 20-item survey instrument, adapted from the TIMSS 2011 contextual questionnaire
(House & Telese, 2014; Khine, Al-Mutawah, & Afari, 2015) was used to measure students'
attitudes toward mathematics. We used a 4-point Likert scale (1 = strongly disagree, 2 = disagree,
3= agree, 4= strongly agree) which consists of three 3 subscales: liking, value, and confidence.
Liking measures the extent to which student report how much they like mathematics (e.g. 'I enjoy
learning mathematics'). It comprises five items. Value measures students' perception of the value
Readers are free to copy, display, and distribute this article as long as the work is attributed to the author(s) and Mathematics
Teaching-Research Journal Online, it is distributed for non-commercial purposes only, and no alteration or transformation is made in
the work. All other uses must be approved by the author(s) or MTRJ. MTRJ is published by the City University of New York.
http://www.hostos.cuny.edu/mtrj/MATHEMATICS TEACHING RESEARCH JOURNAL 10
Vol 13, no 3
FALL 2021
they place in mathematics and its importance to their personal and professional goals (e.g. 'I need
to do well in mathematics to get the job I want'). It has six items. Confidence measures students'
perception of how confident they feel when working on mathematics problems (e.g. 'I usually do
well in mathematics'). It is measured by nine items.
Statistical analysis
In order to answer our first research question, an independent sample t-test was performed
to compare the mean scores of men's and women's attitude toward mathematics using IBM SPSS
version 23. The second research question was addressed by means of a Pearson Correlation
analysis and a Path analysis using AMOS version 23 (Arbuckle, 2015).
RESULTS
Table 1 summarizes means, standard deviations, and mean differences of the TIMSS 2011
constructs. The mean scores range from 2.45 to 3.61 for men, and 2.37 to 3.57 for women on a 4-
point Likert scale. This shows that the sample in this study held mostly positive attitudes toward
mathematics. Also, in all but three of the items (items 5, 18 and 19), men had higher scores than
women.
Table 1: Mean and Standard Deviation of Survey Items (0= strongly disagree; 4 = strongly agree)
All Men Women
(n=123)
(n=172) (n=49)
Item Mea SD Mea SD Mea SD Mean
n n n Difference
Readers are free to copy, display, and distribute this article as long as the work is attributed to the author(s) and Mathematics
Teaching-Research Journal Online, it is distributed for non-commercial purposes only, and no alteration or transformation is made in
the work. All other uses must be approved by the author(s) or MTRJ. MTRJ is published by the City University of New York.
http://www.hostos.cuny.edu/mtrj/MATHEMATICS TEACHING RESEARCH JOURNAL 11
Vol 13, no 3
FALL 2021
(Men -
Women)
Liking
1. I enjoy learning mathematics. 3.06 0.7 3.18 0.7 3.02 0.8 0.16
9 6 0
2. I wish I did not have to study mathematics. 2.96 0.9 3.04 0.8 2.92 0.9 0.12
2 7 5
3. Mathematics is boring. 3.10 0.7 3.16 0.6 3.08 0.7 0.08
1 6 3
4. I learn many interesting things about 2.94 0.7 2.98 0.8 2.92 0.7 0.06
mathematics. 7 8 3
5. I like mathematics. 2.92 0.8 2.90 0.7 2.93 0.8 -0.03
5 7 8
Value
6. I think learning mathematics will help me in 3.03 0.8 3.16 0.9 2.98 0.7 0.19
my daily life. 1 2 5
7. I need mathematics to learn other subjects. 3.37 0.7 3.43 0.7 3.34 0.7 0.09
0 1 0
8. I need to do well in mathematics to get into 3.53 0.6 3.65 0.5 3.48 0.6 0.17
my desired program. 2 6 3
9. I need to do well in mathematics to get the 3.33 0.7 3.45 0.7 3.28 0.7 0.16
job I want. 7 9 5
10. I would like a job that involves using 2.45 0.8 2.65 0.9 2.37 0.8 0.29
mathematics. 5 0 2
Readers are free to copy, display, and distribute this article as long as the work is attributed to the author(s) and Mathematics
Teaching-Research Journal Online, it is distributed for non-commercial purposes only, and no alteration or transformation is made in
the work. All other uses must be approved by the author(s) or MTRJ. MTRJ is published by the City University of New York.
http://www.hostos.cuny.edu/mtrj/MATHEMATICS TEACHING RESEARCH JOURNAL 12
Vol 13, no 3
FALL 2021
11. It is important to do well in mathematics. 3.61 0.5 3.71 0.5 3.57 0.5 0.15
2 4 1
Confidence
12. I usually do well in mathematics. 3.10 0.7 3.29 0.7 3.02 0.7 0.26
2 4 1
13. Mathematics is more difficult for me than 2.77 0.9 2.88 0.9 2.72 0.9 0.15
for many of my colleagues. 4 3 4
14. Mathematics is not one of my strengths. 2.73 1.0 2.94 0.9 2.65 1.0 0.29
1 7 2
15. I learn things quickly in mathematics. 2.58 0.8 2.73 0.7 2.51 0.8 0.22
3 9 4
16. Mathematics makes me confused and 2.69 0.9 2.88 0.8 2.61 1.0 0.27
nervous. 6 1 1
17. I am good at working out difficult 2.47 0.8 2.73 0.7 2.37 0.8 0.37
mathematics problems. 0 3 0
18. My colleagues think I can do well in 2.96 0.7 2.94 0.7 2.97 0.6 -0.03
mathematics. 0 5 8
19. My colleagues tell me I am good at 2.82 0.7 2.82 0.8 2.82 0.7 -0.01
mathematics. 9 1 8
20. Mathematics is harder for me than any other 2.95 1.0 3.06 0.9 2.91 1.0 0.15
subject. 0 9 1
The results of an independent sample t-test showed that there were no statistically
significant differences for liking, t(170) = 0.79, p = 0.432 and confidence, t(170) = 1.74, p = 0.084.
Although men’s mean scores were slightly higher (MLiking = 3.55 and MConfidence = 2.92) than those
Readers are free to copy, display, and distribute this article as long as the work is attributed to the author(s) and Mathematics
Teaching-Research Journal Online, it is distributed for non-commercial purposes only, and no alteration or transformation is made in
the work. All other uses must be approved by the author(s) or MTRJ. MTRJ is published by the City University of New York.
http://www.hostos.cuny.edu/mtrj/MATHEMATICS TEACHING RESEARCH JOURNAL 13
Vol 13, no 3
FALL 2021
for women (MLiking = 2.97 and MConfidence = 2.73), these differences were not statistically significant
(see Table 2). In contrast, a statistically significant difference was found for value, t(170 ) = 2.07,
p < 0.05, with men scoring higher (MValue = 3.34) than women (MValue = 3.17). Cohen’s effect size
of d = 0.34 implies a small effect.
Table 2: Mean and standard deviation of men's and women's perception of their attitude toward
mathematics and effect size estimates for differences between samples
Men(49) Women(123) Effect Size
Mean SD Mean SD t-value p-value (Cohen's d)
Liking 3.05 .57 2.97 .62 .79 .432 0.13
Value 3.34 .51 3.17 .50 2.07 .040* 0.34
Confidenc
2.92 .55 2.73 .66 1.74 .084 0.31
e
Overall 3.08 .42 2.92 .47 2.01 .046* 0.36
Table 3 shows the associations between students’ attitudes toward mathematics and their
mathematics achievement. The correlation coefficients range from 0.02 and 0.58. There is a
positive, albeit small correlation between Confidence and Grade (r = 0.257, p < 0.01). The
correlations between the attitude factors of Liking and Value, and Grade are not significant.
Table 3: Pearson correlations among the affective scales and grade for all participants
Variable Grade Liking Value Confidence
Grade 1
Readers are free to copy, display, and distribute this article as long as the work is attributed to the author(s) and Mathematics
Teaching-Research Journal Online, it is distributed for non-commercial purposes only, and no alteration or transformation is made in
the work. All other uses must be approved by the author(s) or MTRJ. MTRJ is published by the City University of New York.
http://www.hostos.cuny.edu/mtrj/MATHEMATICS TEACHING RESEARCH JOURNAL 14
Vol 13, no 3
FALL 2021
Liking .121 1
Value .020 .367** 1
Confidenc
.257** .583** .223** 1
e
Note: **. Correlation is significant at the 0.01 level (2-tailed).
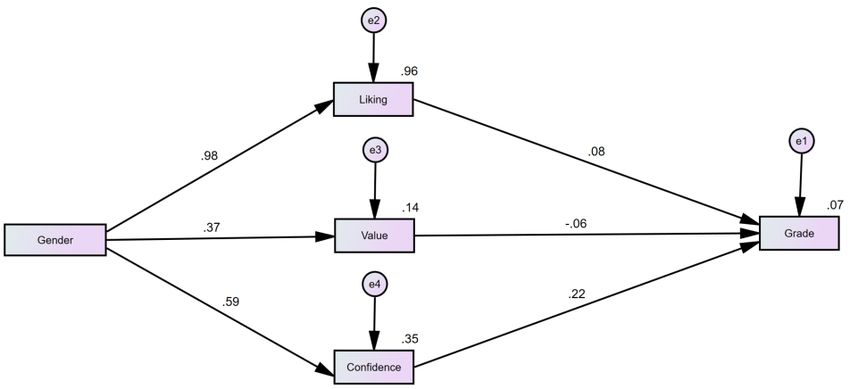
The Path diagram is shown in Figure 1, and the fit indices for the Path analysis are shown
in Table 4. The chi square value of 1.337 was not significant (p = 0.248), and the GFI (0.996), NFI
(0.998), TLI (0.980), CFI (0.997), SRMR (0.021), and RMSEA (0.044) showed values that, taken
together, suggest that the model was an excellent fit to the data.
Gender was a statistically significant predictor of both the hypothesized mediator variables
of confidence (standardized regression coefficient = 0.595, unstandardized regression coefficient
= 0.640 with a standard error of 0.178, p < 0.001) and value (standardized regression coefficient
= 0.375, unstandardized regression coefficient = 0.318 with a standard error of 0.102, p < 0.01).
Also, confidence was a statistically significant predictor of grade (standardized regression
coefficient = 0.224, unstandardized regression coefficient 2.748 with a standard error of 0.929, p
< 0.01). However, value did not influence grade in that it did not yield a statistically significant
path to grade (standardized regression coefficient = -0.059, unstandardized regression coefficient
= -0.912 with a standard error of 10178, p = 0.439).
Readers are free to copy, display, and distribute this article as long as the work is attributed to the author(s) and Mathematics
Teaching-Research Journal Online, it is distributed for non-commercial purposes only, and no alteration or transformation is made in
the work. All other uses must be approved by the author(s) or MTRJ. MTRJ is published by the City University of New York.
http://www.hostos.cuny.edu/mtrj/MATHEMATICS TEACHING RESEARCH JOURNAL 15
Vol 13, no 3
FALL 2021
Figure 1: Path diagram for the model
Table 4: Fit indices for the model
Model fit indices Values Recommended guidelines
χ2 1.337, p = 0.248 Nonsignificant
χ2 / df 1.337 < 5.00
TLI 0.980 ≥ 0.90
CFI 0.997 ≥ 0.90
GFI 0.996 ≥ 0.90
RMSEA 0.044 ≤ 0.08
SRMR 0.021 ≤ 0.05
Readers are free to copy, display, and distribute this article as long as the work is attributed to the author(s) and Mathematics
Teaching-Research Journal Online, it is distributed for non-commercial purposes only, and no alteration or transformation is made in
the work. All other uses must be approved by the author(s) or MTRJ. MTRJ is published by the City University of New York.
http://www.hostos.cuny.edu/mtrj/MATHEMATICS TEACHING RESEARCH JOURNAL 16
Vol 13, no 3
FALL 2021
DISCUSSION
This study investigated gender differences in students’ attitude toward mathematics as
well as the effect of mathematics attitude on students' grade at an undergraduate health science
institution in the Midwestern United States. The results of both the descriptive statistics and
correlation analysis show that overall, students' attitudes toward mathematics had a positive
relationship with their mathematics achievement. Students who reported that they usually did well
in mathematics also tended to earn higher grades. Similarly, students who felt they learned things
quickly in mathematics also earned higher grades. Conversely, students who reported negative
comparisons of themselves to their classmates tended to earn low grades. Students who showed
high achievement levels were also more likely to feel that they were good at working out difficult
problems.
These findings are consistent with recent research results (Ethington, 1992; Ethington &
Wolfle, 1984; Ganley & Vasilyeva, 2011; Lloyd, Walsh, & Yailagh, 2005; Nosek & Smyth, 2011).
The confidence scale was found to significantly predict students’ achievement. This is consistent
with the findings of Khine, Al-Mutawah, & Afari (2015). It is also important for mathematics
instructors to take the necessary measures to ensure that we not only focus on the mathematics
content, but also attend to the affective needs of students. In particular, teachers must ensure that
they instill confidence in students who have no confidence in themselves.
We also found that there was no statistically significant difference between men and
women for the mathematics attitude scales, except for liking, where men reported higher scores
than women. Thus, mathematics educators need to examine practices and policies to try to
understand the reason behind the existence of the gender imbalance. There may be instructional
practices that unintentionally contribute to the gender difference.
Readers are free to copy, display, and distribute this article as long as the work is attributed to the author(s) and Mathematics
Teaching-Research Journal Online, it is distributed for non-commercial purposes only, and no alteration or transformation is made in
the work. All other uses must be approved by the author(s) or MTRJ. MTRJ is published by the City University of New York.
http://www.hostos.cuny.edu/mtrj/MATHEMATICS TEACHING RESEARCH JOURNAL 17
Vol 13, no 3
FALL 2021
Limitations and Future Studies
One limitation of this study is that a convenience sample of undergraduate students enrolled
in a health science program were recruited as research participants; thus, due to the nature of the
population there was a disproportionate number of females and Caucasian students in the sample.
Therefore the sample was not as diverse as one would expect. Another limitation is that the study
was based on self-reported data which can promote bias. Therefore, caution should be taken in
generalizing this study to other samples with different demographics.
The findings from this study provide several directions for further studies. For example,
additional studies are needed to determine if findings observed in this study would be apparent for
students from other institutions whose settings are different from the one in this study. In addition,
further research is needed to assess the relationship between students' math attitude and
achievement outcomes in other academic disciplines.
References
[1] Andrews, P., & Hatch, G. (2000). A comparison of Hungarian and English teachers' conceptions of
mathematics and its teaching. Educational Studies in Mathematics, 43(1), 31-64.
https://doi.org/10.1023/A:1017575231667
[2] Arbuckle, J. L. (2015). IBM SPSS Amos user’s guide [Computer software and manual].
[3] Bong, M., & Skaalvik, E. M. (2003). Academic self-concept and self-efficacy: How different are they
really? Educational psychology review, 15(1), 1- 40. https://doi.org/10.1023/A:1021302408382
[4] Brush, L. R. (1985). Cognitive and affective determinants of course preferences and plans. Women and
mathematics: Balancing the equation, 123-150.
[5] Cai, J., & Wang, T. (2010). Conceptions of effective mathematics teaching within a cultural context:
Perspectives of teachers from China and the United States. Journal of Mathematics Teacher
Education, 13(3), 265-287. https://doi.org/10.1007/s10857-009-9132-1
[6] Chubbuck, K., Curley, W., & King, T. (2016). Who’s on first? Gender differences in performance on
the SAT test on critical reading items with sports and science content. ETS Research Report Series,
Readers are free to copy, display, and distribute this article as long as the work is attributed to the author(s) and Mathematics
Teaching-Research Journal Online, it is distributed for non-commercial purposes only, and no alteration or transformation is made in
the work. All other uses must be approved by the author(s) or MTRJ. MTRJ is published by the City University of New York.
http://www.hostos.cuny.edu/mtrj/MATHEMATICS TEACHING RESEARCH JOURNAL 18
Vol 13, no 3
FALL 2021
2, 1–116. https:// doi.org/10.1002/ets2.12109
[7] Cleary, T. J., & Chen, P. P. (2009). Self-regulation, motivation, and math achievement in middle
school:
Variations across grade level and math context. Journal of school psychology, 47(5), 291-314.
[8] Fennema, E., & Sherman, J. A. (1976). Fennema-Sherman Mathematics Attitudes Scales: Instruments
designed to measure attitudes toward the learning of mathematics by males and females. Journal
for Research in Mathematics Education, 7, 324-326. https://doi.org/10.2307/748467
[9] Ganley, C. M., & Vasilyeva, M. (2011). Sex differences in the relation between math performance,
spatial skills, and attitudes. Journal of Applied Developmental Psychology, 32, 235-242.
https://doi.org/10.1016/j.appdev.2011.04.001
[10] Gutstein, E., Fey, J. T., Heid, M. K., DeLoach-Johnson, I., Middleton, J. A., Larson, M., & Tunis, H.
(2005). Equity in school mathematics education: How can research contribute? Journal for
Research in Mathematics Education, 92-100. https://doi.org/10.2307/30034826
[11] Hart, L. (1989). Describing the affective domain: Saying what we mean. In D. B. McLeod and V. M.
Adams (Eds), Affect and Mathematical Problem-Solving: A New Perspective (pp. 37-45). New
York: Springer-Verlag.
[12] House, J. D. (2003). Self-beliefs and science and mathematics achievement of adolescent students in
Hong Kong: Findings from the Third International Mathematics and Science Study
(TIMSS). International Journal of Instructional Media, 30(2), 195.
[13] House, J. D., & Telese, J. A. (2014). Confidence in mathematics and algebra achievement of eighth-
grade students in Japan: Findings from the TIMSS 2011 assessment. Education, 135(2), 252-256.
[14] Hyde, J. S., Fennema, E., Ryan, M., Frost, L. A., & Hopp, C. (1990). Gender comparisons of
mathematics attitudes and affect: A meta-analysis. Psychology of women quarterly, 14(3), 299-
324. https://doi.org/10.1111/j.1471-6402.1990.tb00022.x
[15] Kenney-Benson, G. A., Pomerantz, E. M., Ryan, A. M., & Patrick, H. (2005). Sex differences in
math performance: The role of children’s approach to schoolwork. Developmental Psychology, 42, 11–
26. https://doi.org/10.1037/0012-1649.42.1.11
Readers are free to copy, display, and distribute this article as long as the work is attributed to the author(s) and Mathematics
Teaching-Research Journal Online, it is distributed for non-commercial purposes only, and no alteration or transformation is made in
the work. All other uses must be approved by the author(s) or MTRJ. MTRJ is published by the City University of New York.
http://www.hostos.cuny.edu/mtrj/MATHEMATICS TEACHING RESEARCH JOURNAL 19
Vol 13, no 3
FALL 2021
[16] Khine, M. S., Al-Mutawah, M., & Afari, E. (2015). Determinants of affective factors in mathematics
achievement: Structural equation modeling approach. Journal of Studies in Education, 5(2), 199-
211. http://dx.doi.org/10.5296/jse.v5i2.7484
[17] Lindberg, S. M., Hyde, J. S., Petersen, J. L., & Linn, M. C. (2010). New trends in gender and
mathematics performance: A meta-analysis. Psychological Bulletin, 136(6), 1123-1135.
https://doi.org/10.1037/a0021276
[18] Liu, O. L., & Wilson, M. (2009). Gender differences in large-scale math assessments: PISA trend 2000
and 2003. Applied Measurement in Education, 22, 164-184.
https://doi.org/10.1080/08957340902754635
[19] Lloyd, J. E. V., Walsh, J., & Yailagh, M. S. (2005). Sex differences in performance attributions, self-
efficacy, and achievement in mathematics: If I'm so smart, why don't I know it? Canadian Journal
of Education, 28(3), 384-408. https://doi.org/10.2307/4126476
[20] Ma, X., and Kishor, N. (1997). Assessing the relationship between attitude towards mathematics and
achievement in mathematics: A meta-analysis. Journal for Research in Mathematics Education,
28, 26-47. https://doi.org/10.2307/749662
[21] Ma, X., & Xu, J. (2004). Determining the causal ordering between attitude toward mathematics and
achievement in mathematics. American journal of education, 110(3), 256-280.
https://doi.org/10.1086/383074
[22] Mcleod, B.D. (1994). Research on affect and mathematics learning in the JRME: 1970 to the present.
Journal for Research in Mathematics Education, 25(6), 637-647. https://doi.org/10.2307/749576
[23] Meyer, D. K., & Turner, J. C. (2002). Using instructional discourse analysis to study the scaffolding
of student self-regulation. Educational psychologist, 37(1), 17-25.
https://doi.org/10.1207/S15326985EP3701_3
[24] Michelli, M. P. (2013). The relationship between attitudes and achievement in mathematics among
fifth grade students.
[25] Moenikia, M., & Zahed-Babelan, A. (2010). A study of simple and multiple relations between
mathematics attitude, academic motivation and intelligence quotient with mathematics
Readers are free to copy, display, and distribute this article as long as the work is attributed to the author(s) and Mathematics
Teaching-Research Journal Online, it is distributed for non-commercial purposes only, and no alteration or transformation is made in
the work. All other uses must be approved by the author(s) or MTRJ. MTRJ is published by the City University of New York.
http://www.hostos.cuny.edu/mtrj/MATHEMATICS TEACHING RESEARCH JOURNAL 20
Vol 13, no 3
FALL 2021
achievement. Procedia-Social and Behavioral Sciences, 2(2), 1537-1542.
[26] Nosek, B. A., & Smyth, F. L. (2011). Implicit social cognitions predict sex differences in math
engagement and achievement. American Educational Research Journal, 48(5), 1125-1156.
https://doi.org/10.3102/0002831211410683
[27] Pajares, F., & Graham, L. (1999). Self-Efficacy, motivation constructs, and mathematics performance
of entering middle school students. Contemporary Educational Psychology, 24, 124-139.
https://doi.org/10.1006/ceps.1998.0991
[28] Parker, P. D., Marsh, H. W., Ciarrochi, J., Marshall, S., & Abduljabbar, A. S. (2014). Juxtaposing math
self-efficacy and self-concept as predictors of long-term achievement outcomes. Educational
Psychology, 34(1), 29-48. https://doi.org/10.1080/01443410.2013.797339
[29] Saygin, P. O. (2020). Gender bias in standardized tests: Evidence from a centralized college admissions
system. Empirical Economics, 59(2), 1037–1065. https://doi.org/10.1007/s00181-019-01662-z
[30] Schoenfeld, A. H. (1989). Explorations of students' mathematical beliefs and behavior. Journal for
Research in Mathematics Education, 20, 338-355. https://doi.org/10.2307/749440
[31] Schmitz, B., & Perels, F. (2011). Self-monitoring of self-regulation during math homework behavior
using standardized diaries. Metacognition and Learning, 6(3), 255-273.
https://doi.org/10.1007/s11409-011-9076-6
[32] Skaalvik, E. M., & Skaalvik, S. (2006). Self-concept and self-efficacy in mathematics: Relation with
mathematics motivation and achievement. The concept of self in education, family and sports, 51-
74.
[33] Trautwein, U., Lüdtke, O., Marsh, H. W., Köller, O., & Baumert, J. (2006). Tracking, grading, and
student motivation: Using group composition and status to predict self-concept and interest in
ninth-grade mathematics. Journal of educational psychology, 98(4), 788.
https://doi.org/10.1037/0022-0663.98.4.788
[34] Young-Loveridge, J. (2010). Two Decades of Mathematics Education Reform in New Zealand: What
Impact on the Attitudes of Teacher Education Students? Mathematics Education Research Group
of Australasia.
Readers are free to copy, display, and distribute this article as long as the work is attributed to the author(s) and Mathematics
Teaching-Research Journal Online, it is distributed for non-commercial purposes only, and no alteration or transformation is made in
the work. All other uses must be approved by the author(s) or MTRJ. MTRJ is published by the City University of New York.
http://www.hostos.cuny.edu/mtrj/You can also read